Chapter 2: The “evolved” model: SAVE

In 2013 some marketing experts (Ettenson, Conrado and Knowles) published an article in the Harvard Business Review, titled “Rethinking the 4Ps”, in which they describe a more “modern” version of Kotler's traditional 4P model.3 They described their marketing framework as “SAVE”:
a. SOLUTION
b. ACCESS
c. VALUE
d. EDUCATION
Essentially, it comes down to the fact that the classic 4Ps are no longer adequate in this digital world and can be better defined as SAVE: “Product” becomes “Solution”. As a marketer, you’d better define the offerings by needs, not by features, function or technological superiority.
“Place” becomes “Access”. As marketer you need to develop an integrated omni-channel presence that considers customers’ entire purchase journey instead of emphasising individual purchase locations and channels.
Chapter 2: The “evolved” model: SAVE
“Price” becomes “Value”. Rather than stressing how price relates to production costs, profit margins or competitors’ prices, it would be better to articulate the benefits relative to price.
“Promotion” becomes “Education”. As a marketer you’d better Provide information relevant to customers’ specific needs at each point of the purchase cycle or customer journey, rather than relying on advertising, PR, and personal selling.
It’s clear that this SAVE model tackles certain of the above-mentioned disadvantages of the traditional 4Ps model. SAVE is more in line with the digital world around us, more focused on customer-centricity and on service-related marketing. In the next chapters, we’re going to describe each element of the model more in detail.
Focus on SOLUTION
Define offerings by the needs they meet, not by their features, functions, or technological superiority
Focus on ACCESS
Develop an integrated cross-channel presence that considers customers' entire purchase journey instead of emphasising individual purchase locations and channels
Focus on VALUE
Articulate the benefits relative to price, rather than stressing how price relates to production costs, profit margins or competitors' prices
Focus on EDUCATION
Provide information relevant to customers' specific needs at each point in the purchase cycle, rather than relying on advertising, PR and personal selling that covers the waterfront
It includes behavioural loyalty (repeat purchases), attitudinal attachment (love for the brand), sense of community (feeling of belonging), and active engagement (willingness to invest time, money, or other resources in the brand).
Example, The CBBE models of Coca-Cola and Pepsi
RESONANCE: Consumer involvement, community, attachment
JUDGEMENTS: Innovative, loyalty, leader, superiority
PERFORMANCE: Refreshment, unique flavour, reference of Colas, energy, tasty
FEELING: Sharing, happiness, unity, celebration, family/ friends, self-respect
IMAGERY: Happiness, moments, Christmas, social, fun
SALIENCE: Lovermark, everywhere, American values, fresh drink, sharing happiness, community
When comparing Coca-Cola and Pepsi using the CBBE model, we see distinct differences across each of the brand equity elements.
In terms of Brand Salience, Coca-Cola is a lovebrand icon, widely recognised for its long (American cultural) history, while Pepsi, though highly visible, is often seen as Coca-Cola’s challenger with a slightly younger, more contemporary and fun feel. In terms of Brand Performance, Coca-Cola is associated with its classic, consistent taste and timeless refreshment, while Pepsi is
marketed as sweeter, bolder, and more aligned with those seeking a lively, modern flavour.
Looking at Brand Imagery, Coca-Cola evokes feelings of nostalgia, happiness, and tradition, often linked to family moments and celebrations, such as its iconic holiday advertisements.
RESONANCE: Affiliation, loyalty, engaged community
JUDGEMENTS: High quality, competitive, satisfaction
FEELING: Adventure, exciting, social approval, sexy
PERFORMANCE: Sweeter taste, preferred in blind tests, less fizzy, refreshing
IMAGERY: Teens, young, urban, style, edgy, blue cool, joker
SALIENCE: Fun, community, fresh drink, awareness, main soda
Pepsi, on the other hand, has cultivated an image of youth, energy, and rebellion, frequently associating itself with music, pop culture, and trendsetters through celebrity endorsements like Beyoncé and Michael Jackson.
In terms of Brand Judgements, Coca-Cola is seen as the trusted, original cola brand, known for its consistency and long-standing quality. Pepsi is viewed as more dynamic, attracting consumers who appreciate boldness and a modern appeal. Finally, in Brand Resonance, Coca-Cola enjoys deep emotional connections, often tied to personal memories and significant life
Chapter 2: The “evolved” model: SAVE
∙ Catalogues & Internet: Sales through mail-order catalogues or online platforms (e-commerce) that connect consumers with various wine options, often through both retailers and producers.
The way they choose can change throughout the life of their business. They may start out wanting to use only a direct channel, but as they grow they may want to change their main distribution channel focus to indirect. Or it’s also possible to keep only the information part direct and to do the other parts indirectly by using intermediate parties or vice versa.
Let’s focus on some advantages and disadvantages of both Access types.
• Direct access channel
As mentioned above, this is a company that keeps a direct connection to their consumers through its communication and deal channels like direct mail of its own solutions, or its own e-commerce site. Having direct access to your customer helps keep costs down and can generally mean larger profits.
A software company that sells a digital product, like a CRM tool.
If the company uses a direct distribution model, they would sell the software directly to customers through their website. The business only needs to in-
vest in the website, hosting, and online payment systems.
There’s no physical shipping involved, and the product is delivered instantly via download or access keys. The company also has full control over the customer experience, including quality, updates, and support, ensuring that the software meets user expectations.
• Indirect access channel
Unlike the direct access channel, indirect channels are a little more complex and involve more third parties. That isn't necessarily a bad thing, but it does require a little more strategic planning.
Example: FMCG


A lot of fast-moving consumer goods (“FMCG”) companies use a multi-tier, indirect access channel. They sell their products and brands to distributors, who sell to retailers, who sell to consumers. Most manufacturers will use the indirect access channels to sell their products on the shelves of retailers
Chapter 2: The “evolved” model: SAVE
2.3.5.2 Model of Pine and Gilmore
Joseph Pine II and James Gilmore emphasised the strengths of experiences by developing a model, also known as the Experience Economy 45 This model proposes that businesses should focus on creating memorable experiences for their customers rather than just offering goods (or brands) and services.
THE FOUR REALMS OF AN EXPERIENCE
The model highlights four dimensions of an experience:
1. Entertainment: This realm involves passive absorption of experiences through the senses, such as watching a movie, attending a concert, or viewing a play. The customer is entertained and engaged through observation.
2. Education: In the educational realm, customers are more actively involved.
This can include participating in a workshop, attending a class, or engaging in a training session. The aim is to enrich the customer’s knowledge or skills, providing value through learning.
3. Escapism: This realm immerses the customer in an experience where they actively participate in a different reality. Examples include playing video games, engaging in virtual reality, or taking part in adventure tourism. Customers are deeply involved and often physically and emotionally engaged.
4. Esthetic: This realm involves passive immersion in an environment where the customer is deeply involved in appreciating the setting. Examples include visiting an art gallery, touring a beautifully designed garden, or staying at a luxury resort. The focus is on creating a pleasing, memorable environment that the customer can enjoy.
Example: Pine and Gilmore with some examples ...
In the Experience Economy, businesses engage customers through distinct experiences that go beyond just products or services. Pine and Gilmore identify four key types of experiences:
a. Entertainment:

Watching a Netflix series at home is a perfect example. It’s an immersive experience where viewers are entertained and emotionally engaged without
Chapter 2: The “evolved” model: SAVE
are a lot of alternatives on the market for a customer, but if you’re in the desert and you’re thirsty, you might give everything you own to get that bottle. The “Solution” is not the same in different contexts.
Situation B: playing on the “demand” side
That same bottle of water can be provided in standard PET or in recycled PET packagings. The second proposal will be “valued” as higher as it’s tapping into the need for “safety and security” on the Maslow pyramid (like all “more sustainable” solutions) and may have a higher price.
2.4.1.2 Element 2 of Value: Access
As described in the section above, the “Access” concept contains all organised activities to provide a smooth and convenient flow to customers in getting a deal and the use of it. We distinguish 3 important Access objectives:
a. Providing information
b. Closing the deal
c. Sustaining the relationship (service, ...)
As described in the introduction of this section, human beings are “lazy” and want to use their brains as little as possible by going for the System 1 “fast thinking” method. Any possible barrier might force humans to opt for System 2 and this takes mental energy, which is not optimal. As a marketer, you will therefore make your activities as “accessible” as possible by making it very “easy” or “convenient” for your customer to pass all steps. This means:
a. Providing the right information at any space or moment
b. Making the deal easily accessible and adapted to their personal needs
c. Ensuring the necessary service elements when the customer has chosen you.
The “easier” the customer goes from steps 1 to 2 to 3, the higher the “Value” they will provide to your proposal. Depending on the market context you can monetise this higher value by asking a higher price for your offer.
Example: Printer companies... HP Instant Ink

Many printer companies, such as HP Instant Ink, now offer subscription-based models that simplify the printing process and deliver greater convenience to customers.
1. Providing the right information
When customers visit the website, they immediately see clear information about subscription plans, such as the benefits of automatic ink delivery and potential savings. Customers can also use a print volume estimator to choose the right plan based on their monthly printing needs, and view videos or FAQs that explain how the service works. This ensures they have all the information they need to make an informed decision without any confusion.
2. Personalised, convenient offers
Once the customer decides to purchase, they can select from a variety of subscription plans tailored to different printing volumes, such as 100, 300, or 500 pages per month. Pricing is transparent, with options to pay monthly or save by committing to longer terms. New customers might also receive an introductory discount or free trial, lowering the barrier to entry and increasing the chances of conversion.
3. Effortless ongoing service
After subscribing, the ink is automatically delivered when the printer sig-
Chapter 2: The “evolved” model: SAVE
consumer to see your brand initially. What kind of experience do you want to provide? What valuable content can you offer to encourage them to think about your brand’s offerings?
THINK
Those people who meet your target audience criteria, but may not be in the buying phase right now.
These people know what they are looking for and have a greater intent to buy.
These people know what they are looking for and have a greater intent to buy.
Figure 1.57: STDC – model 66
This group is made up of your existing customers, who have made at least two commercial conversations.
THINK: In the Think stage, the LAQA has mild commercial intent. They are thinking about your brand’s offerings. Your task is to provide content that matches their intent and interest level. Think about what will move them from considering your brand to taking action. What bridges the gap between thinking and doing?
DO: At this point, the LAQA is ready to transact. They are willing to purchase from you. When they take a “Do” action, what experience can you provide that will truly impress them? Optimise the See and Think stages to maximise the Do stage.
CARE: The Care stage involves repeat customers who have an affinity for your brand. It’s about nurturing and deepening the relationship. How can you continue to engage and delight these loyal customers? Remember, caring for existing customers is just as important as acquiring new ones.
In summary, the STDC model guides marketers to tailor their content and strategies for each consideration stage, ensuring effective communication with their target audience. By understanding these intent clusters, you can build stronger relationships and drive better results.
2. RACE model
Digital companies are adept at gathering vast amounts of data to track and understand the decision journeys of their customers. From this perspective, Dr Dave Chaffey created the RACE framework in order to highlight which digital marketing activities you need to focus on to improve results from digital marketing. The RACE Framework consists of these four steps or online marketing activities designed to help brands engage their customers throughout the customer lifecycle: Reach ⟶ Act ⟶ Convert ⟶ Engage.
QUALITY VALUE
Chapter 3: Customer (Decision) Journey
Chapter 4: SAVE & CDJ... the “perfect” marriage
We’ve tackled 2 key models for marketeers: the SAVE model helps us to define the actions to frame your marketing plan and the Customer Decision Journey explains the results of your marketing activities on desired consumer behaviour. But how can both models come together:
• Should we start with Solution or Access or Education?
• In which stages should we focus on Solution, Access, or Education?
• And what about Value?
In other words, where do we implement the different SAVE parts related to the different CDJ phases and what is the reason that this would lead to the “perfect” marketing marriage?
4.1 General recommendations
As mentioned above, the customer decision journey can be described as a serial, multiple-step approach, all linked to each other. Depending on different factors like knowledge, emotions, or other personal elements, customers will proceed slower or faster throughout this process. Within each step, this “linearity” will be less relevant and will be more difficult to manage as a marketer. In the coming paragraphs, we’re going to describe how to optimise each phase by focusing on the right SAVE – tools.
4.1.1 First phase: “awareness” through “Solution” & “Education”
To start any kind of journey, potential customers need a certain trigger to proceed. Mostly, they will experience a certain type of “awareness” of an existing or latent need. This might be both consciously or unconsciously. Without any form of consideration, customers will not start spending time or energy in evaluating possible provided opportunities.
This “need” can easily be triggered by focusing on the “Solution” part of your marketing strategy. As described above, all efforts that marketers put into practice to explain possible “problems” or “challenges” and the way to solve them all aim to create “awareness” for a certain need amongst prospective customers.
Besides the “Solution” activities, which target the “needs” more, it’s important to combine these with the correct “Education” strategies. In particular, we are referring to the 3H model, where the HERO content is the optimal choice to grow “awareness” around your “Solution”.


When Apple launched their headset Vision Pro, they did it by explaining and demonstrating all the possible features with their newest innovation. They made up movies, articles, and other press material to express their “Solution” to the public.
Chapter 4: SAVE & CDJ... the “perfect” marriage
used across various industries as a simple yet powerful tool to assess customer sentiment.
How it works:
Customers are typically asked a single question: "On a scale of 0 to 10, how likely are you to recommend our product/service to a friend or colleague?" Based on their response, customers are categorised into three groups:
1. Promoters (score 9-10): These are highly satisfied customers who are likely to recommend the product or service to others.
2. Passives (score 7-8): These customers are satisfied but not enthusiastic. They are less likely to actively promote your product or service.
3. Detractors (score 0-6): These customers are dissatisfied and may even spread negative feedback about your product or service.
The NPS is calculated by subtracting the percentage of Detractors from the percentage of Promoters. Passives are not included in the calculation. The resulting score can range from -100 to +100. Having a positive score means that your solution has more promoters than detractors, so most of your customers are satisfied and will likely recommend you. The negative score means the opposite and reflects a less positive situation.
NPS not only provides a numerical value but also helps in identifying areas for improvement. Companies can analyse feedback from promoters and detractors to understand what they are doing well and what needs to be improved. Promoters can be encouraged to advocate for the brand, while detractors can be engaged to address their concerns and potentially turn them into promoters.
Very important remark:
As the NPS calculation is very “category” driven (certain markets are more customer focused than others), you need to evaluate these scores within the same category.
Example: Net Promoter Scores of some tech companies
In general, technology-driven solutions like Apple or Google will have a higher NPS as consumers will value these more highly than more standard solutions.
It’s important to conduct these different types of surveys repeatedly over time, so you can distinguish a certain evolution in “trust” around your solution. Doing it only once will be a waste of time and money.
Chapter 4: SAVE & CDJ... the “perfect” marriage
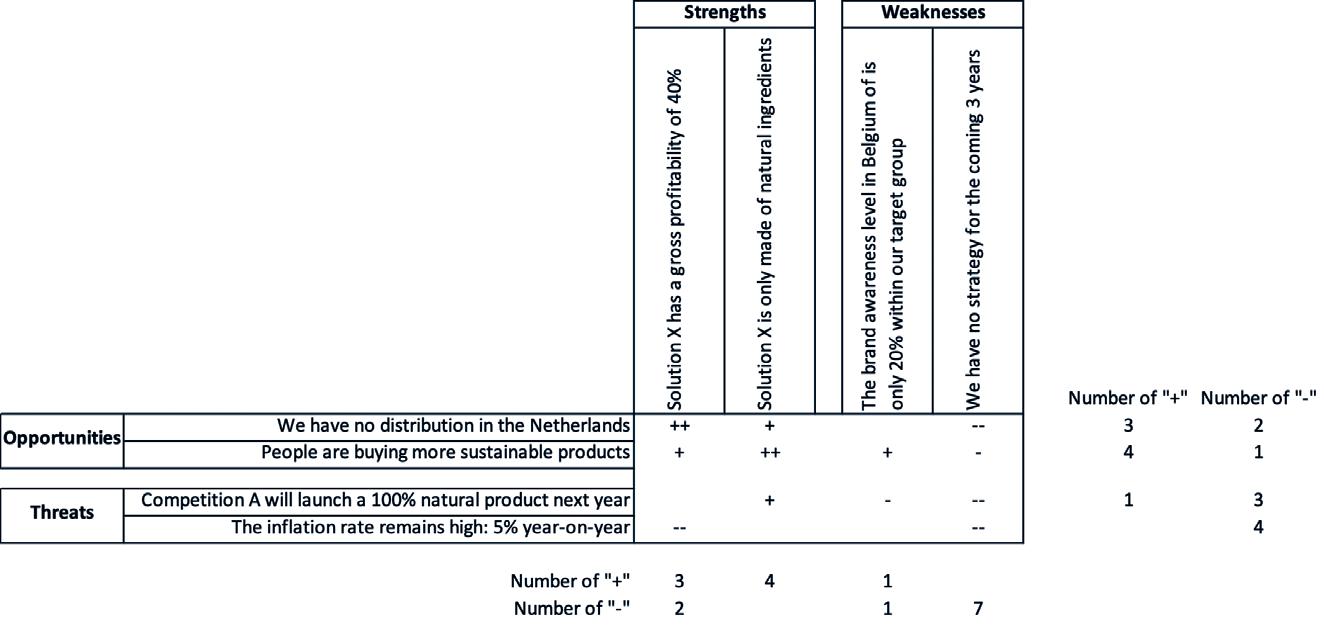
As presented in the chart above, the process will proceed through several steps:
a. Step 1: Strategic overview
b. Step 2: External analysis (which will lead to “Opportunities” and “Threats”)
c. Step 3: Internal analysis (which will lead to "Strengths” and “Weaknesses”)
d. Step 4: SWOT matrix
e. Step 5: Going from strategy to operational marketing (Strategic options)
This process is mostly evaluated on a yearly base to make sure that the strategic goals are still applicable. It all depends on the market you’re operating in. We will describe each step in the following sections.