
2 October 2025 | Berlin, Germany

2 October 2025 | Berlin, Germany
Peter Gal
Deputy Head of Division and Senior Economist
OECD Economics Department

Based on joint work with Francesco Filippucci, Katharina Laengle, Matthias Schief, and building on the latest OECD Economic Survey of Germany and forthcoming work by OECD Science, Technology and Innovation
Labour productivity growth Annualised growth, percentage points 0 0,5 1 1,5 2 2,5 3 3,5
• Notes: labour productivity of the total economy. Source: OECD ADB. Advanced economies include Australia, Canada, Germany, France, UK, Italy, Japan, Korea and the US, and emerging-market economies include Brazil, Indonesia, Turkey and South Africa. Emerging-market economies include Argentina, Brazil, Bulgaria, Chile, Colombia, Costa Rica, India, Indonesia, Mexico Romania, Russia, Saudi Arabia, South Africa and Türkiye, while all other OECD economies are covered in the ADV average.
Productivity growth across the OECD has been disappointing… Can AI turn this around?
• Seems very promising…
• Large documented gains in specific activities (coding, translation, writing, etc.)
• But these are only a fraction of all economic activities…
• Typically cognitive, knowledge intensive jobs
• AI adoption is still limited…
• According to official surveys by statistical agencies, which ask about core business functions and regular use
• Aggregate productivity gains also depend on demand through general equilibrium effects
• Is there demand for the increased output of AI-boosted sectors, e.g. legal services?


Predicted impact of AI on aggregate labour productivity growth
Annualised gains over the next 10 years (pp.)
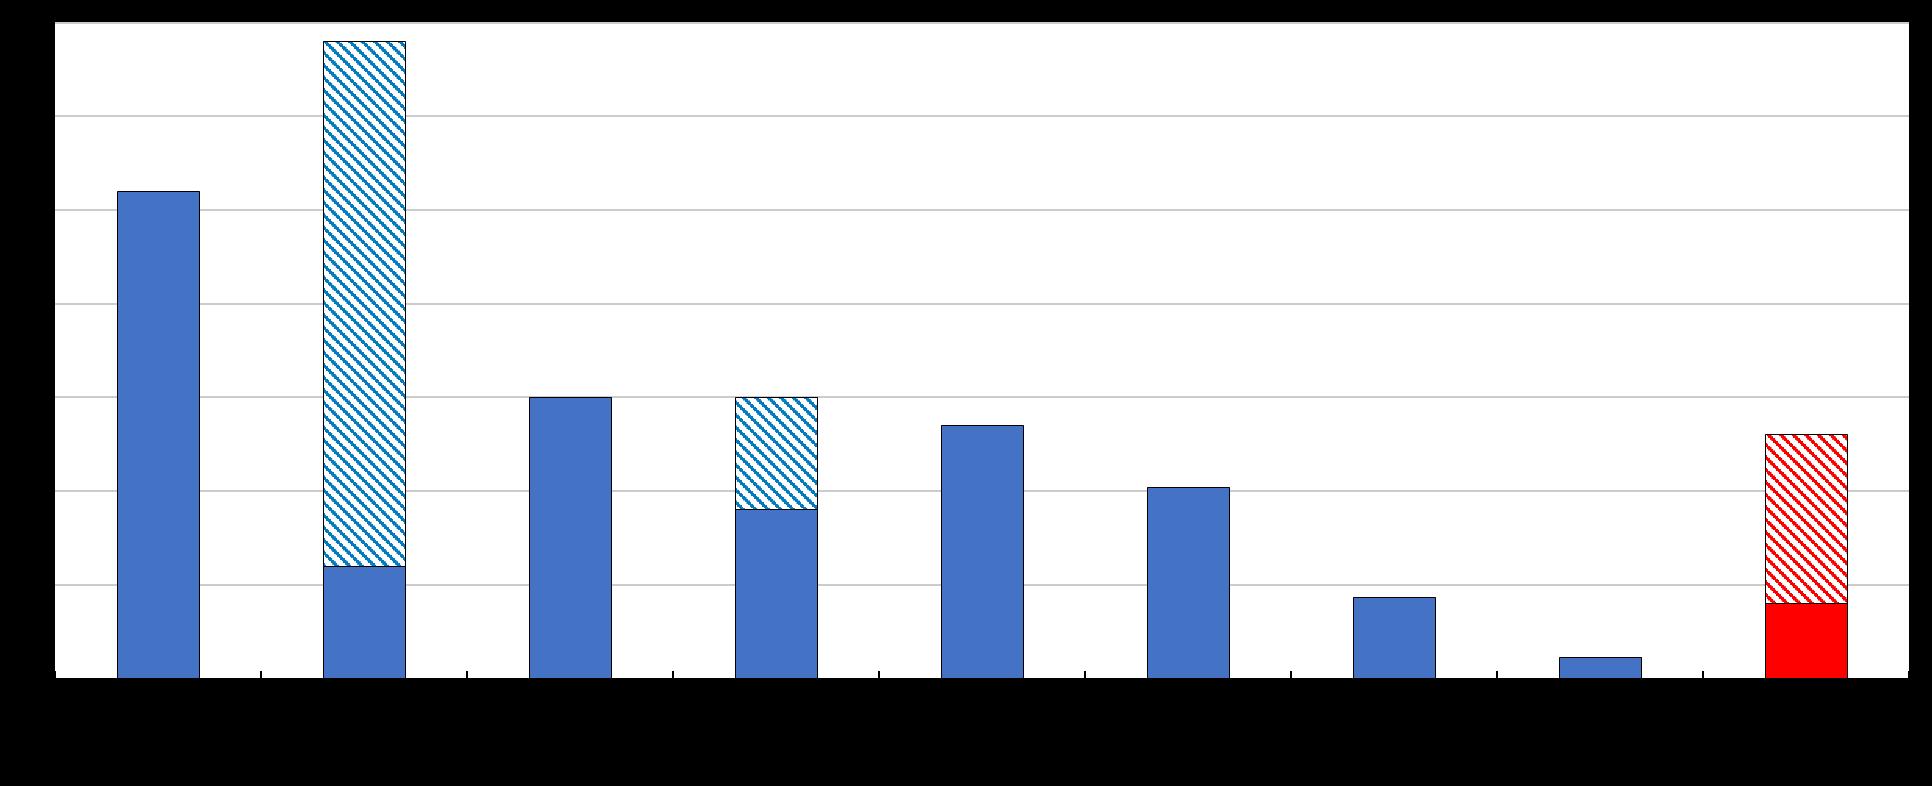
Gains associated with ICT boom in the US in the 90s
Source: Filippucci, Gal and Schief (2024) and Filippucci, Gal, Laengle and Schief (forthcoming)
Performance gains on specific tasks
Estimated % increase in productivity and 95% standard errors, as reported by various studies
2023)
30%: our baseline assumption (average of 4 most precise estimates)
2022)
2023)
Note: The graph shows the worker-level productivity effects reported in different studies together with 95% confidence intervals.
Source: Compilation from the literature by Filippucci et al. (2024).
Share of tasks exposed to AI by sector Average over G7 economies
GDP-share of the most AI-exposed sectors (knowledge intensive services)
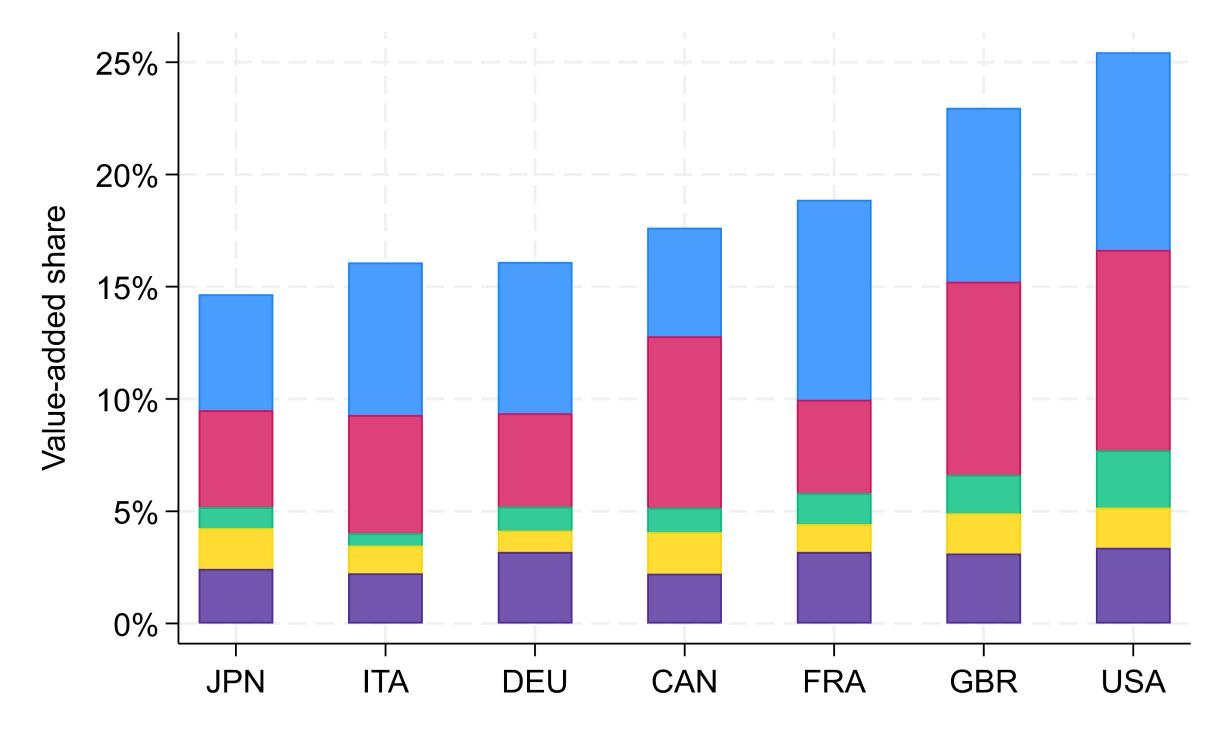

Source: Eloundou et al. (2024, Science) aggregated from tasks and occupations to sectors (left panel).
Sectoral value-added data come from OECD Input-Output tables, 2019 (right panel)
We benchmark our scenarios to the adoption paths of previous General Purpose Technologies (
Mobiles phones (+60 pp.)
Internet & PCs (+40 pp.)
passed since the introduction of user-friendly breakthrough
Sources: For computers and internet: US Census; for electricity adoption of businesses: Woolf (1987) and Our World in Data; for mobile phone use of individuals: International Telecommunication Union; for AI: United States Census Bureau, Business Trends and Outlook Survey (BTOS). Electricity (+23 pp.)
Historical costs of computation vs. cost of AI Index, first year of data =100
Historical costs of computer memory vs. cost of AI Index, first year of data=100
Cost of computer memory (USD/Tb, range across diff. types)
Cost of accessing GenAI models (quality adjusted price)
Sources: Cost of computation: Kurzweil (2024); Cost of computer memory: McCallum (2023).
Cost of accessing GenAI models : Andre, Betin, Gal, Peltier (May 2025).
Current and future adoption (in 10 years)
Based on the S-shaped adoption paths seen in previous GPTs
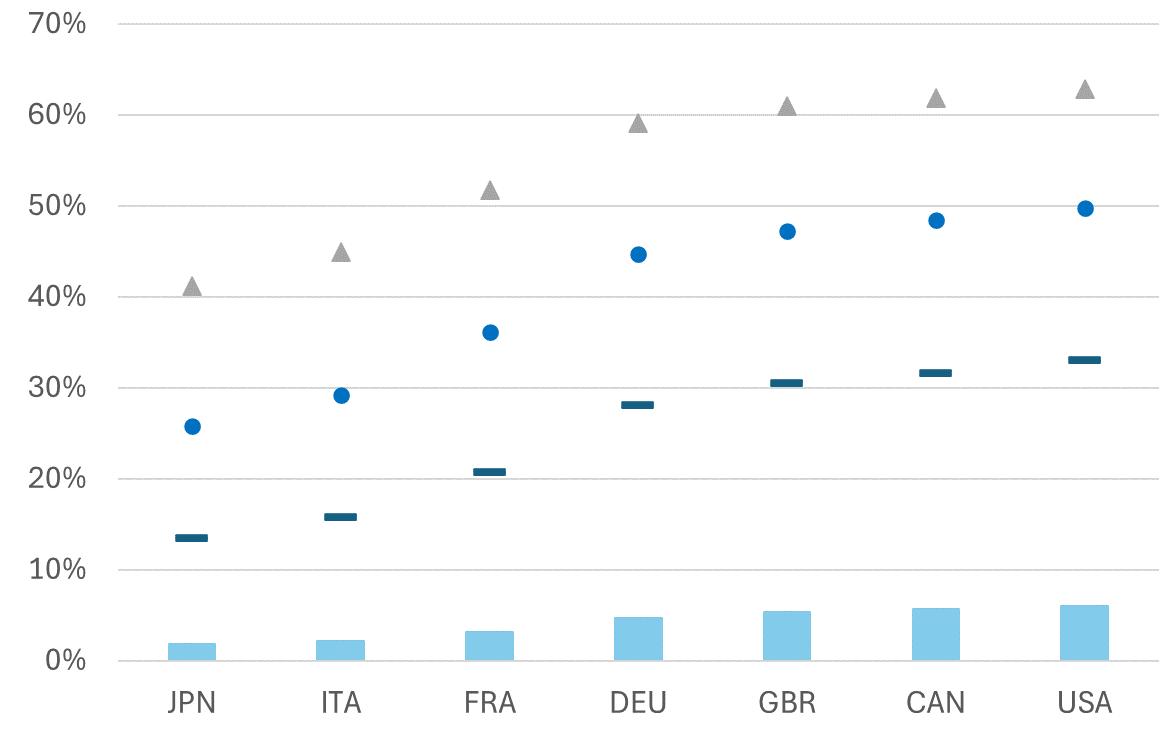


Note: current adoption rates are taken from official national statistics after harmonisation steps (CAN, EU, USA) or when this is not possible, using predictions as a function of the digital infrastructure, skills and the sectoral composition (JPN, GBR).
New OECD evidence, joint with the EU Commission OECD (forthcoming), Monitoring the implementation of the EU Coordinated Plan on AI: Uptake in Key Priority Sectors:
• AI adoption in EU manufacturing: modest but rising
• 2021: 7% ➔ 2024: 11%
• With large variation across industries, countries and firm size
• Type of tasks affected
• Language-related and administrative tasks
• Integration into core production processes is still limited
• Key barriers:
• Data fragmentation,
• Insufficient infrastructure, high upfront costs,
• Regulatory complexity,
• Shortages of AI-skilled professionals
Predicted labour productivity growth due to AI over the next 10 years (percentage points, annualised)
Goldman Sachs (2023, USA) Aghion and Bunel (2024, USA) Acemoglu (2024, USA)

High adoption and expanded AI capabilities
Medium adoption and expanded AI capabilities
1. Macroeconomic gains are led by speed of adoption & sector specialisation
→ Investing in skills & building trust in adoption
→ Fostering secure and interoperable data sharing (also sub-nationally)
→ Enabling digital infrastructure and ecosystems,
→ Clearer regulatory guidance
→ Foster business dynamism (lowering regulatory barriers and help with startup financing)
2. International accessibility of leading AI models
→ International trade in digital services
→ Lively competition among AI developers
→ Local capacity in AI development has likely spillovers on AI use…
Note: also building on the OECD’s latest Economic Survey of Germany as well as a forthcoming OECD review, joint with the EU Commission, on AI in manufacturing
Improving digital infrastructure across regions would support greater adoption of digital technologies
Average download speed for fixed network in the regions, Mbps, first quarter of 2023
The
Thank