Utah Resource and Infrastructure Housing Capacity Analysis
Executive Summary
Utah will need more than 840,000 new homes over the next 30 years, but without addressing the factors that constrain our housing market, we will come up nearly 235,000 homes short—a shortage that will increase prices and impact quality of life for new and long-time residents alike.
Over the last year, Envision Utah has worked under the direction of the Governor’s Office of Economic Opportunity to analyze Utah’s housing capacity. Envision Utah partnered with RCLCO Real Estate Consultants and worked with representatives from local and state government, developers, and other stakeholders, alongside experts in water, sewer, and transportation. The result is a deeper understanding of Utah’s housing capacity and the constraints to new housing than the state has ever had.
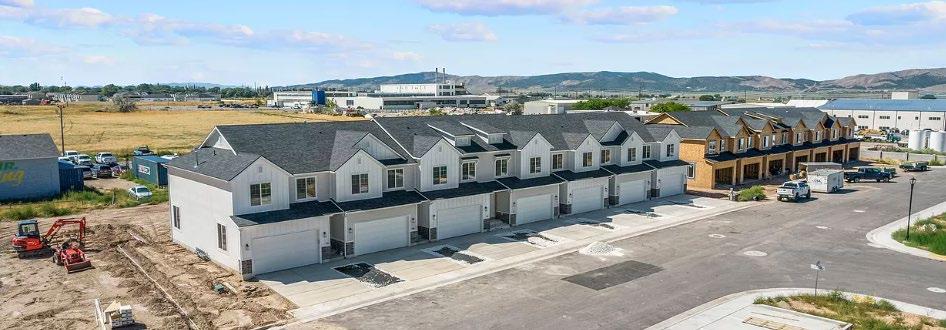
Our analysis primarily considered three markets where housing can be built: (1) within existing cities and towns, known as infill markets, (2) on previously vacant or agricultural land, called greenfield markets, or (3) near public transportation infrastructure, also known as transit-adjacent markets.
In infill markets, new housing is limited primarily by planning and zoning and by our readiness to redevelop underutilized, underperforming, or outdated sites and parcels into housing. We are likely to use up all the land that is available for housing in infill markets before 2055. But even then, infill markets could fall short of meeting market demand.
Housing in greenfield markets will likely make up at least half of new homes by 2055. But housing in greenfield markets is constrained in several important ways.
• Planned transportation infrastructure may struggle to connect people to existing job centers and amenities as growth expands further into greenfield areas.
• Water availability may begin to limit housing growth in some regions without additional conservation measures as competition for water increases.
• Planned sewer treatment capacity is insufficient to meet rapid housing growth in some areas.
• Planned housing capacity in greenfield areas is lower than market demand.
Opportunities to build new housing in transit-adjacent markets are limited by the availability of developmentready transit-adjacent land. Housing demand in transitadjacent markets exceeds the amount of land likely to become available for redevelopment in areas near stations with rapid access to urban job centers. In transitadjacent markets outside of more urbanized areas, the biggest challenge will be aligning the timing and design of transit-adjacent growth in ways that will maximize the benefits of public transportation investments.
Combined, these barriers threaten Utah’s ability to build enough housing to support families and sustain future prosperity. Fortunately, these constraints are not absolute - we can use water and land more efficiently, invest in needed infrastructure, and align policies with market needs to secure a future where Utahns have opportunities to live, work, and play in quality communities.
If not addressed, barriers to housing creation could result in a housing shortage of 235,000 units–196,000 units in the Wasatch Front–by 2055, representing a quarter of future housing needs.
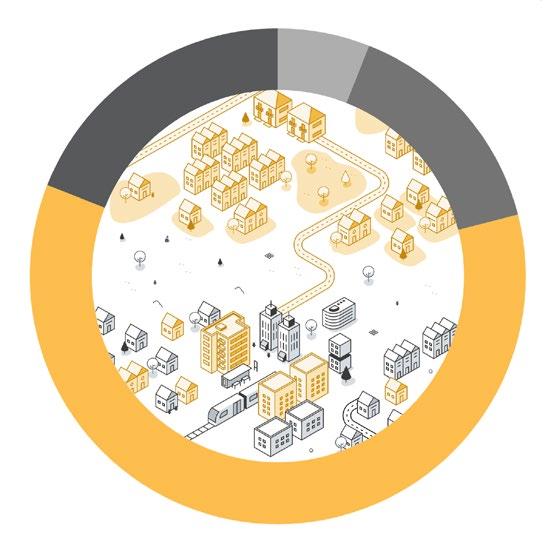
Market Type
Greenfield 50% (318,000)
Infill 30% (191,000)
Transit-Adjacent (Infill) 20% (127,000)
Transit-Adjacent (Greenfield)
Water Applies to all market types
• Infrastructure
Water
Planning and zoning
• Planning and zoning
• Redevelopment potential
• Redevelopment potential
• Transit Stations
• Market timing
• Water supply
• Treatment and distribution
*For decades, Envision Utah and other partners have brought Utahns together to explore growth choices and create a vision for the future. From all this and more, we know that Utahns desire a variety of housing options in greenfield, infill, and tran sitadjacent markets. The target distribution shown here is approximately aligned with these visions.
Introduction
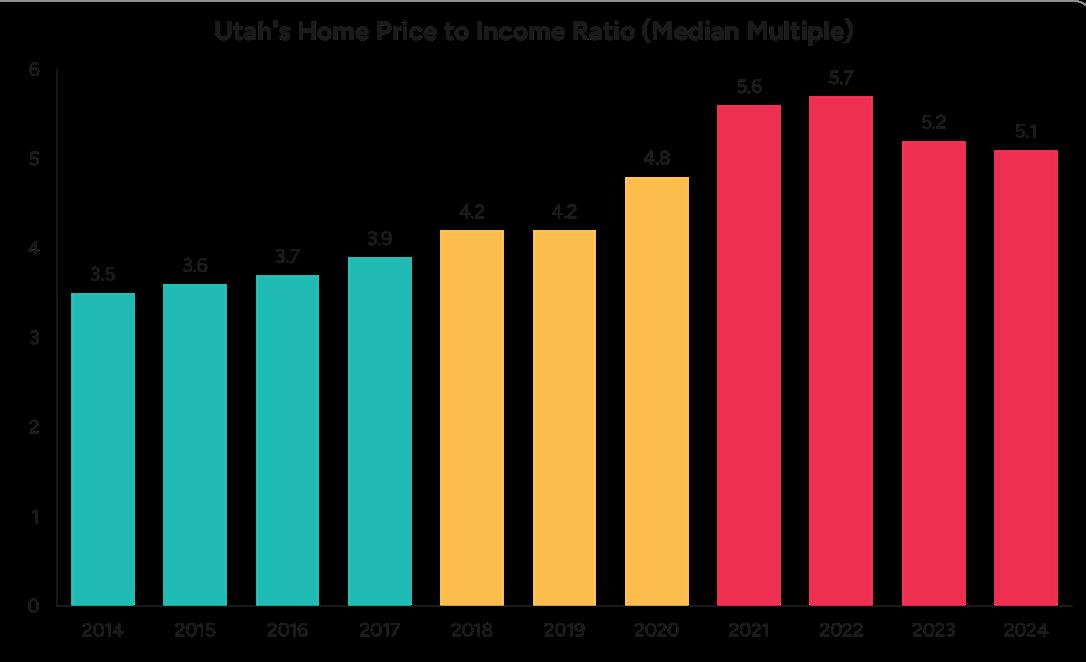
Utah faces an inflection point as housing affordability reaches unprecedented levels. Strong demand—from both internal sources and in-migration—is running into substantial supply constraints, eroding the affordability and resulting peace of mind Utahns have long enjoyed. In 2024, Utah was the country’s ninth most expensive housing market and the median sales price of a home was more than four times median household incomes in the state’s most populous counties.1 While prices stabilized somewhat in 2023 and 2024, rising interest rates translated to an increase in monthly payments for new mortgages from $3,648 in 2022 to $4,044 in May 2024.2 As of May 2024, an annual income exceeding $160,000 was needed to finance a median priced home.
Source: U.S. Census Bureau, American Community Survey and UtahRealEstate.com
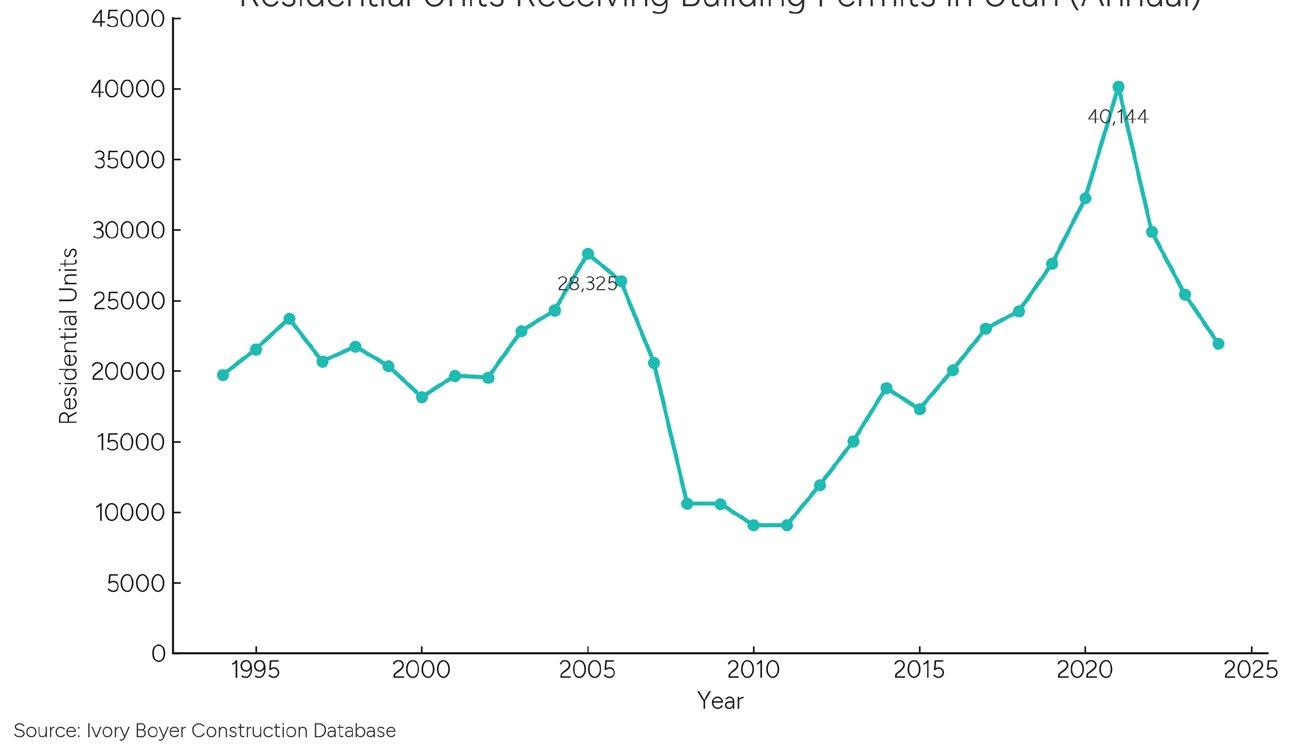
The dramatic rise of home prices is attributed primarily to a supply shortage that peaked at 56,800 units in 2017. A recent drop in permitting and building suggests that understanding the factors constraining housing development in the state remains key to meeting Utahns’ vision for housing that is abundant and attainable.
Residential Units Receiving Building Permits in Utah (Annual)
Background
House Bill 2 in 2024 authorized the Governor’s Office of Economic Opportunity (GOEO) to analyze housing capacity by evaluating land availability, infrastructure constraints, and market projections across Utah. Envision Utah and RCLCO Real Estate Consultants were selected to complete the analysis.
This Housing Capacity Analysis clarifies future housing needs in high-growth markets by estimating future housing demand based on demographic and market forces. It also estimates regional capacity for new housing based on land and water availability, transportation and wastewater planning, and local land use regulations, and assesses the alignment of these variables with regional housing needs.
Disclaimers and Use
This analysis takes a comprehensive look at the interplay between housing demand, resource availability, and local land use planning at the regional market level. Users should defer to more detailed local analyses and plans for more granular, constraint-specific data. Additional community infrastructure such as power, gas, and educational facilities were not considered, nor were factors such as material, labor, and financing costs. Similarly, this analysis is focused on the alignment between housing demand and supply, although some considerations of public preferences and community visions are included. Any information provided here must
also be considered within the context of other priorities and needs.
Any housing distribution forecasts produced through this analysis are meant to identify the directional impacts of constraints not fully considered by traditional socioeconomic forecasting. While they may be used to inform future forecasting and serve as informational caveats to other projections, none of the projections shown here are intended to serve as definitive forecasts of future housing or demographic patterns.
Local and regional governments and the state of Utah may find this report useful as they consider what investments, policies, and programs are most likely to overcome key housing supply constraints in different market types and regions. The report may also have implications for homebuilders and developers. Ultimately, this information, combined with local knowledge and priorities, may be used to enhance Utah’s ability to ensure a sufficient supply of housing for the next generation of Utahns.
Approach
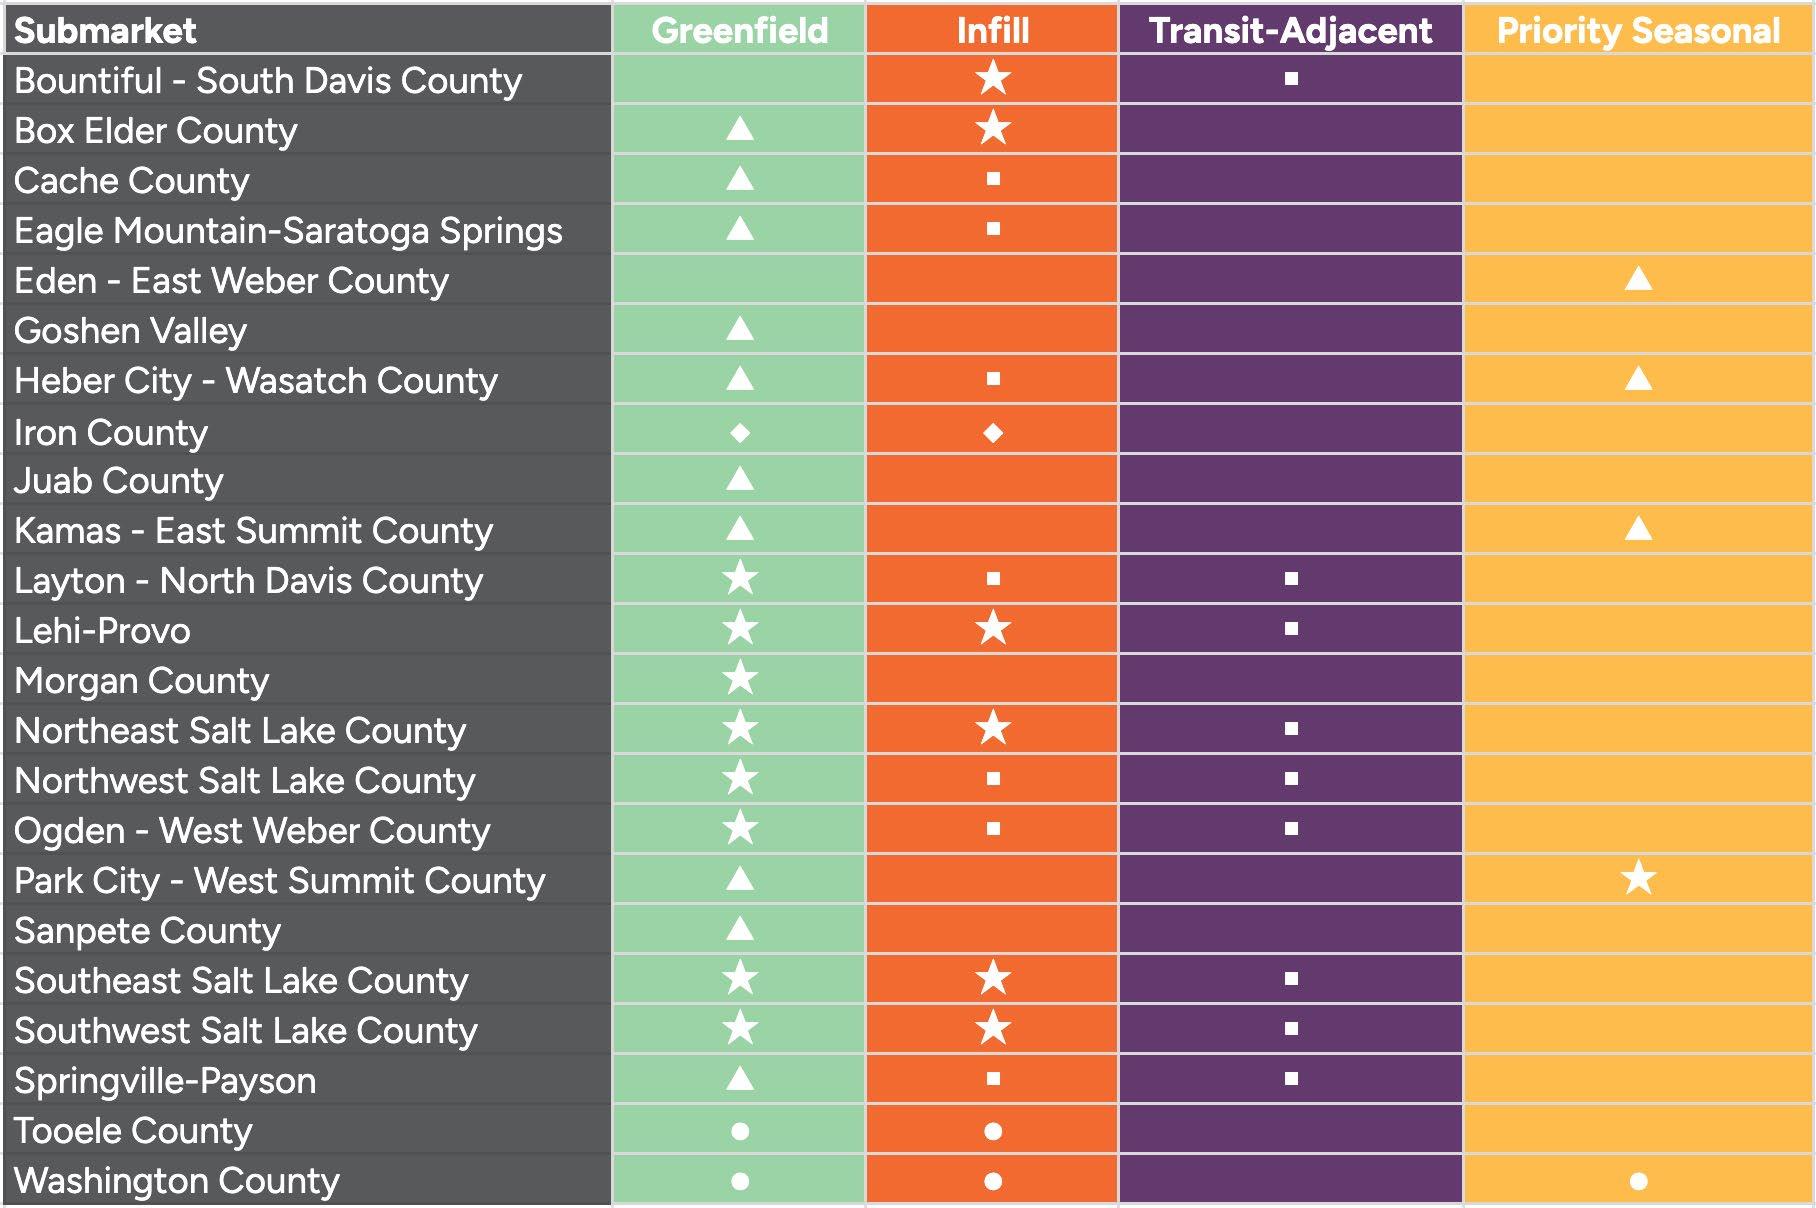
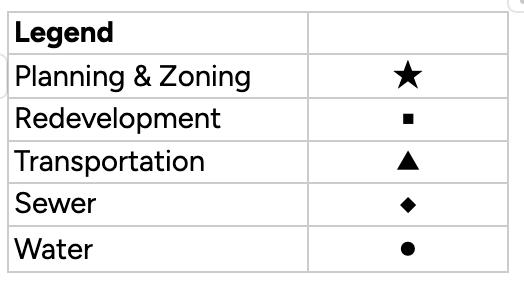
RCLCO developed a structural demand model to translate demographic and market trends into an estimate of residential demand per decade by market and product type through 2055.3 Envision Utah also estimated the land area available for future development across 23 submarkets based on physical and administrative characteristics, current land use, and current market values.4 Available land within each submarket was classified as 1. Transit-Adjacent, 2. Infill, 3. Greenfield, 4. Priority Seasonal, 5. Excluded Seasonal, or 6. Industrial.
Next, RCLCO developed a distribution model to allocate structural demand to the submarkets based on desirability and land availability, using different assumptions for each market type. Total housing capacity estimates based on land availability, land use plans, transportation plans, sewer treatment plans, and water supply were then compared to market demand to identify which constraints are most critical by region and market type. Experts throughout the state were invited to help refine the analysis, interpret the results, and suggest recommendations. The stakeholder committee and technical committee for the project, as well as members of the Envision Utah Board of Governors provided valuable insights that shaped the analysis and findings.
Land area within 0.5 miles of passenger rail stations or 0.25 miles from Bus Rapid Transit stations (current and planned + funded stations only).
land Infill Census tracts dominated by current residential or other urban land uses.
Greenfield
Constraints to Utah’s Housing Supply
This analysis confirms that resource, infrastructure, and regulatory constraints strain Utah’s capacity to build a sufficient supply of housing in a way that aligns with public priorities over the next three decades and beyond. In fact, without proactive efforts to address barriers to new housing, the state could face an additional shortage of up to 235,000 units (more than a quarter of future demand) by 2055.
Of the thousands of Utahns who participated in the Guiding Our Growth statewide conversation about Utah’s future, the vast majority would like to see new housing in currently undeveloped areas, near transit stations and town centers, and in appropriate areas within existing neighborhoods. Other public visions including Your Utah, Your Future and the Wasatch Choice Vision have provided similar direction. This analysis finds that each of these market types (hereto referred to as greenfield, transit-adjacent, and infill) faces unique barriers to building enough housing
Source:
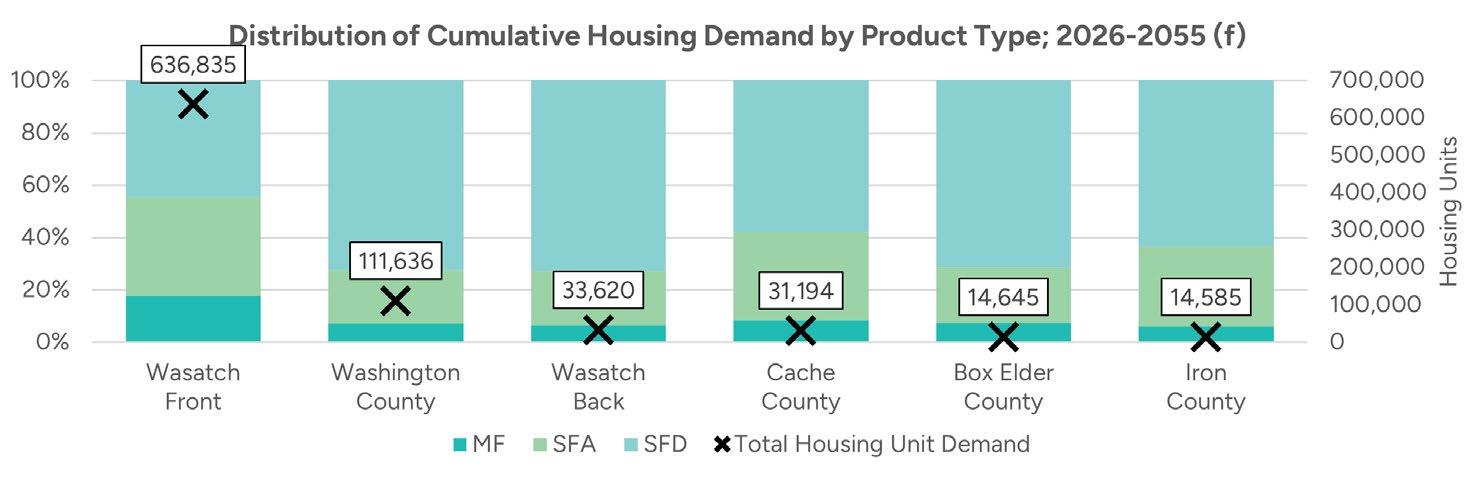
Utah’s strong economic growth continues to drive robust housing demand, which in turn sustains the economy. The state’s fastest growing regions (those included in the study area) are expected to need more than 840,000 new units by 2055. While household sizes are declining, the share of Utahns that are 25 years old or older is expected to increase from approximately 60 percent to 70 percent, driving ownership demand for single family attached and single family detached homes at a variety of price points. 8Multifamily demand accounts for fifteen percent of new units statewide and is especially strong near existing job centers and amenities.
The Wasatch Front accounts for three quarters of future housing demand and commands higher prices and densities than other parts of the state, reflecting its role as the state’s primary economic engine. Washington County has the second highest demand for total units, while Cache County emerges as a secondary market for
Housing Demand
The Most Significant Constraints For Each Market Type
Market Type
Greenfield
Infill
Transit-Adjacent (Infill)
Transit-Adjacent (Greenfield)
Water Applies to all market types
Primary Regional Constraints Policy Levers
• Infrastructure
• Water
• Planning and zoning
• Planning and zoning
• Redevelopment
• Redevelopment
• Transit stations
• Demand timing
• Water availability
• Treatment and distribution
• Flexible, scalable infrastructure financing
• Strategic transportation investments
• Market-aligned planning and zoning
• Water-efficient growth
• Market-aligned planning and zoning
• Redevelopment readiness
• Redevelopment readiness
• Targeted transit planning
• Targeted transit planning
• Flexible development approaches
• Water-efficient landscaping
• Irrigated area per unit
• Water-informed planning
Housing Demand Distribution
If housing capacity is insufficient to meet demand in one market type, it can increase demand for housing in other market types while simultaneously limiting opportunities for Utahns to live in their preferred neighborhood type. For example, if current land use policies significantly restrict new housing supply in infill markets, that demand may shift towards greenfield markets, increasing burdens on new infrastructure and increasing travel times and congestion, potentially costing millions or even billions in additional infrastructure spending.
Similarly, resource and infrastructure constraints are interrelated. For example, sewer systems need a reliable water supply to operate, land comes with water rights in some areas but not others, and the desirability of otherwise valuable land may be limited by existing or planned transportation capacity.
higher-price primary homes. Seasonal homeownership is not reflected in primary housing demand. Growth rates are significant in all study markets. Overall, the demand outputs point to a future in which Utah will need to continue delivering large quantities of diverse housing to accommodate the state’s growth trajectory.
National Context
Nationally, rates of new housing construction have slowed sharply over the past 50 years, most notably in the once-high-growth Sunbelt markets. The provocatively titled working paper “America’s Housing Supply Problem: the Closing of the Suburban Frontier?”
finds that new home construction is becoming less responsive to prices, particularly in more expensive, lower density census tracts.9 The authors also note that the negative correlation between building and density has also attenuated over the past two decades. If the regional markets included in the study reflect similar constraints to those present in Utah, local housing production may continue to struggle, particularly in high-price suburbs, and higher-density areas may host an increasingly important share of new housing. Indeed, multifamily housing has accounted for 30 percent of new housing units in Utah since 2010.10
Infill
As the availability of greenfield land near economic centers becomes more scarce over time, infill housing becomes increasingly important to sustaining economic growth and providing Utahns with options that meet their housing and transportation needs. Modeled housing demand is sufficient to develop all available land in statewide infill markets by 2055. Land use regulations and redevelopment potential are likely to limit infill housing growth unless strategies to align planning and zoning with demand, and to improve redevelopment readiness, are employed.
Infill housing is becoming an increasingly important source of housing growth in high-cost regions. Infill areas accounted for more than half of new multifamily units and roughly a third of total new units in Salt Lake, Davis, and Weber Counties in recent decades.12 Regional visions—including the Wasatch Choice Vision—and regional transportation plans place increasing emphasis on infill housing over the next three decades to meet transportation and quality of life goals.
If infill housing constraints are not addressed, supply may fall short of demand by as many as 48,500 units (25% of vision-aligned housing targets) in infill markets in the Wasatch Front.13 Infill housing is anticipated to play a smaller role in future growth in northern and southern Utah housing markets, but increasing infill capacity can still help to meet future housing needs in a resource and infrastructure-efficient manner
Primary Constraints
Planning and Zoning
Timeline - ongoing
• Planned densities in many infill markets are 20 to 40 percent lower than market demand.
Redevelopment Potential
Timeline - ongoing
• The distribution model fills all eligible vacant and redevelopment land in infill markets, based on current market values and estimated redevelopment rates.
• Redevelopment potential is determined by the interaction of zoning regulations, infrastructure capacity, market demand, and land economics. Redevelopment potential may increase over time based on changes in these forces.
Secondary Constraints
Infrastructure
Timeline - ongoing
• Infrastructure capacity needs in infill markets are site-specific, although regional improvements may be needed for areas expected to experience high levels of development, particularly in mixed-use centers.
• In some neighborhoods, declining populations within the existing housing stock may translate to surplus transportation, water, and sewer capacity for generalized infill development. This trend is exemplified in recent elementary school closures in Salt Lake School District and Granite School District, contrasted by rapidly growing suburbs struggling to keep up with the number of new students.
Policy Levers
Market-aligned planning and zoning
Demand for multifamily and attached housing is high in infill markets near job centers. Expanding opportunities to build housing in these areas helps to reduce travel times and prevents demand “spillover” into greenfield markets, which have their own constraints.
• Nearly all infill demand in Salt Lake County is for multifamily and attached products. Multifamily and attached housing demand represents at least half of residential demand in infill markets in most other counties.
• Infill demand for single family attached housing (sometimes called missing middle housing) is particularly robust, supporting the establishment of density stepdown buffers surrounding existing and planned mixed-use centers.
• Market net densities for infill single family attached housing are greater than 11 units per acre statewide. Market-based multifamily net density in infill markets is roughly 30 units per acre, on average. Planning and zoning that exceeds these densities are needed to enable these averages.
• Allowing housing in areas previously zoned for commercial or other uses can expand the amount of land available for infill housing.
• Adjustments to parking requirements may also facilitate infill housing.
• Overlay zones and form based codes may also be used to encourage context-sensitive infill housing.
Redevelopment readiness
Redevelopment has the potential to accommodate a significant share of housing demand and may help stabilize populations in established neighborhoods amid shrinking household sizes and an aging population. Concerns regarding community character and displacement sometimes complicate market-aligned redevelopment efforts, although thoughtful processes and design can help to mitigate these concerns.
• Underutilized sites such as parking lots or underperforming retail centers present opportunities
to add housing and generate new municipal revenues. Unlocking this potential would expand the supply of land available for redevelopment. Housing redevelopment, especially along aging commercial corridors, is already becoming more common in some regions.
• Financial incentives like grants, tax advantages, and revolving funds could be used to help bridge financing gaps for more affordable housing types and infrastructure in infill markets.
• Proactively aggregating land and preparing water, sewer, and transportation infrastructure in areas with significant redevelopment potential can help target areas to prepare for market-aligned redevelopment.
• Higher density infill housing is more resourceand-infrastructure-efficient than lower density housing types (i.e. they use less land/water/ infrastructure per unit). However, infrastructure and water needs are often higher per acre, requiring thoughtful planning and investments.
• Inventories of potential redevelopment sites and clear information on housing approval processes can signal redevelopment readiness. Priority areas for infill housing may benefit from “fast-track” approval processes.14
Greenfield
The need for greenfield housing over the next three decades will be very high, driven by growth in smaller adult households searching for singlefamily attached and single-family detached homes that meet affordability requirements. Demand for greenfield housing may be sharply higher than anticipated in transportation and land use plans if infill and redevelopment constraints aren’t abated. While greenfield land appears abundant in some Utah submarkets, “easy” greenfield housing opportunities (those with water, planned infrastructure, and proximity jobs) are becoming increasingly scarce and may compete with agriculture, open space preservation, and water conservation goals.
Planned transportation, water, and sewer infrastructure capacity may already be constraining the rate of housing growth in some areas, and meeting future housing needs increasingly depends on strategic water conservation. Without addressing these constraints, greenfield markets may be up to 78,000 units short (25 percent of a vision-aligned housing target) of meeting housing demand in the Wasatch Front.15 Greenfield housing is expected to make up the majority of new housing growth in northern and southern Utah markets, reinforcing the importance of proactive planning and infrastructure investments.
Primary Constraints
Infrastructure
Timeline - ongoing
• Sewer treatment capacity may be insufficient to serve new housing demand by 2055 in rapidly growing greenfield submarkets under baseline redevelopment and density assumptions.. Cities report the difficulty of funding water and sewer infrastructure under rapid growth.
• Travel times are already a common quality of life concern in high-demand greenfield areas, and planned transportation investments may be insufficient to serve potentially accelerated housing demand in the fastest-growing regions nearest jobs and amenities.
Water
Timeline - 20+ years
• Residential water conservation is needed to stretch the reliable supply of water in many greenfield markets.
• In Washington County, water becomes a limit to growth between 2045 and 2055 based on current conservation and supply development plans. Additional conservation or new supplies will be needed to meet housing demand through 2055 and beyond.
• Greenfield single-family housing typically consumes more water per unit than attached housing or smalllot single family homes.
Planning and Zoning
Timeline - ongoing
• Development trends and planned and zoned densities in many greenfield areas are lower than anticipated market demand.
• Between 2014 and 2023, greenfield markets developed at an average gross residential density of 2.9 units per acre in the Wasatch Front.16 Market demand through 2055 suggests average gross densities of 3.3 to 5.2 units per acre, depending on the region.
• A 2024 review of zoning in Utah found that minimum lot sizes, setback and parking requirements, and restrictions on multi-unit housing limit the supply of new housing.17 Planned densities are better aligned with market demand, underpinning the importance of implementing housing plans with fidelity.
Secondary Constraints
Land Availability
Timeline - 10-20 years
• Under baseline model assumptions, nearly all greenfield land is developed in Salt Lake County, Davis County, and Northeast Utah County by 2035. The Wasatch Front is running out of greenfield land close to employment centers.
• Without increased infill and redevelopment, surplus housing demand may increase growth pressures in greenfield areas in Utah County, Weber County, and rural Wasatch Front Counties.
Policy Levers
Scalable Infrastructure Financing
High levels of greenfield housing demand suggest the need for expanded financing options for transportation, water, and sewer infrastructure. Funding infrastructure investments in greenfield areas in a way that is fair and fiscally responsible presents a major challenge. Growth in greenfield areas is best served by regional infrastructure systems which are difficult to implement using standard financing mechanisms.
• The state of Utah has worked in partnership with local governments to create several new financing tools over the past decade. The continued funding and utilization of approaches including the state infrastructure bank, tax increment financing tools, assessment areas, public infrastructure districts, and potentially novel tools and approaches may facilitate a market-informed boost in greenfield housing supply over the next 30 years.
Strategic Transportation Investments
Proactively addressing transportation needs in highdemand greenfield regions can ensure that residents in these areas can access jobs and amenities in the near term. Visionary road and transit infrastructure can also help these areas to attract jobs sooner than they otherwise would, although jobs are still likely to lag behind housing growth, potentially by decades.
• Transportation plans funnel significant investment into high-growth greenfield areas. Continuing to plan for these areas, given the constraints on infill and redevelopment will help transportation agencies prepare for future market dynamics.
Market-aligned planning and zoning
Planning for market-informed shares of multifamily and attached housing is one way communities can use land and water efficiently while reducing infrastructure spending.
• Because demand for single family detached homes remains high, single family homes may be built even in areas where attached housing is allowed, depending on local market factors.
• The total land area planned for housing is also a limiting factor and must be weighed against economic development, conservation goals, and water and infrastructure availability.
• Planning and zoning likely need to allow higher densities than this to produce market averages.
• In recent years, permitting trends have been even higher for multifamily and attached housing in some areas.
Average Greenfield Densities
Water-efficient growth
Using less water per unit enables the market to provide more housing units in each water-constrained region. Strategies to reduce water use per unit include:
• Encouraging or requiring low-water landscaping for new housing.
• Reducing the amount of irrigated area per unit.
Transit-Adjacent
Development conditions through 2055 suggests two distinct categories of transit-adjacent markets- “infill” transit-adjacent markets where residential demand is high and “greenfield” transit-adjacent markets where short-term housing demand may not support plans for transit-oriented development. Many communities are also planning for mixed-use centers that play a similar role in regional markets as transit-adjacent areas but may not be served by rail or BRTs (including in markets outside of the Wasatch Front). Many of the insights and policy levers for transit-adjacent markets also apply to these mixed-use centers.
Housing demand is expected to consume all eligible vacant and redevelopment land in transit-adjacent markets by 2055. Demand dynamics suggest that additional housing growth would occur in transit areas if there were more transit stops with rapid access to employment and amenity centers or if more redevelopment was facilitated within existing station areas. Market demand in infill transit-adjacent markets is mostly for multifamily and attached housing types. If constraints to greenfield housing limit capacity in those markets, additional housing demand may focus inward towards these transit adjacent markets.
Over the next 10-20 years, the market favors moderate density housing options in transit-adjacent markets further from the Salt Lake City and Point of the Mountain/Silicon Slopes employment centers. Unabated, this may result in fewer total units than allowed under local Station Area Plans (SAPs). If land is held for higher density housing, a significant lag in development may occur as housing (and commercial) demand slowly matures. These dynamics call for thoughtful approaches to achieve SAP goals and encourage flexible development.
In infill and greenfield transit adjacent markets in the Wasatch Front, housing growth could fall short of vision-aligned housing targets by up to 69,500 units (55 percent of the regional target) without proactive measures to increase capacity.18 Transit-adjacent housing tends to be land and water efficient while providing residents with expanded transportation
choices and access to nearby amenities and businesses, underpinning its importance in regional housing growth.
Develpopable land with transit-adjacent markets and centers can be subdivided into both infill and greenfield market types.
Transit-Adjacent Infill Constraints
Redevelopment Potential
Timeline - ongoing
• The amount of vacant and redevelopable land under modeled assumptions in transit-adjacent markets is low, ranging from 5 to 16 percent of the land area within a half mile of rail stations or a quarter mile of BRT stations in urban markets. This is because there are many established land uses that are economically sustainable with little incentive to redevelop.
• In modeled market conditions, all land that becomes eligible for redevelopment each decade develops by the end of the decade.
Transit Stations
Timeline - 20-30 years
• In the Wasatch Front, only 1 percent of developed land is in transit-adjacent markets. Even with higher densities, land limitations limit housing capacity within transit-adjacent areas based on current and planned + funded rail and BRT stations.
Transit-Adjacent Infill Policy Levers
Redevelopment Readiness
Transit-oriented housing redevelopment sometimes requires technical and financial support to succeed. Tools such as land banking, property aggregation, adaptive zoning, and tax increment financing (TIF) can help assemble sites, fund infrastructure and parking structures, and support affordable housing. In Utah, several new or expanded financing tools have been authorized in the last decade, and technical planning support is available through MPOs and state agencies. Funds available
through the state infrastructure bank may also support housing redevelopment in transit-adjacent markets and centers.
Capital funding remains a limiting factor for redevelopment. Site acquisition, preparation, demolition, and infrastructure upgrades may require gap financing to make projects viable. Targeted public investment in walkable streetscapes and shared structured parking can further reduce barriers and signal redevelopment readiness, helping to expand transit-adjacent housing capacity.
Targeted transit planning
Utah has a strong history in visionary transit investments, including the expansion of TRAX into greenfield areas such as those in southwest Salt Lake County.. State agencies and local governments have also utilized new transit stations to catalyze redevelopment in underutilized areas, such as the S-Line streetcar in Salt Lake City and South Salt Lake which “helped to catalyze over $2B in private sector development and redevelopment which resulted in 2,000 new housing units.”19
• Adding unfunded transit stations from WFRC and MAG’s Regional Transportation Plans increases transit-adjacent “buildable acres” by 29 percent (2,072 acres) based on current redevelopment
Case Study:
assumptions. Transit-associated changes to planning and zoning would likely increase redevelopment potential near new stations by raising land values.
• Redevelopment potential can inform projected ridership numbers and project prioritization to ensure that transit investments not only serve existing households but catalyze new housing development.
Station Area Plans
Station Area Plan (SAP) requirements were established in 2022. This legislation aims to align investments in fixed-guideway transit with supportive local land uses by requiring cities to adopt targeted plans. The goals of SAP requirements are to expand the supply of housing, enhance access to opportunities, and expand transportation choices available to Utahns. These plans typically increase allowable residential densities, incorporate mixed-use zoning, and reduce parking requirements to better align land use with transit access. In some cases, incentives may be required to support the densities envisioned in SAPs.
As of August 2025, Station Area Plans have increased planned housing capacity in transitadjacent markets by approximately 50,700 units.21
Millcreek’s Use of Shared Parking and Federal Funding to Support Housing and Community Needs in
the City Center
At a construction cost of approximately $35,000 per stall, structured parking is extremely expensive for mixed use multifamily housing projects, although it is desperately needed. In Millcreek, parking requirements for a new 60,000 sf city hall would be 296 stalls, and parking requirements for a nextdoor mixed-use structure with 197 apartments and 7,500 sf of ground-floor retail would be 398 stalls, for a combined 694 stalls (costing approximately $24M).
However, a parking study of peak daytime and nighttime uses determined that creating a shared parking structure serving residential, civic, and commercial uses would require only 463 parking stalls. This brought the garage cost down to $16,205,000—a savings of over eight million dollars. Millcreek used American Rescue Plan Act stimulus funding and temporary state redevelopment grants to cover a significant portion of the city’s share of the costs.
The resulting parking structure will be critical for the success of the new city center and has also enabled a mixeduse development with housing for nearly 200 Utah families to become a reality. 20
Case Study: The Point, Creating Housing Opportunities on State Owned Land
Publicly owned or surplus land presents unique opportunities to demonstrate the viability of redevelopment and provide sites for new housing. By leading with public land, local and state governments can model best practices, reduce land assembly barriers, and demonstrate market feasibility.
In 2018, the Utah Legislature acted on one of the most significant opportunities to add housing on state land by creating the Point of the Mountain State Land Authority to oversee redevelopment of the 600-acre former Utah State Prison site. The first phase is expected to add over 3,300 homes, including roughly 400 designated affordable units. The long term vision for approximately 7,400 units is significant in Southeast Salt Lake County, where redevelopment potential and planning and zoning restrictions are expected to constrain housing capacity under baseline conditions.22
• New transit stations are likely to catalyze the most housing development in markets closest to economic centers in Salt Lake City and the Point of the Mountain/Silicon Slopes.
Transit-Adjacent Greenfield Constraints
Demand timing
In many greenfield transit-adjacent areas, short-term demand does not yet support the densities envisioned in Station Area Plans or other long-range visions. Under modeled conditions, greenfield transit adjacent markets (including station areas in Utah, Davis, and Weber Counties) largely build out by 2035 at densities below 10 units per acre. Holding land for higher densities can create delays in development, while pursuing lowerdensity patterns too early may limit the long-term potential of transit investment. Initial development in greenfield transit adjacent areas and future centers will eventually see demand materialize, making flexibility a critical factor in planning for these areas.
Transit-Adjacent Greenfield Policy Levers
Targeted Transit Planning
Focusing early transit investment in high-demand areas, such as northwest Utah County, can help align infrastructure with emerging housing demand. In addition, strategic
transportation expansion may accelerate job growth in rapidly growing greenfield markets. Flexible financing options and investments in water, sewer, and roadway infrastructure are also needed to facilitate growth in these areas.
Flexible Development Approaches
Planning tools that allow a balance between short-term feasibility and long-term vision can help greenfield transit-adjacent markets and planned centers evolve successfully. Approaches may include varied lot sizes, form-based codes, zoning provisions for flexible first floors, and transition zones around centers. Appropriate transition zone uses include middle housing and larger footprint commercial uses that can buffer lower density suburbs from future centers. Incompatible uses such as large-lot single family housing, large-format warehouses, and big box stores without redevelopment plans are generally incompatible with future transit-oriented and center development.
Surface parking may be used as a strategic land bank for future development in some cases. Financing opportunities and direct funding for structured parking can help to support placemaking and higher density housing as demand grows over time.
Water
Constraints
Water Availability
Timeline
- 20+ years
• Water is becoming an increasingly important constraint to Utah’s housing capacity. Water supplies and distribution systems are regional in nature, making water availability relevant to new housing in greenfield, infill, and transit adjacent markets. While regional conservation plans suggest that most basins can support projected growth through 2055, in many cases this is only possible if municipal and industrial conservation targets are achieved. Under modeled assumptions, Washington County water demand will exceed supply by 12 percent even if current conservation goals are met, potentially contributing to a shortage of 29,000 units by 2055. Competition for water among housing, agriculture, energy, economic development, and environmental priorities—particularly the Great Salt Lake—creates added uncertainty about future water availability. Utah will have to use its water resources efficiently to avoid future water-based housing shortages in key markets.
• Utahns understand water’s importance to quality of life in Utah, but many have misconceptions about their own water use and the relative importance of outdoor residential water use.23 Thoughtful water use and conservation in all sectors, including new and existing residential communities, is needed to sustain Utah’s economy and natural beauty for future generations.
Conservation Goals
Statewide municipal and industrial (M&I) water conservation goals call for a 16 percent reduction in per-capita use by 2030 (from a 2015 baseline), with additional savings targeted in subsequent decades. 25 In the Great Salt Lake Basin, the Great Salt Lake Strategic Plan estimates that 471,000–1,055,000 acre-feet of additional inflows per year are needed to reach a healthy elevation of 4,198 feet. To do so, the Strategic Plan recommends accelerating the statewide conservation milestones within the basin. 26 Water for new housing should be considered within the context of these goals.
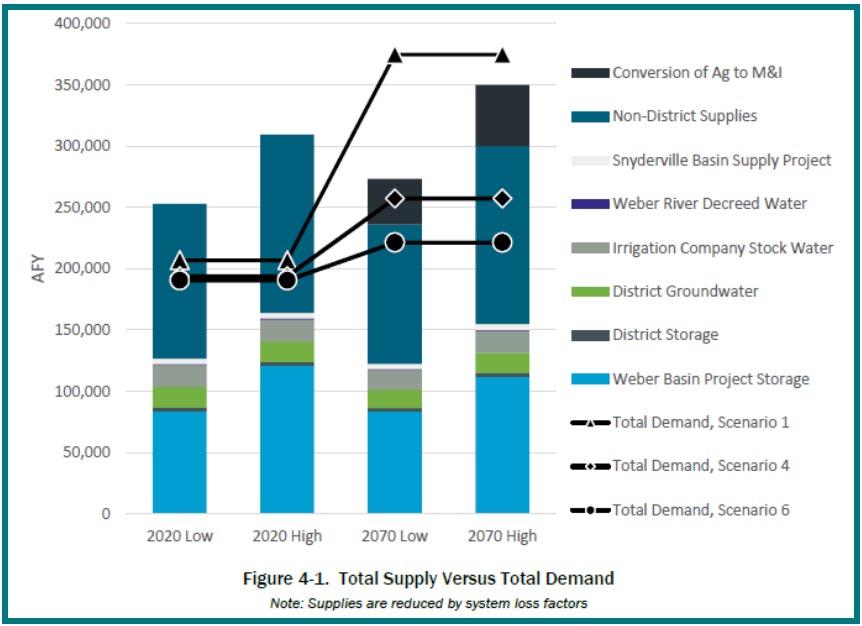
Future water supply and demand for the Weber Basin. Non-agricultural supplies are expected to decrease by 2070 in both scenarios as climate change and drought impacts continue. Demand only remains lower than supply under use scenario 4 (high conservation improvements) and use scenario 6 (state conservation goals). Demand scenario 1 represents high population growth, high climate impacts, and minimal changes to historic use.
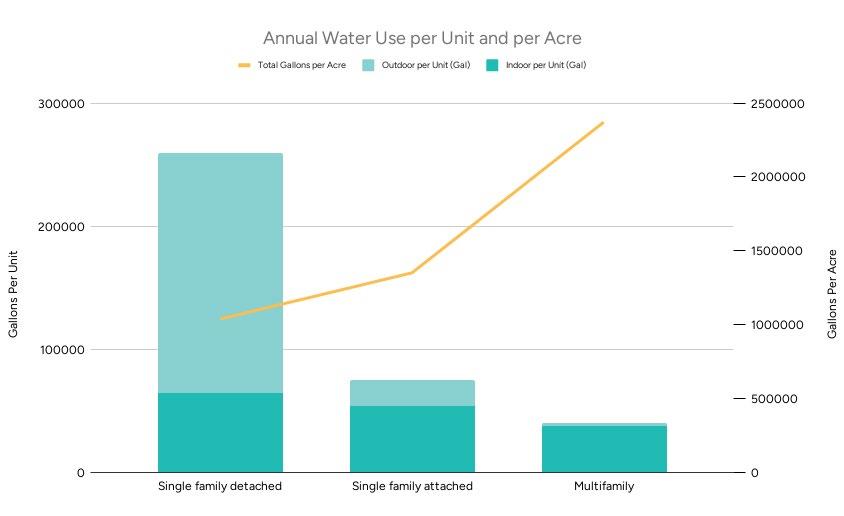
Attached and multifamily housing use less water per unit, but more water per acre, than single family detached. A higher share of multifamily and attached water is used indoors. The accompanying table shows the underlying assumptions for each unit type. Data source: Jordan Valley Water Conservancy District (2019 Memorandum- housing density and water use)
Water
Treatment and Distribution
Timeline - ongoing
• At a more local level, water treatment and distribution infrastructure are required to ensure that available water can be used for new housing. Treatment and infrastructure costs are significant for water districts and cities. Costs may vary by water source, local topography, land use pattern, and more.
Policy Levers
Water-efficient landscaping
The majority of indoor residential water use flows into wastewater treatment facilities where it is treated and sent downstream to the Great Salt Lake and other water bodies. In Washington County, a portion of indoor wastewater is treated for reuse.. Outdoor
Water Conservation Plans
Successful efforts in Washington County suggest that sustained conservation programs can deliver measurable savings and are needed to support long-term growth. Washington County Water Conservancy District (WCWCD) has turned to ambitious water conservation to overcome significant supply limitations and achieved a 30% reduction in per capita use between 2000 and 2023. 27 However, without additional conservation measures or water supply sources, Washington County will run out of water soon after 2042. In WCWCD’s 20 year plan, they incorporate water sources including new supply projects, groundwater optimization, agricultural conversion, and reuse to meet demand through 2042. In addition, they expect conservation from existing water uses to represent 24 percent of new water “sources.” 28 Additional sources or conservation will be needed to meet demand beyond the late 2040s. Planning is ongoing. Land Use Assumptions
residential water use, on the other hand, is essentially a “consumptive” use that can’t be relied on for reuse or environmental flows. Accordingly, outdoor water conservation is the priority when it comes to ensuring water availability for future housing and other uses. Water efficient landscaping can reduce outdoor water use by 66 percent.24 Landscaping requirements for new housing can effectively stretch finite water supplies over a larger number of units, provided they can be administered and enforced effectively. Given the myriad pressures facing the state’s water supply, landscaping conservation is important not only in new housing but in the existing housing stock as well.
Irrigated area per unit
Outdoor irrigated area per residential unit is the other primary policy for expanding the supply of housing with limited water availability. Multifamily and attached housing, or even small-lot single family detached
housing, generally uses less water because there is less irrigated land area per unit. As such, reducing barriers to multifamily and attached housing in transit-adjacent, infill, and greenfield markets can be considered a water conservation strategy. It should be noted, however, that multifamily housing may use more water per acre than single family housing and may require higher-capacity distribution infrastructure.
Water-informed planning
Some land rich areas near job and population centers, such as northwest Utah County and Tooele County, are very arid and are likely to run out of water before land. Water Conservation plans in Saratoga Springs and Eagle Mountain suggest that water availability in the region will be more limiting than land availability based on baseline conservation assumptions. Areas such as western Weber County and southeast Utah County have agricultural water that could be treated and used for future housing, although these conversions should be weighed against agricultural production and conservation goals. New or accelerated water sources or conveyance projects may be warranted in some high-demand areas, while water
supply and conservation barriers may be too significant in others, in which case housing needs will need to be accommodated in other nearby markets.
Homes with smaller irrigated areas and more efficient landscaping reduce consumptive water use compared to homes with large lawns.
WCWCD is targeting a water allocation of 0.59 acre feet per year for new equivalent residential connections (ERUs).
Areas for future study
The Utah Resource and Infrastructure Housing Capacity Analysis provides a wealth of insights about potential regional limits to housing development over the next three decades. It also identifies a number of data and planning gaps that would benefit from future study. These include:
1. Better tracking of redevelopment and its role in housing growth
• The acreage and density of redevelopment is a key assumption for infill housing capacity. Existing data sources such as county parcel records and the housing unit inventory may inform future efforts to better track redevelopment and net housing growth. A review of redevelopment rates of peer regions may also inform expectations of redevelopment.
2. Detailed water study and scenario planning
• Current analyses in the State Water Plan and this analysis serve as a baseline for understanding water as a regional constraint to housing and population growth, but more detailed analysis is needed to determine how water supply might affect Utah’s growth, economy, ecosystems, and quality of life under plausible growth, conservation, and hydrological scenarios.
3. Quantified impacts of second homes and short term rentals on housing supply and prices
• Shares of second homes and short term rentals impact the number of units available for primary residences, either as rentals or owner-occupied. Past inventories could be expanded upon to better understand impacts of future housing demand and prices.
4. Technical support for future centers planning
• WFRC, MAG, and UDOT provide local planning grants that can support future center planning. The housing capacity analysis highlights a need for targeted resources and best practices to guide the development of strategic mixed-use centers in greenfield markets, where current demand often favors lower-density, single-use development, but long-term goals call for denser, more activating land uses.
5. Regional inventories of planned sewer capacity
• Sewer planning and data available is more localized than other infrastructure such as transportation and water. This Housing Capacity Analysis takes a first look at planned sewer capacity by region, but more robust analysis could further clarify how planned sewer capacity aligns with regional housing demand and inform future planning and investments.
Appendices
TECHNICAL APPENDIX: DEMAND AND DISTRIBUTION MODELING
DEMAND MODELING METHODOLOGY
Overview
RCLCO forecasted demand across six distinct regions1: the Wasatch Front, the Wasatch Back, Box Elder County, Cache County, Iron County, and Washington County While some household growth and market activity is likely to spill across regional boundaries particularly where affordability pressures or supply constraints push demand into previously less developed areas this regional framework provided a clear and logical starting point, allowing RCLCO to build on established demographic projections while accounting for the unique drivers and dynamics that characterize each of these key regions in Utah
Primary Data Sources2
► Kem C. Gardner Policy Institute:
o RCLCO leveraged both short- and long-term demographic projections provided by the Gardner Institute to inform the number of housing units required to accommodate projected growth at a regional level
o Gardner Institute permitting data was also used as a benchmark in determining how forecasted housing demand compares to historical building activity in the various regions
► U S Census Bureau:
o Historical U S Census Bureau Public Use Microdata Samples (PUMS) were used to inform household composition and preference assumptions in the model
Modeling Framework
RCLCO’s demand model follows a hierarchical process that begins with a blended population forecast from the Gardner Institute and works step by step through demographic and economic segmentation to arrive at forecasted housing demand by product type, tenure, and price point:
1 Age cohorts as the starting point: The Gardner Institute’s population projections were divided into three broad age groups: 18-34, 35-64, and 65+ Each cohort reflects a distinct life stage, with different propensities for household formation, tenure choice, and housing preferences
2. Separate models for owners and renters: Within each age cohort, RCLCO modeled owners and renters separately, as all the subsequent segmentations household size, income, and product preference vary by tenure. This approach prevents those differences from being averaged together and preserves the ability to adjust assumptions within each group independently
3 Household size distributions: Starting with the number of new owner or renter households in each age group, the model applies household size distributions to determine the number of one-person, two-person, and three-or-more-person households. This step captures structural differences in housing needs, such as the greater likelihood that larger households will demand larger, often single-family, homes.
1 Illustration included on the final page
2 Considering that some of regional boundaries do not align with county and/or U.S. Census PUMA boundaries, Kem C. Gardner Policy Institute and U S Census Bureau data was weighted based on population when required
4 Income segmentation: Income distributions are layered in, enabling the model to isolate households by age, tenure, household size, and income level For example, the model can identify two-person owner households headed by someone aged 18-34 earning between $100,000 and $150,000 annually
5. Product type allocation: With income groups established within the broader framework of the model, product type preferences are applied to determine the share of households likely to select multifamily, single-family attached, or single-family detached housing
6 Affordability calibration and vacancy adjustment: Household incomes are translated into affordable home prices and monthly rents, and structural vacancy factors are applied reflecting the additional housing demand associated with units that are not occupied by full-time or seasonal residents.
7 Aggregation of results: The outputs of the six age-tenure models are aggregated to produce broad measures of housing demand by product type, tenure, and price point
Although the model could have been executed at a higher level for example, by applying overall owner and renter propensities without segmenting by age cohort the hierarchical structure utilized allows greater control over assumptions, ensures that lifestyle differences are accurately captured, and enables sensitivity testing at each stage.
This initial output of the age-tenure models reflects structural net new demand the housing that is required to accommodate Gardner Institute household growth projections While this is a helpful benchmark, actual housing demand does not come solely from newly formed households In practice, existing households also move within the market, often “trading up” into larger or more expensive homes When this occurs, their previous, typically more affordable, housing becomes available to less affluent households who take their place. In this way, a portion of demand will be met through the reallocation of the existing housing stock.
To capture this dynamic, a reconciliation step was included in the demand modeling process Considering that this analysis is ultimately concerned with identifying what housing needs to be built, the reconciliation step adjusts net new output in two ways: new households that are likely to be accommodated by units vacated through turnover are removed from the structural demand and existing households that are already in the market but are likely to move up into new product types are added in This adjustment ensures that the final outputs more closely align with market activity today, producing a distribution of demand by product type and price point that reflects not only household growth but also the trade-up and mobility dynamics that contribute to real housing consumption
Key Assumptions
Several assumptions heavily influence the demand modeling framework, each of which is necessary to translate demographic forecasts into housing demand estimates While these assumptions were designed to align the model with the best available data, they represent judgment calls made by RCLCO in applying the methodology:
► Headship rates: RCLCO applied age-specific headship rates to the Gardner Institute’s population projections in order to derive household growth by age group These figures were calibrated to ensure that the aggregate household projections align with the Gardner Institute data
► Housing preferences and affordability: The model assumes that housing preferences will be influenced by increasing affordability challenges. As a result, product preferences observed in U.S. Census data were adjusted in favor of denser product types namely multifamily and single-family attached housing to better align outputs with permitting trends and recent transaction activity in the various regions.
► Mobility and market reallocation: The reconciliation step assumes that existing households trading up within the housing market create opportunities for younger and/or less affluent households to backfill vacated units This assumption recognizes the role of turnover in shaping demand, but the precise rates of turnover are subject to variation that is difficult to account for
Limitations
As with any demand modeling exercise, results should be interpreted in light of key limitations:
► Dependence on forecast data: The demand models rely on demographic projections from the Gardner Institute. While these projections represent the best available data, they may not capture unexpected economic, demographic, or policy shifts.
► Reliance on U.S. Census historical data: Ownership propensity, household size, income distribution, and product preference assumptions were heavily influenced by historical U S Census data While PUMS provide unparalleled detail, they are data samples and they are limited to Public Use Microdata Areas (PUMAs), which do not always align perfectly with county or regional boundaries
► Adjustment of preferences: Modifications to product preferences to better reflect affordability and observed market activity improve alignment with recent permitting and transaction activity but introduce a layer of interpretation that could differ under changing market conditions
► Sensitivity to assumptions: Various assumptions (e.g., headship rates, tenure splits, affordability thresholds, etc.), if altered, would shift the outputs of the model meaningfully. While sensitivity testing helps mitigate this risk, results should be viewed as directional rather than absolute.
DISTRIBUTION MODELING METHODOLOGY
Overview
To provide a more granular understanding of how future growth may manifest across the built environment in Utah, RCLCO developed a series of distribution models These models translated regional housing demand into submarket and land type demand, illustrating how different locations and their land categories could deliver housing over time
Primary Data Sources
► Envision Utah:
o RCLCO leveraged Envision Utah’s estimates of buildable land capacity by submarket, land type, and decade (2026-2035, 2036-2045, and 2046-2055). In addition to incorporating vacant buildable land, these estimates also included redevelopable capacity estimates ensuring that the model accounted for long-term potential in relatively dense areas
► Counties and UrbanFootprint:
o Parcel data was utilized to calibrate land values, prevailing development densities, and ratios of commercial to residential activity within each submarket and land category
► U.S. Census Bureau:
o Historical vacant housing trends and locations were used to inform assumptions about the proportion of land likely to be allocated to non-primary residential product types
Modeling Framework
The distribution models follow a structured, hierarchical process designed to allocate regional housing demand to submarkets and land categories in a way that reflects both capacity and market feasibility The process unfolds in several steps:
1. Conversion of gross buildable land to primary residential capacity: Buildable land figures provided by Envision Utah were first converted into estimates of net acreage figures available for primary residential use. This required accounting for acreage likely to be consumed by commercial development or seasonal housing as well as horizontal infrastructure losses such as roads, green spaces, and other required improvements.
2 Assignment of development efficiencies by housing product and price band: Each housing product type at each price level identified in the demand modeling effort was assigned an efficiency factor, expressed in units per acre These density assumptions were based on developer preferences and observed market trends
3 Implied development value ranking: Once density assumptions were established, each housing product type at each price level was assigned an implied built value per acre For for-sale housing, this was calculated as the average unit price within the band multiplied by the density assumption For rental housing, a capitalization rate-based valuation method was applied to translate achievable rents into development value per acre
4
Categorization of land by market value and appeal: Each submarket and land type combination (e g , infill land in Northeast Salt Lake County) was assigned a relative value rank based on observed land values, development activity, and market appeal This ranking established the hierarchy of land likely to be most attractive for new development
5. Hierarchical waterfall allocation of demand3: With net primary residential capacity established, housing product efficiencies assigned, and implied development and land value rankings established, a framework of inputs was in place to sort demand into more nuanced areas with a waterfall model In this waterfall model, housing product types were matched to land categories by comparing implied development values per acre against implied land values per acre, ensuring that only feasible product-land pairings were advanced When feasible, the highest-value products were directed first to the highest-value land until capacity was exhausted, at which point the highest-value products remaining were directed to the next-highest-value land until capacity was exhausted This process was repeated until all of the regional demand was exhausted
Key Assumptions
Several assumptions underpin the distribution modeling framework, each of which reflects a necessary simplification of complex market processes:
► Converting gross capacity to net capacity: RCLCO assumed that primary residential assets will continue to consume a similar percentage of the aggregate acreage capacity as has been historically demonstrated.
► Density assumptions: Efficiency factors were based on prevailing market practices and developer preferences and remain unchanged over time
► Hierarchical market logic: The model assumes that development will proceed in a rational sequence, prioritizing higher-value housing on higher-value land
► Stability of product preferences: The housing preferences derived from the demand modeling efforts were held constant during the allocation process
Limitations
Distribution modeling results are best understood when considered alongside the following key limitations:
► Perfect market assumptions: The hierarchical distribution process assumes a market that allocates demand in an efficient and frictionless manner In practice, development outcomes are shaped by political processes, environmental constraints, financing conditions, and other frictions that may create deviations from the model’s logic
► Static product preferences: Since product preferences were not adjusted dynamically during the allocation process, the model does not capture substitution effects (e.g., households shifting to denser products within Salt Lake County as available land becomes exhausted). However, the heightened preference for higher-density products observed in recent historical building activity is reflected in the demand modeling outputs, and RCLCO generally believes that product will take precedence over location within reason supporting this methodological choice.
► Dependence on capacity data: The model is highly dependent on Envision Utah’s estimates of buildable capacity, including assumptions about redevelopment potential4
► Aggregation across land categories: Distribution occurs at the level of submarket and land type, which smooths over parcel-level heterogeneity The results therefore illustrate broad trends rather than precise, parcel-specific outcomes
3 In cases where multiple submarket and land type combinations were placed in the same value tier, demand was distributed proportionally according to available capacity
4 Redevelopment capacity was estimated by applying product-specific capture rates to infill and transit-adjacent parcels. Eligible parcels were defined as those with structures over 40 years old where the improvement value was less than the land value
DEMAND MODELING OUTPUTS
By 2055, more than 840,000 additional housing units will likely be required to accommodate projected growth in all of the study areas
Approximately 75% of this housing demand can be attributed to the Wasatch Front, reinforcing the region’s significance Washington County represents the next-largest share of demand, reflecting its position as one of the fastest-growing areas in the state. Beyond these two primary centers of growth, additional demand will likely be distributed across the Wasatch Back, Box Elder County, Cache County, and Iron County, as development is likely to increasingly respond to local economic expansion, recreation-oriented dynamics, and the availability of relatively affordable land.
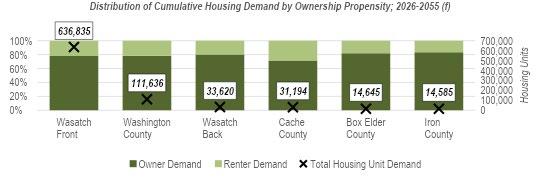
Consistent with historical trends, owner demand is expected to remain high While ownership propensities were trended down within each age group model to reflect ongoing affordability challenges, the underlying demographic shift towards older cohorts who historically exhibit higher ownership rates pulls the aggregate ownership rate upward As a result, for-sale housing accounts for the overwhelming majority of projected housing demand in every region
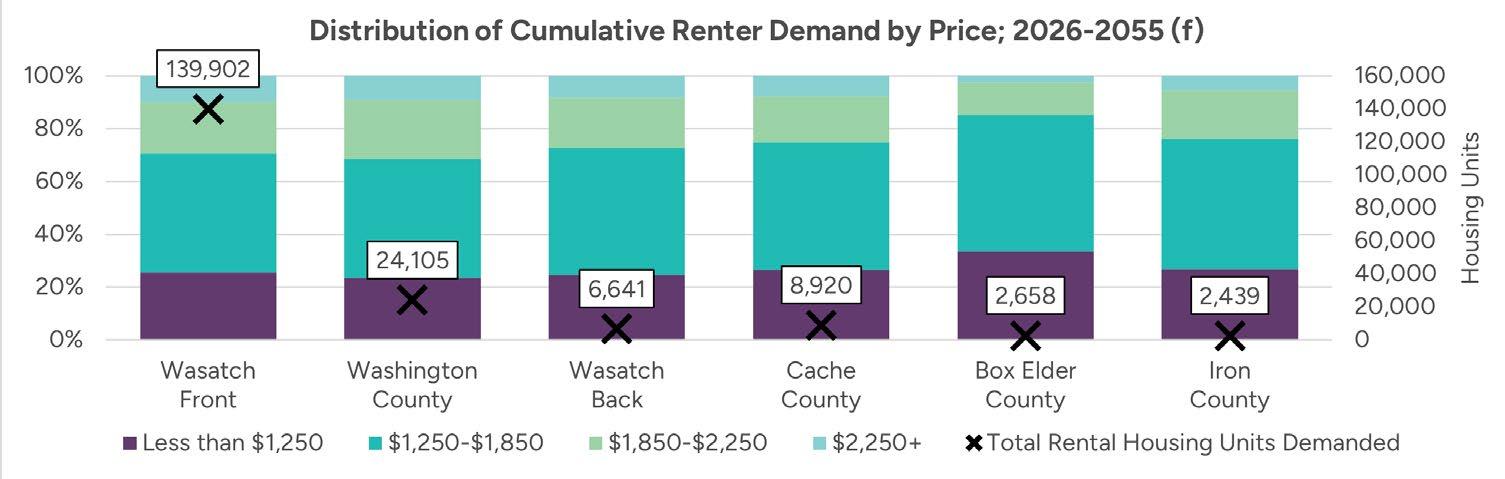
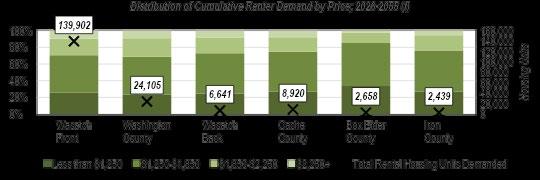
Despite renter demand representing a relatively small percentage of overall demand across the various study areas, these relatively small percentages often translate to a meaningful number of units providing critical housing options for workforce mobility, creating entry points for younger households, and supporting overall flexibility
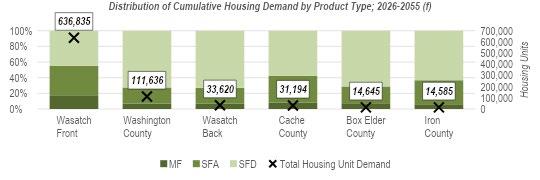
Housing demand by product type reflects stark regional differences In the Wasatch Front, a disproportionately high share of future demand is for denser product both single-family attached and multifamily largely driven by greater urbanization and price appreciation Outside of the Wasatch Front where land constraints have yet to meaningfully impact development trends single-family detached homes are likely to remain the most demanded product through 2055
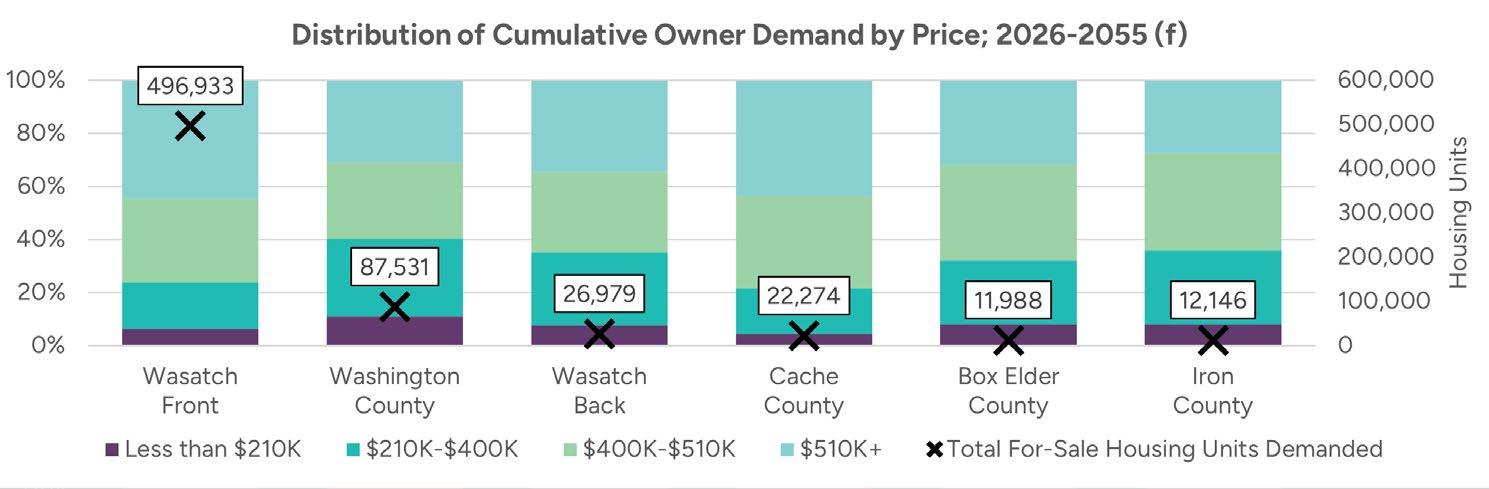
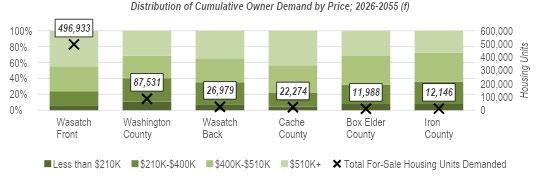
Demand by price distributions further illustrates the unique nature of the Wasatch Front with product priced over $510,000 representing 45% of for-sale demand and units renting for over $1,850 per month accounting for 30% of rental demand in the region. These disproportionately high figures reflect the Wasatch Front’s draw as Utah’s primary economic hub, where higher household incomes, strong in-migration, and escalating home prices combine to push demand toward the upper end of the state-wide market
Cache County has emerged as a notable secondary market, with price distribution trends pointing to its evolution into a strong northern growth center By comparison, the remaining study areas are expected to generate less demand in the upper price tiers though it is important to note that these projections reflect primary housing demand and do not account for seasonal home purchases which would likely have a meaningful impact on Washington County and the Wasatch Back5. 6
Overall, the demand outputs point to a future in which Utah will need to continue delivering large quantities of diverse housing to accommodate the state’s impressive growth trajectory The Wasatch Front will continue to anchor the state’s housing market while periphery markets such as Washington County, the Wasatch Back, and Cache County will play important and growing supporting roles.
5 Seasonal demand was excluded to isolate the drivers of primary housing needs
6 Prices reflect 2025 dollars
DISTRIBUTION MODELING OUTPUTS
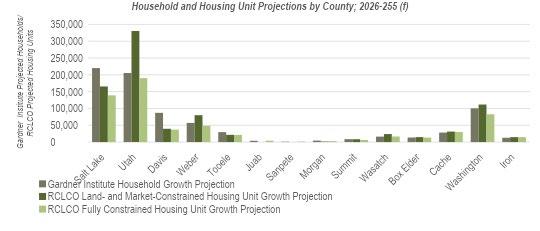
Utilizing the distribution model methodology outlined earlier in this report, RCLCO developed two projection scenarios to better understand Utah’s long-term housing growth potential The first is a “land- and market-constrained” housing unit growth projection that distributes regional housing demand across all buildable acres after adjusting for land expected to be used for commercial development, seasonal homes, and supporting infrastructure such as roads and open space in areas where it is financially feasible. The second is a “fully constrained” housing unit growth projection that distributes the same regional housing demand across buildable acreage totals that were further reduced to reflect more nuanced infrastructure and policy constraints. The difference between RCLCO’s housing unit forecasts and the Gardner Institute’s household projections is not rooted in conflicting demographic assumptions the Gardner Institute’s numbers were the foundation for the regional demand modeling but rather in how capacity will likely shape the market’s ability to absorb growth
► Land- and market-constrained housing unit growth projection: The land- and market-constrained projection illustrates how growth might unfold if driven purely by market dynamics and land availability When available space is considered, it becomes clear that some areas particularly Salt Lake County may not be able to accommodate their projected share of growth unless denser product types become financially feasible to develop, demand shifts more dramatically towards single-family attached and multifamily products, and/or the market becomes more adept at redeveloping existing structures. In the event that Salt Lake County is unable to accommodate its demographic growth projection, the land- and market-constrained model suggests that Utah County will become the region’s dominant growth engine largely explained by the county’s adjacency to Salt Lake County, established development patterns along the I-15 corridor, employment centers, relative affordability, and the availability of land
► Fully constrained housing unit growth projection7: At a high level, this scenario suggests that layering in policy (zoning/density) and infrastructure (water, sewer, and transportation) constraints produces significant housing shortfalls across the state, underscoring the degree to which physical and policy barriers could prevent future housing demand from being met.
7 To generate the fully constrained housing unit growth projection, RCLCO analyzed the outputs of the land- and market-constrained model relative to residential capacity figures provided by Envision Utah. Where infrastructure or policy restrictions (e.g., sewer, water, transportation) reduced unit capacity, a proportional adjustment was applied to the acreage capacity inputs For example, if the land- and market constrained model produced 100 units of demand, but sewer capacity only permits 50 units, the land consumptions associated with the 100 units was scaled back by 50%--converting the sewer constraint into a land constraint that the model could easily process Because this methodology relied on acreage as a proxy for unit capacity, variation in product densities had a marginal effect on outputs; however, the approach produced a directionally accurate output and provided a systematic way of demonstrating the influence of various constraints on development patterns
These projections are not intended to be prescriptive forecasts of exactly how Utah’s housing market will evolve, but rather an illustrative exercise that highlights where growth pressures are likely to emerge. By framing both the land- and market-constrained and fully constrained views, the analysis points policymakers and planners toward the geographies that are most at risk of stress from limited land capacity and/or other constraints, and where proactive intervention will be most critical to sustaining the state’s long-term growth.
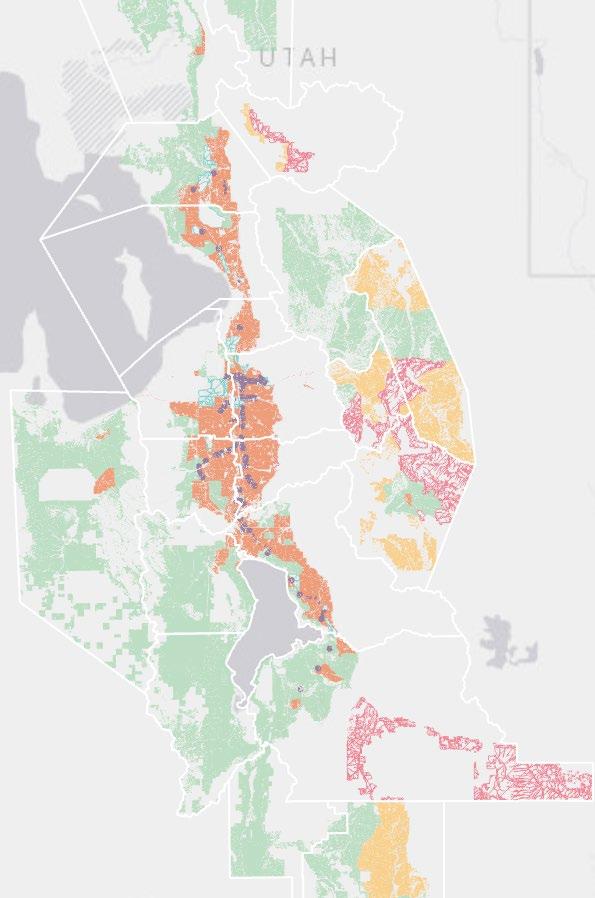
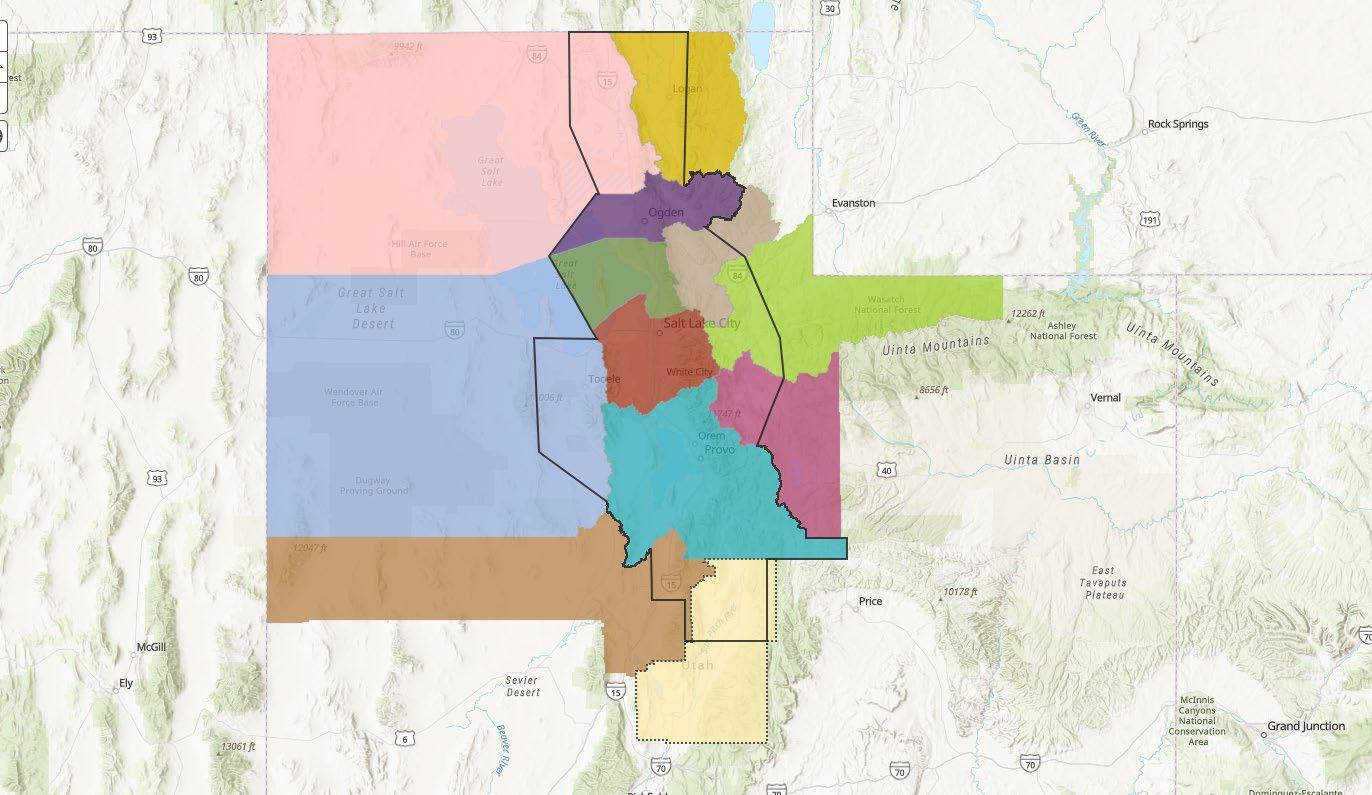
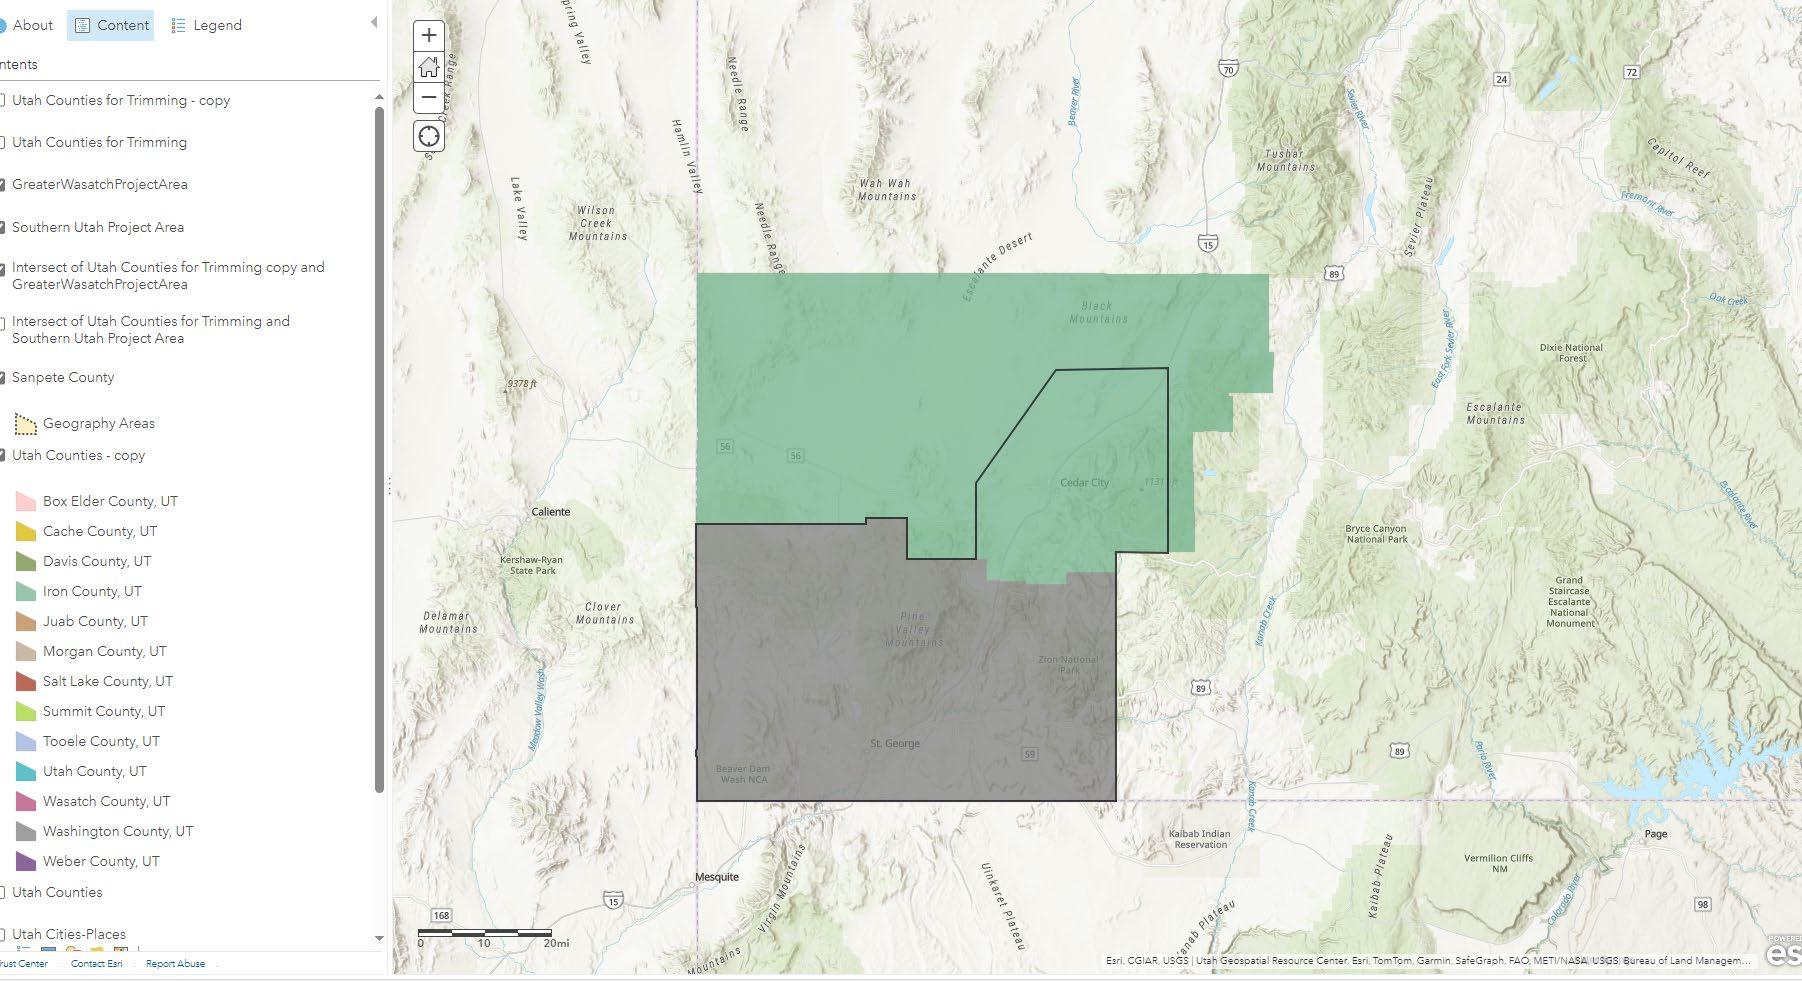
FORECAST AREAS8
Salt Lake County
Utah County
8 The black outlines are the boundaries for the study areas, representing where the majority of the population in each county resides
WASATCH FRONT
Davis County
Weber County
Tooele County
Juab County
Sanpete County
WASATCH BACK FORECAST AREA
Morgan County
Summit County
Wasatch County
ADDITIONAL FORECAST AREAS
Washington County
Iron County
Cache County
Box Elder County
Appendix B: Constraints Assumptions and Results
To complete the housing capacity analysis, Envision Utah modeled how resource, infrastructure, and policy constraints might shape regional housing capacity through 2055. Land availability, transportation planning, land use planning and zoning, water supply, and sewer treatment were considered. The findings demonstrate that while Utah has significant potential for new housing creation, constraints such as zoning limits, water availability, and sewer capacity, if left unmitigated, may result in substantial gaps between projected household growth and future housing development.
Land Availability
Assumptions
• Physical constraints (e.g., steep slopes and wetlands) and ownership/administrative constraints such as parks and certain public lands were excluded as “undevelopable.”
• Two classifications of land were considered available for future housing development: vacant land and redevelopment land.
• Vacant land area was identified using parcel data and water use classifications.
• Land currently used for agriculture was included in “vacant” area land totals. Many Utahns deeply value agricultural production, heritage, and viewsheds and would prefer to see more agricultural lands preserved. However, market trends suggest that land converted from agricultural uses represents a significant portion of land for new housing, so it was included in this analysis.
• Within transit-adjacent and infill markets, parcels where current land values exceed the value of recorded improvements were considered eligible for redevelopment. Eligible parcels were allocated across three decadal periods based on structure age. Redevelopment rates were applied to these eligible parcels based on current use.
• While these assumptions represent a plausible redevelopment scenario over the next 30 years, they are based on current assessed market values; future market or policy changes may influence redevelopment rates.
• Land availability assumptions were used to develop the baseline housing unit distribution scenario (baseline scenario), which is then used to evaluate the impacts of additional constraints.
Data sources: UGRC, Utah Division of Water Resources, UrbanFootprint, parcel data by County, Wasatch Front Regional Council, Mountainland Association of Governments
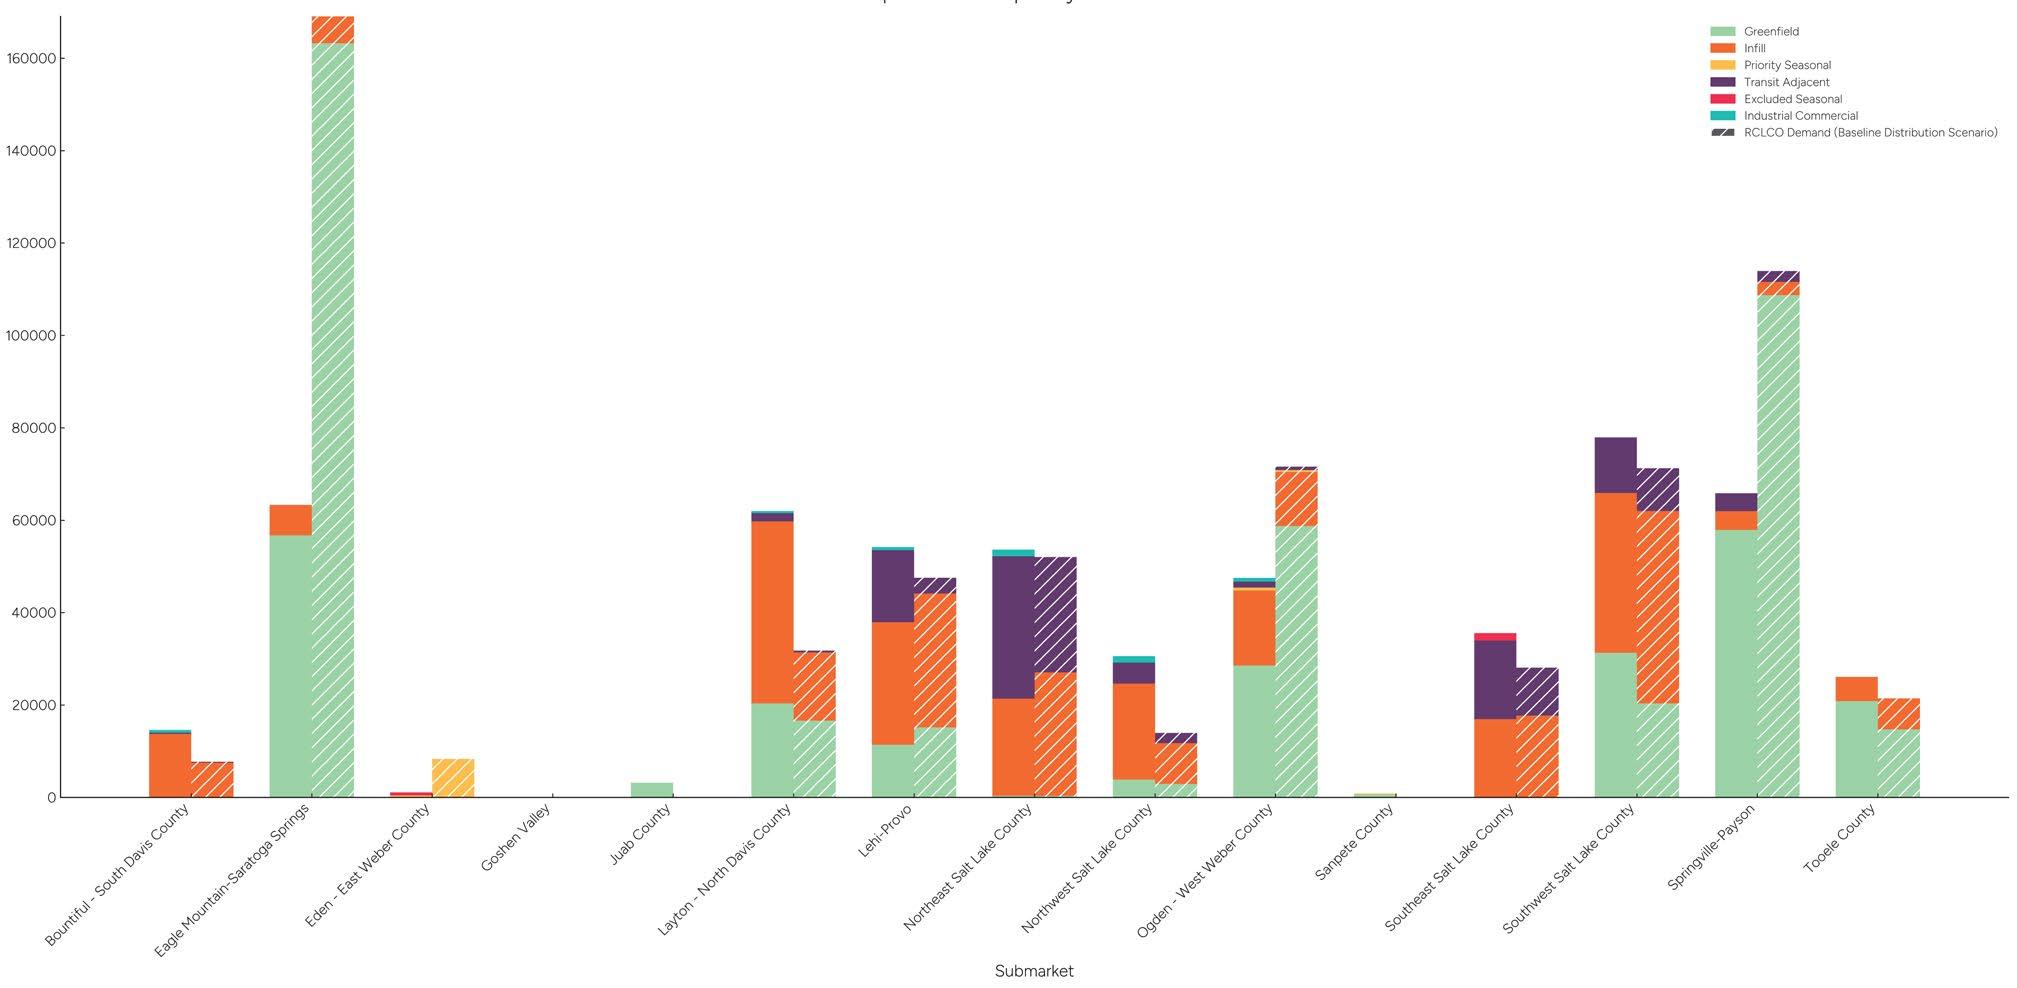
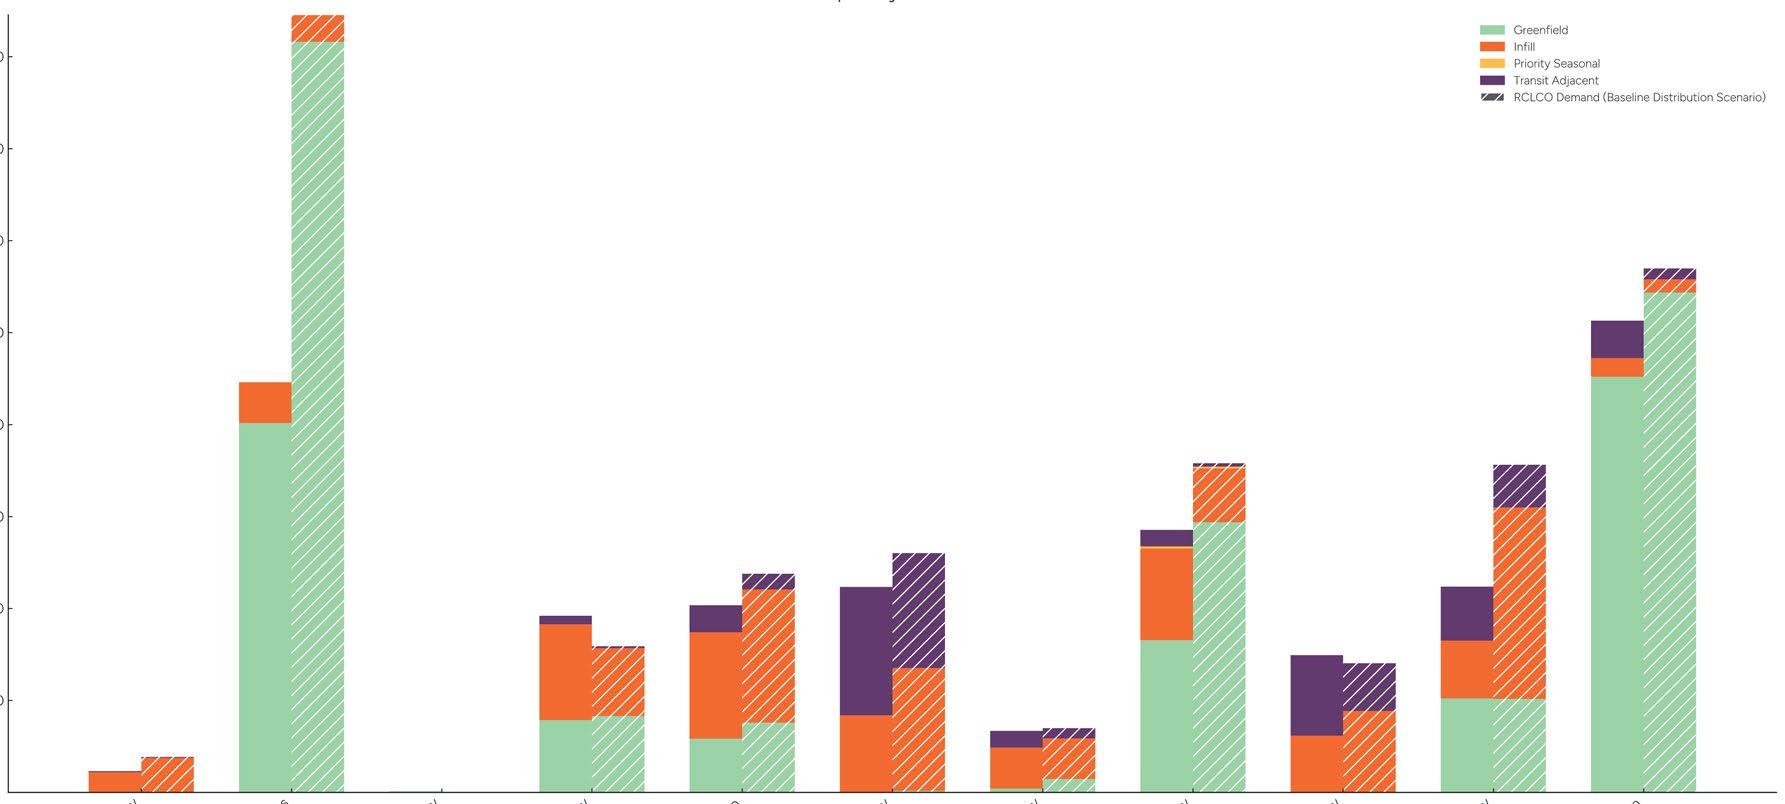
This chart shows cumulative housing units built by market type and submarket as a stacked bar and the percentege of land developed as an x. The table below shows the residential land acres considered available under a plausible land-and-market-constrained scenario.
Observations:
• The Wasatch Front region demands a substantial amount of single family attached and detached housing based on current and future demographics. Average household sizes are growing but the share of young adults (a key driver of single-family housing) as a percent of population is growing.
• Under baseline redevelopment assumptions, 100% of infill and transit adjacent land in all submarkets builds out over the next 30 years.
• All vacant greenfield land is developed in Salt Lake and Davis Counties. This mostly occurs over the first decadal period (2026-2035), after which greenfield
housing growth accelerates in Utah County and Weber County.
• In all study areas, 0.5% of vacant and redevelopment land is transit-adjacent, which accommodates 6% of new housing units in the land-and-marketconstrained scenario (1% of land and 9% of units in the Wasatch Front).
• In all study areas, 3% of vacant and redevelopment land is infill, which accommodates 24% of new housing units in the baseline scenario (5% of land and 27% of units in the Wasatch Front).
• Additional redevelopment land: To meet the Gardner Institute household projections for Salt Lake County,
an increase of about 55,000 units above the baseline scenario, land available for development/ redevelopment or development densities would need to increase by 33%. This translates to 5,121 new acres for development/redevelopment or an average net density of 14 units/acre for all new development across the county compared to the baseline density of 10 units/acre. In Davis County,
which is short 47,000 units compared to Gardner Institute projections, an additional 10,440 acres or a 120% increase in the density of new housing development (from 5 units/acre to 10 units/acre) would be required.
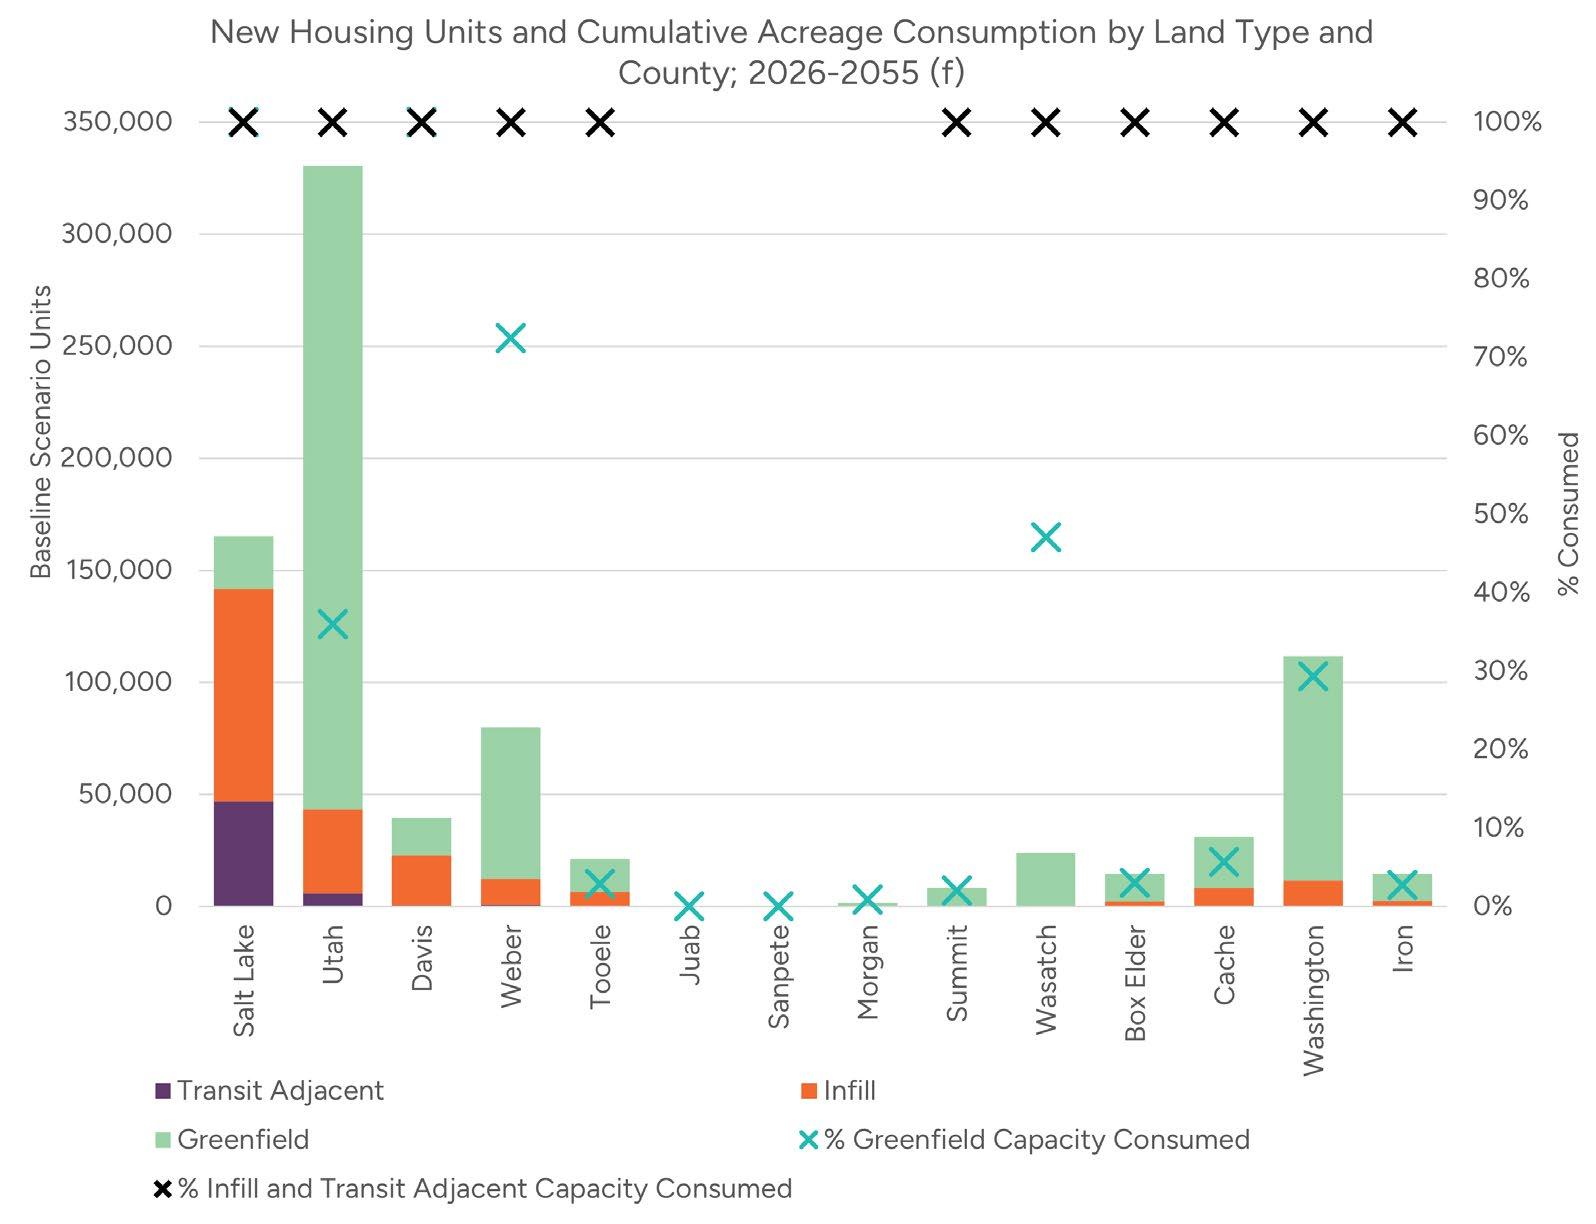
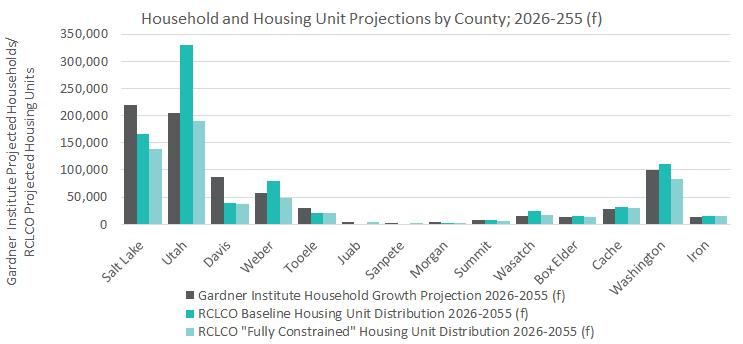
Households, New Housing Units, and Cumulative Acreage Consumption by County; 2026-2055 (f)
The baseline distribution scenario distributes more housing demand to greenfield-dominant markets including Utah County and Weber County and less to infill markets including Salt Lake County and Davis County than the Gardner Institute’s demographic projections, which are not constrained by land availability.
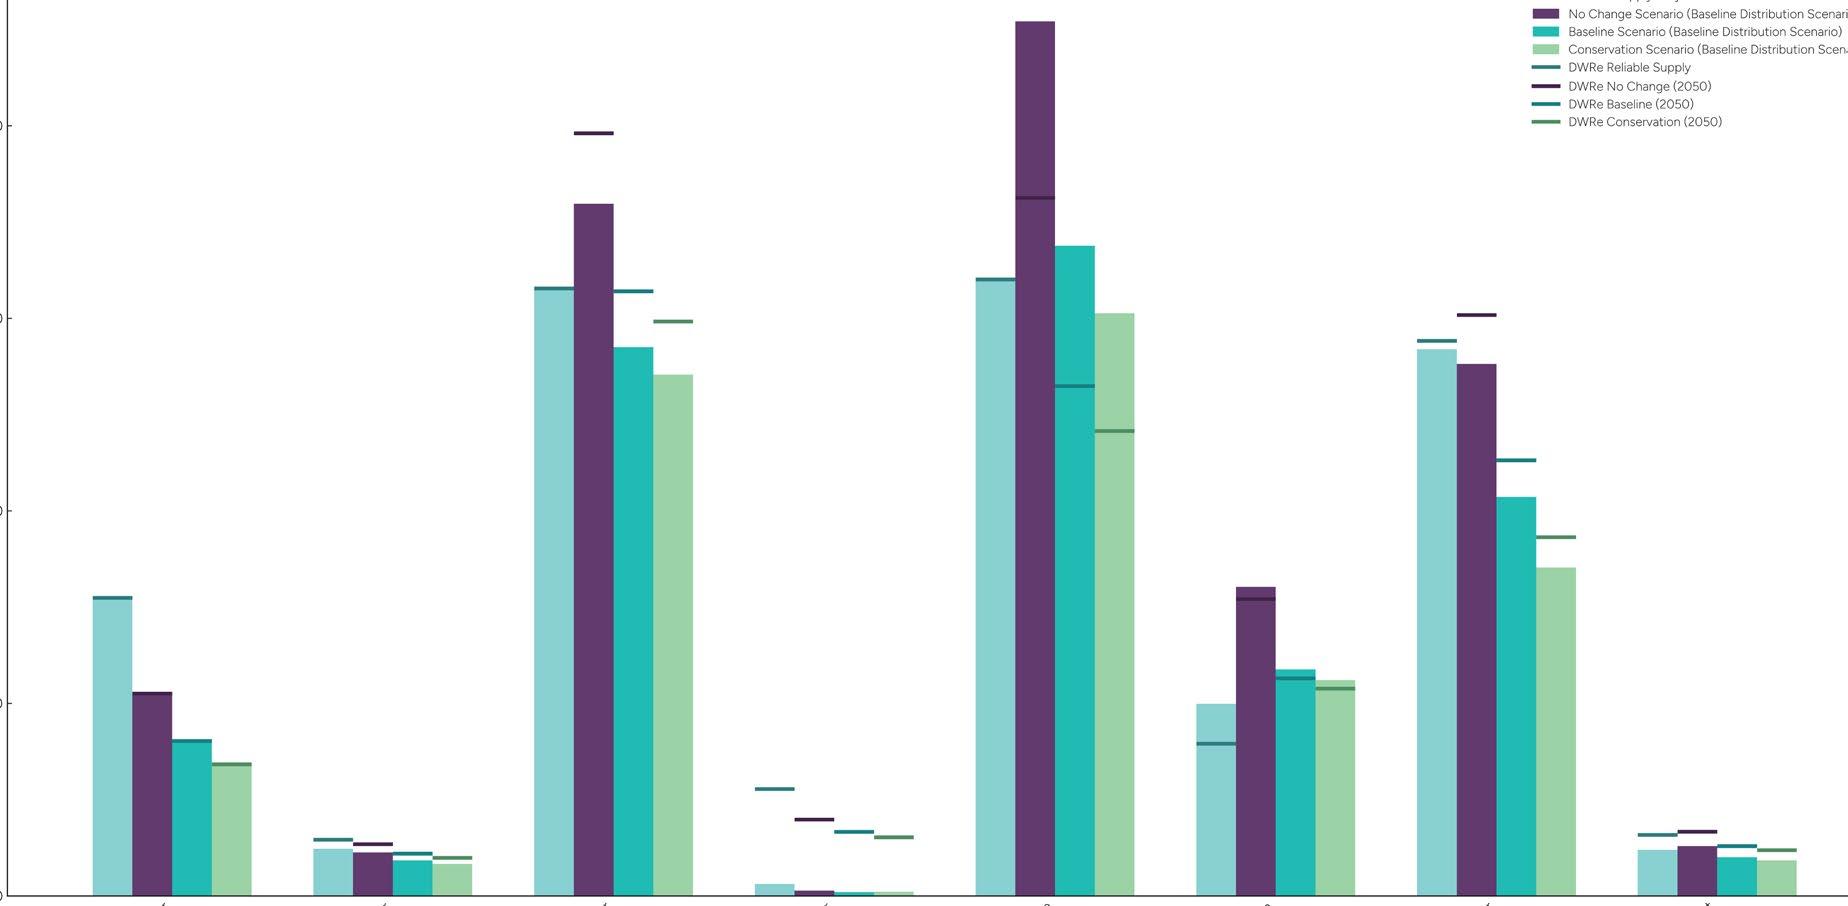
Transportation Planning
Assumptions:
• 2055 housing unit distribution by submarket and market type from the baseline distribution scenario was compared to 2050 household projections from the Utah Unified Transportation Plan.
• Total market demand for housing is higher than household projections because of the difference in target years, as well as structural housing vacancy which is five to ten percent depending on the submarket and market type.
• Traffic analysis zones used for transportation planning do not align perfectly with the market types used for the analysis, especially for transit-adjacent markets which were classified using a linear buffer.
Data sources: Utah Division of Transportation
Observations:
• Wasatch Front:
• The baseline scenario distributes less growth to transit adjacent markets than transportation
plan assumptions (9% of units vs. 17% of households).
• The baseline scenario distributes less growth in some infill markets than transportation plan assumptions (27% of units vs 40% of households)
• The baseline scenario distributes more growth to the greenfield markets with available land than the travel model assumptions (64% of units vs. 42% of households)
• Juab County and Tooele County receive less greenfield growth in the baseline scenario than transportation plan assumptions.
• Housing demand outpaces household growth in amenity markets such as Wasatch County and Washington County due to new seasonal units.
Planning and Zoning
Assumptions:
• In the Wasatch Front and Wasatch Back, maximum dwelling units per acre (DUA) from local general plans were used to estimate parcel-based planned capacity. Planned capacity was then compared to the baseline distribution scenario. Vacant and redevelopment land area is constant between the planned capacity estimate and the baseline scenario.
• Maximum DUA represents a high estimate of planned densities and may not fully represent the impacts of additional regulations such as setback and parking requirements.
• Current zoning may be significantly more restrictive than future planned land uses from general plans. This analysis assumes that planned land uses are translated to zoning and other regulations with fidelity.
• Redevelopment rates in the land-and-marketconstrained scenario are uniform across transit-adjacent and infill markets. Higher redevelopment rates are not applied to transitadjacent areas or designated Wasatch Choice Centers.
• In Cache, Morgan, Iron, and Washington Counties, the baseline scenario was compared to generalized zoning trends or supplemental studies.
• In certain submarkets, local plans seek to align land use planning with water availability. In other words, cities plan for the number of units that can be supported by estimates of water supply, making planned capacity a loose proxy for water capacity. Water use per unit is a critical assumption for this type of planning.
Data sources: Wasatch Front Regional Council, Mountainland Association of Governments, Envision Utah, National Zoning Atlas
Observations:
• Planned densities meet or exceed baseline densities in transit-adjacent markets.
• Most urban infill markets accommodate 20%-40% fewer units than projected demand.
• The baseline scenario distributes primarily multifamily and attached units to urban infill markets, while future plans still hold some
space for single family detached homes.
• Infill areas in certain markets are planning for densities that meet or exceed baseline densities. These include West Weber County, North Davis County, Northwest Utah County, and Southeast Utah County.
• Infill multifamily and single family attached densities in NE + SE Utah County and SW Salt Lake County are three to four units per acre lower than baseline densities.
• Planned greenfield unit capacities are 5-51% lower than the number of units allocated in the baseline scenario in most Wasatch Front submarkets. This is partially due to surplus demand reallocated from infill and transit-adjacent markets to areas not currently planned for residential uses.
• In the Wasatch Front, most greenfield submarkets are planning for a share of Multifamily and Single Family Attached housing that is in line with market demand, but are planning for lower net densities for these unit types (implied gross densities based on market demand are approximately 13.5 units per acre, while planned densities are as low as 11 units per acre in some submarkets).
• Similarly, market-based single-family gross densities are approximately 3 units per acre, on
average. Average planned densities are as low as 2.1 units per acre in some submarkets.
• The baseline scenario utilizes a higher portion of residential land area for single family attached and multifamily housing than may be zoned in many submarkets outside of the urban Wasatch Front.
• Single family attached housing accounts for 34% of housing demand statewide, representing 15% of residential land area. Single-family attached demand accounts for 31% of all greenfield units statewide.
• Multifamily housing accounts for 15% of housing demand statewide, representing 2.5% of residential land area.
• Demand for housing is high in Western Summit County, where general plans aim to inhibit widespread housing growth in the markets included in the analysis. This pressure may increase housing demand in surrounding Wasatch Back markets.
• The combination of planned capacity and land availability suggests a surplus demand of up to 140,000 units in primary Wasatch Front Markets. This may increase demand for greenfield development in non-urban Wasatch Front “edge counties” and Goshen Valley as well as redevelopment in urban counties.
Water Availability
Assumptions:
• The Utah Housing Capacity Analysis relies on reliable supply and projected demand data from the 2021 State Water Plan, which provides a high-level overview of water availability and use throughout the entire state.
• Water demand from the report was scaled to the baseline distribution scenario based on total housing units at the river basin level.
• The comparison is directional, as our analysis extends to 2055 and is based on housing units, while the 2021 water plan data is for 2050. Each process uses different assumptions to calculate future housing units.
• The analysis also does not differentiate between levels of water use by different dwelling types.
• Whenever possible, defer to more detailed and local water plans, such as those developed by municipalities and water conservation districts for detailed information on water demand and supply. These plans often include housing unit projections, conservation measures, and new water supplies. The data in this analysis is for informational purposes only.
Data sources: UDWRe 2021 State Water Plan, Washington County Water Conservancy District 2023 Regional Water Master Plan, UDWRe Municipal and Industrial Use boundaries, Kem C. Gardner Household Projections
Observations:
• Many of the state’s most populous river basins have enough reliable supply to meet municipal and industrial demand scaled to the LWC scenario only under enhanced water conservation scenarios. Many regions may face water shortages if regional conservation goals are not met. This observation is generally aligned with regional water conservancy district plans.
• In the Virgin River Basin (Washington County Submarket), demand exceeds supply by 12% under even the “conservation” scenario from the state water plan.29
• Water is inextricably linked to other constraints, including the ability to operate sewer collection and treatment systems and serve land-rich, greenfield areas. Therefore, other constraints should be considered within the context of water capacity.
Water Supply vs. Demand by Basin
Sewer Treatment
Assumptions:
• Sewer treatment capacity was utilized as the metric for assessing wastewater treatment capacity, based on availability of data. Therefore, total limitations to a sewer system as a whole (i.e., sewer collection capacity) are not fully captured by this analysis. Treatment capacity from publicly available water treatment plans was aggregated at the submarket or county level to provide a comparison to the units in the baseline distribution scenario.
• Assumes all planned sewer treatment capacity upgrades listed in treatment facility plans will be completed by 2055.
• Residential equivalent residential units, or ERUs, are a reasonable proxy for dwelling units. Non-residential ERUs were omitted from the analysis.
• Where necessary, the number of residential ERUs that contribute to a total facility’s capacity was estimated using a standard multiplier.
Data sources: Publicly available treatment facility planning documents aggregated by Envision Utah, WFRC population estimate data.
Observations:
• Submarkets containing greenfield areas essential to supporting future growth under the baseline distribution model (Eagle Mountain-Saratoga Springs, Springville-Payson, Iron County, and Washington County submarkets) do not have documented planned capacity sufficient to meet future housing demand from the baseline distribution model.
• Developing adequate treatment infrastructure, along with sewer collection infrastructure, to service the projected demand would be expensive and likely time-consuming.
• Urban/infill-oriented submarkets, such as Lehi-Provo, Davis County, and Salt Lake County, appear to have more residential wastewater treatment capacity than demanded in the baseline scenario. This may be partially explained by different redevelopment and growth distribution expectations between the Gardner Institute county control totals and the baseline model.
• Wastewater treatment capacity shortages in submarkets that may have greater reliance on septic systems (e.g., Morgan County), may be overestimated in our analysis.
Fully Constrained Scenario
Assumptions:
• A “fully constrained” scenario based on the most limiting capacity constraint in each market type and submarket was developed to illustrate the potential housing supply impacts if constraints aren’t addressed.
• Only the most-limiting constraint is shown in the table above. The previous sections illustrate where each constraint may limit housing supply individually.
• Achievement of the state water conservation goals for 2055 are assumed in Tooele County and Washington County, where water is the limiting constraint.
• Because the quality and consistency of sewer data was lower than for other variables, it was not incorporated into the fully constrained distribution scenario. Sewer constraints are, however, indicated in the limiting constraint table.
Fully Constrained Scenario
Observations:
• The fully constrained scenario accommodates 235,851 fewer units than identified in structural demand modeling. Under this scenario, in which constraints to the state’s housing supply are treated as fixed variables, Utah’s housing shortage and affordability crisis continue to worsen.
• The difference between Gardner Institute household projections and fully constrained housing unit distribution are most significant in Salt Lake County (81,000), Davis County (50,000), and Washington County (18,000).
• There is a considerable greenfield shortage (roughly 161,000 units) in the Wasatch Front under the fully constrained scenario when compared to the baseline distribution scenario. This is explained by an acceleration of greenfield growth in the baseline scenario and planning/zoning restrictions and transportation planning household expectations in the fully constrained scenario.
Endnotes
1 Kem C. Gardner Policy Institute, State of the State’s Housing Market: 2024–2025 (Salt Lake City: University of Utah, 2025), https://d36oiwf74r1rap.cloudfront.net/wp-content/uploads/2025/07/State-Of-State-Housing-Jul2025.pdf.
2 Includes insurance and taxes. Source: Kem C. Gardner Policy Institute, Utah Housing Market Update, June 25, 2024
3 See Appendix B for additional details.
4 Forecast areas include: Wasatch Front (Salt Lake County, Utah County, Davis County, Weber County, Tooele County, Juab County, Sanpete County); Wasatch Back (Morgan County, Summit County, Wasatch County); and additional forecast areas (Washington County and Iron County [sometimes referred to as Southern Utah], and Cache County and Box Elder County [sometimes referred to as Northern Utah]).
5 Priority seasonal markets are sometimes combined with greenfield markets in the report due to market similarities.
6 Excluded resort markets are excluded from the analysis with the assumption that they will not experience high levels of market rate housing growth for primary residences.
7 Commercial/industrial markets were excluded from the analysis with the assumption that they would not see meaningful transitions to residential uses.
8 Kem C. Gardner Policy Institute, Utah Long-Term Projections: A Baseline Scenario of Population and Employment Change in Utah and Its Counties (Salt Lake City: Kem C. Gardner Policy Institute, January 2022), https://d36oiwf74r1rap.cloudfront.net/ wp-content/uploads/LongTermProj-Jan2022.pdf.
9 National Bureau of Economic Research, “Closing of the American Frontier,” Working Paper, n.d.
10 Utah Geospatial Resource Center, Utah Housing Unit Inventory, Utah GIS Portal, https://gis.utah.gov/products/sgid/planning/ housing-unit-inventory/.
11 Gardner Policy Institute long term demographic projections
12 Utah Foundation, Filling in the Blanks: How Utah Communities Can Confront the Housing Shortage and Promote Affordability, 2022.
13 Based on an approximate vision-informed allocation of 30% of new housing.
14 Utah Foundation, Filling in the Blanks, 2022.
15 Approximate vision-aligned growth allocation of 50 percent of new units.
16 Utah Geospatial Resource Center, Utah Housing Unit Inventory, Utah GIS Portal, https://gis.utah.gov/products/sgid/planning/ housing-unit-inventory/; with market types identified by Envision Utah.
17 Envision Utah, Land Use Strategies to Keep Housing Within Reach, in Attainable Housing Report 2024 (Salt Lake City: Envision Utah, 2024), https://luau.stage.utah.gov/wp-content/uploads/AttainableHousingReport2024.pdf.
18 Approximate vision-aligned growth allocation of 20 percent of new units. Uses a conservative estimate of transit-adjacent market densities.
19 Reid Ewing, Keuntae Kim, and Siqi Zhong, Assessing the S-Line: Economic and Traffic Performance (Salt Lake City: University of Utah, Department of City & Metropolitan Planning, n.d.), https://gardner.utah.edu/wp-content/uploads/Assessing-the-S-Line. pdf.
20 Email correspondence with Mike Winder, Millcreek City Manager and Economic Development Director.
21 Estimate provided by the Wasatch Front Regional Council
22 The Point of the Mountain State Land Authority, The Point (official website), https://thepointutah.org.
23 Envision Utah, Water Values Messaging Guide (Salt Lake City: Envision Utah, 2024), https://drive.google.com/file/d/1GK8OfXEx Jikfje8V2A7WzIz0CkOkSiMu/view.
24 Jordan Valley Water Conservancy District, Conservation Plan, 2024.
25 Utah Division of Water Resources, Regional M&I Water Conservation Goals, 2019.
26 Office of the Great Salt Lake Commissioner, Great Salt Lake Strategic Plan, January 2024.
27 Washington County Water Conservancy District, 20-Year Plan to Secure New Water Supplies for Washington County, Utah, 2023.
28 Ibid.
29 Washington County Water Conservancy District plans indicate a sustainable water supply through at least 2042. Efforts are ongoing to develop additional water supplies or pursue further water conservation to meet regional needs through 2055 and beyond.