The Híspanle Policy Development Project is a non-profit organization which encourages the analysis of public policies and policy proposals affecting Híspanles in the ünlted States.
HPDP directs its efforts in particular to the problems of Híspanle youth: educatlon and employment. Compared to other segments of the Ü.S. populatlon, the Híspanle segment Is young. Thls youthful populatlon Is often Inadequately served by sehools and social servlee agencies, and many Híspanle young people are Insufflclently tralned to compete effectlvely In the job market. To attack these problems, HPDP supports hlgh-level publlc policy commlsslons composed of prestlglous Híspanles and non-Hlspanlcs; conferences, semlnars, and debates on central educatlon and employment Issues; both lay and professlonal analysis and evaluatlon of speclflc policy optlons; and policy analysis competltlons open to Híspanle and non-Hlspanlc scholars as well as Híspanle organlzatlons. HPDP places mejor emphasis on supporting the work of Híspanle or ganlzatlons and Inereaslng thelr aecess to polley making networks.
The communlcatlon of policy data, recommendatlons, and proposals Is a major part of HPDP's program. üslng extensiva contacts among representa tivas of the business and corporate world and among policy makers on both state and natlonal lavéis, HPDP seeks to brlng Its flndlngs to the attentlon of key groups and leaders throughout the Clnlted States. The productlon of publlcatlons llke MEW YORK CITY HISPANICS: WHO VOTES AND HOW Is part of that effort.
HACER Ine. Is a vehlcle for self-lmprovement, open to all Híspanle women regardless of age, edu catlon, or economlc background. HACER Is a condult for further educatlon, opportunlty, and ultlmately self-sufflclency. A non-proflt tax-exempt organization, HACER stands for Híspanle Amerlcan Carear Edueatlonal Resources. Founded In 1975 as a volunteer organization designad to help Híspanle adults obtaln carear opportunltles through college educatlon, HACER Is a stepplng stone to carear, edueatlonal, and economlc advancement. The Board of Dlrectors represents a partnershlp among Individuáis worklng In hlgher educatlon, the prívate sector, and the communlty at larga. HACER Is located In New York Clty's garment dlstrlct, where many Híspanles are employed.
In 1979, the Híspanle Women's Canter was formed under HACER's umbrella, and Its key objectlve Is to help Híspanle women achleve non-tradltlonal posltlons In management and the technlcal sclences.
Through flnanclal support from foundatlons and government agencies, the Center provldes a varlety of job-tralnlng and sklll-enhancement demonstratlon programs. Wlth the asslstance of business entltles, It also provldes educatlon and carear Informatlon servlces: carear counsellng, employment referrals, peer group experlence exchanges, and networklng.
HACER and the Híspanle Policy Development Project acknowledge wlth gratltude the generous asslstance of the Southwest Votar Reglstratlon Educatlon Project In the deslgn and execution of thls exlt poli, the analysis of the data obtalned, and the productlon of thls report.
and
Final Report: Híspanle Fxlt Poli Presldentlal Eleetlon IVoTember 6,1984
Preface
arly ¡n the summer of 1984,staff and board members of HACER/National Hispanic Women's Can ter began to consider conducting an election day exit poli in New York City's predomlnantly Hispanic neighborhoods. At the Canter, we had sean Hispanic women and man debata the many national issuas. Wa knaw our community was concarnad about war and paaca, imnnigration laws, tha situation in Central América,tha Equal Rights Amandmant,and a host of othar mattars which hava an impact on all of us. In addition, wa wara afraid that tha Media Natwork's Exit Poli would includa in its national sampla only a handful of Híspanles, and that thair findings, as an axarcisa in undarstanding tha political and social attitudas of tha Hispanic groups living in tha ünitad Statas, would be maaninglass.
Wa faarad, too, that no ona would parcaiva diffarancas that might axist in tha voting bahavior of Hispanic malas and famalas. Wa wara afraid that policy makars and alactad officials, with no availabla data, would continua to taka our community for grantad.
Friands and collaborators ancouragad us, and many pladgad to work with us on tha projact. Angelo Falcon, Exacutiva Director of tha Instituta for Puerto Rican Policy, Inc., agraad to do tha sampla. Manual Gomaz and Dagmaris Cabezas, who wara working on exit polis in Miami, Naw Jersey,and northarn Manhattan, bacama an integral part of our affort in Naw York City. Studants, profassionals, friands and HACER's Natwork and Board of Diractors wara racruitad as voluntaer intarviawars. Guillermo Linares, of tha Asociación Comunal da Dominicanos Progresistas, and Luis Garden, of El Puente, helped us in finding additional intarviawers.
Luz Towns-Miranda, Assistant Director for Programs and Training at CORO Foundation, racruitad Hispanic woman to work with us and halpad coor dínate tha distribution and collaction of quastionnairas on alaction day. Héctor Pinero, Chairparson of tha Naw York Hispanic Housing Coalition, and Xavier Rodríguez, who chairs tha Bathgata Industrial Park Advisory Council, providad voluntaars in tha Bronx. Tha Southwast Votar Ragistration Education Projact
agreed to draft the questions, print our questionnaires, train our volunteers, enter and analyze the data, and próvida us with all the pencils, clipboards, and other mataríais necessary to conduct the poli. Finally, Mr. Colín Greer, Vice Presldent of the New World Foundatlon, agreed to glve us seed money to cover other expenses assoclated wlth our exlt poli.
The project grew,and we became part ofa natlonal effort,spearheaded by the Southwest Votar Reglstratlon Educatlon Project, to learn Híspanle presldentlal preferences, soclo-economlc characterlstlcs, and soclo-polltlcal attltudes. Luis A. Miranda,CoChalr of HACER's Board of Dlrectors, became the New York Clty Coordlnator, and together wlth Dr. Norma Stanton, Executlve Director of HACER, and Charlssa Collazo, HACER's Executlve Program Offlcer, organizad the New York Clty Híspanle Exlt Poli. Josa Pagan, HACER's computar wlz,designad and executed the computar program. Isabel Larraurl, HACER's Executlve Secretary, worked day and nlght so that we could all read the final versión of the prellmlnary analysls. HACER's staff, as always, demonstrated Its dedlcatlon through hard work, and the Híspanle Pollcy Development Project revlewed, editad, and publlshed the final report.
To all of you who worked so hard on thls project, we express our sincere gratltude. Electlon day was cold and wlndy, but weather dld not stop 100 commltted Individuáis from Intervlewlng 2,096 New York Clty voters,of whom 1,502 were Híspanles,In the flrst New York Clty Híspanle Exlt Poli. Our flndlngs are presentad In thls report. Our data Is avallable to all of you who are concerned wlth the development of a strong and solld Híspanle communlty In New York Clty. 1 Adelante Hispanos!
Siempre,
Norma
Stanton
Luis
A. Miranda
Patricia V. Asip Executlve Director Co-Chair Co-Chair
Executive Summary
Fifteen hundred Hispanics, interviewed as they left polling places In Mew York Clty's Híspanle neighborhoods on election day in Movember 1984, displayed remarkable unanlmlty despite differences in ethnic origin. New York Hispanic subgroups—Puerto Ricans, Cubans, Dominicans—did not differ greatly In their views on most national and foreign policy issues.
On foreign policy issues—contrary to the common perception—Hispanic opinions mirrored those of the larger society. On the other hand, Hispanic views on domestic issues which directly affect their well being, such as bilingual education and reductions in federal spending for social services, differed considerably from the views of the general public.
In light of the popular stereotype of a "macho" Hispanic society, the most startling finding was the fact that Hispanics, men and women alike, overwhelmingly supported the Equal Rights Amendment.
Substantial differences did emerge on some topics, mainly presidential preferences and political party affiliations. While about one in four Puerto Ricans and two in five Dominicans preferred President Reagan, almost two-thirds of the Cubans supported the Presi dent, and the vote for president produced the largest difference in opinión between males and females. More than one in four Hispanic women (28 percent) preferred th^President, while two in five males did; the gender gap in the larger society was also evident among Hispanics.
On the other hand, questions about mayoral candidate preferences revealed no gender gap at the time the poli was taken. Almost half the sample—both Hispanic females (48 percent) and males (49 percent)—preferred Mayor Koch over other candidates. The subgroups, however, showed more dif ferences; Puerto Ricans favored Koch by 42 percent, Dominicans by 52 percent, and Cubans by 61 percent. New York City's September 5, 1985, Democratic
mayoral primary corroborated this early poli: Hispanics in every district overwhelmingly supported the reelection of Mayor Koch.
Another area of difference among the Hispanic sub groups was the matter of military aid to Central América. While half the Cubans favored more military aid to the government of El Salvador, less than a third of the Puerto Ricans and the Dominicans supported this position. Likewise, well over half the Puerto Ricans (56 percent)and the Dominicans(61 percent)opposed more military aid to the Contras in Nicaragua, while only a third (34 percent) of the Cubans opposed such aid. Said the other way, half the Cubans favored such aid, compared to only about 20 percent of the Puerto Ricans and the Dominicans.
On other issues, Hispanics closed ranks, although some differences in degree of emphasis remain. For example, about three quarters of the Puerto Ricans and well over three quarters of the Cubans and Dominicans want amnesty for undocumented immigrants—illegal aliens—in the ÍJnited States. Likewise, over half the sample(68 percent for Dominicans)opposed sanctions against employers who hire undocumented immi grants.
Over two-thirds of the sample supported a verifiable freeze on nuclear weapons. Well over half those polled favored talks between the ünited States and Cuba; for Cubans and Dominicans, the figure was about 70 percent. Although views are similar across the three ethnic groups, cióse to a parallel split occurred on the question of normalization of relations between Cuba and the ünited States. About 43 percent of the sample favored normalization while about 37 percent opposed it and 20 percent were not sure. Cubans were clearer about their positions on this issue: 54 percent favored it, 38 percent opposed it, and only 8 percent were not sure.
With the exception of two issues, a solidarity on
most domestic issues also prevailed. In regard to the economic program of the current Administration, a nearly even split between those who favored and those who opposed was found among the Puerto Ricans, 38 percent to 39 percent, and the Dominicans,40 percent to 40 percent, while 54 percent of the Cubans favored the program. On the other issue, Ü.S. spending for defense, 34 percent of the Dominicans, 46 percent of the Puerto Ricans, and 54 percent of the Cubans favored increased money for defense.
in addition to the difference in their votes for the President, the only other substantial difference be tween females and males was the Reagan economic program; 41 percent of the females and 53 percent of the males approved of the President's approach.
The near unanimity of the Hispanic groups on other domestic issues is impressive. Almost three-fourths of the entire sample opposed cutting social programs to reduce the federal déficit. Increased spending on bilingual programs drew the highest level of support for any program on which the voters were polled: 90 percent of the sample approved while only 6 percent op posed. About 80 percent of the sample favored the Equal Rights Amendment and only 8 percent opposed it. This high level of support for ERA included the sample's males, who favored it by 76 percent.
Despite the similarity of the Hispanic position on many issues, the background characteristics of the
sample by both ethnic origin and gender are dissim ilar. In education, 48 percent of the Puerto Ricans had less than a high school education, while 40 percent of the Dominicans and 32 percent of the Cubans had less than a high school education. In regard to age,64 percent of the Puerto Ricans and 71 percent of the Dominicans were 45 or younger, while 56 percent of the Cubans were 46 or older. As for income levels, 64 percent of the Puerto Ricans and 49 percent of the Dominicans earned under $10,000 a year, while only 29 percent of the Cubans did so.
Income differences for males and females were substantial. While the incomes of 44 percent of the females were less than $5,000, only 25 percent of the males had such low incomes. On the other hand,the in comes of 19 percent of the females ranged from $10,000 to $20,000, but 35 percent of the males fell in that bracket. These striking income level differences between males and females is related in part to their employment status. Over half of all males, 57 percent, were employed, while employment among females reached only 32 percent.
As for the sample itself, almost three-fourths of the respondents(73 percent)were Puerto Ricans, 14 percent were Dominicans, 5 percent were Cubans, and 8 percent were other Hispanics. As in the larger Hispanic community, Hispanic women outnumbered men by a margin of 3 to 2 among the 1,502 interviewed.
Hispanic New Yorkers constitute the second largest minority group in the city, and their impact is seen in many facets of city Ufe, Including the arts, the civil rights movement, their growing share of the economic market, and the politicai process. Hew York's Hispanics also are an integral part of a nationwide community now estimated to include 18 million in dividuáis.
Although Hispanic voters are a relatively small proportion of the national electorate—5 percent—they are concentrated in nine key states which collectively control 193 electoral votes, 71 percent of the 270 votes needed to win the presidency. In New York State, for example, the Hispanic voting age population contains more than a million people. Puerto Ricans are the largest Hispanic group in Mew York City, constituting 56.7 percent of all Hispanic New Yorkers.
Little is known about the socio-political make-up of Hispanics. Some observers argüe that Hispanics are conservative with respect to family issues, economic policies, and national defense, and insist that the Republican Party is gaining strength among Hispanics. Historically, New York's Hispanic communities have supported Democratic candidatos, and—given the fact that over 500,000 Hispanics presently are registered to vote in the state of New York—it is evident that Hispanics represent a politicai forcé which cannot be ignored by any politicai party.
If little is known about their overall socio-political profile, even less is known about attitudinal differences between Hispanic males and females. We found such differences to be minimal, with only one exception—voting for the presidential candidatos. A common perception seos Hispanic males as "macho," and Hispanic females as "followers" who accept malo dominance; such an argument must conclude that the Hispanic household's politicai behavior is determinad by the male head of family. But a growing number of Hispanic females are single heads of family. The Ü.S. Census Bureau tells us that, nationwide,almost 25 percent of all Hispanic families are headed by single females. And for Puerto Rican families, the figure is about 45 percent.
Hispanic males and females both attend community and civic functions, and recent studies have found diminishing degrees of sex-role traditionalism among Hispanic females.
This exit poli represents a first attempt to construct a socio-political profile of Hispanic New Yorkers. For, without question, the Hispanic mosaic, composed not
only of Puerto Rican males and females, but of Dominicans, Cubans, and Central and South Americans, contains much common experience. HACER/National Hispanic Women's Center helps build a strong and stable community by nurturing these commonalities, at the same time recognizing and respecting the dif ferences which do exist.
The iSample:
Twenty-three polling places throughout the city of New York were selected; in those neighborhoods, 50 percent or more of those registered to vote were His panics. Table 1 presents a summary of polling places surveyed:
Table 1 Assembly Districts and Communities in which Exit Poli Was Condncted
Borough Assembly Districts Communities
Bronx 73, 74, 77
Brooklyn
Manhattan
50, 51, 53
62,68, 71, 72
Queens 35
Hunts Point, Mott Haven, East Tremont, Fordham, Soundview
Sunset Park, Williamsburg, Bushwick
Lower East Side, East Harlem, Washington Heights Corona, East Elmhurst
A total of 2,096 individuáis were interviewed, of whom 72 percent were Hispanics. Since interviews were conducted at random,as voters left their polling places, a sizable number of nonHispanics was interviewed, but this report deals exclusively with Hispanic voters. Table 2 presents the numbers of Hispanics interviewed in each borough. For example, 77 percent of those interviewed in the Bronx were Hispanics: 66 percent of those interviewed in Manhattan were Hispanics.
Table 2
nfon-Hispanics aud Hispanies
Interviewed in Eacli Borougli
Table 3
Hispanic women were interviewed more often than males in every borough. Citywide, they constituted 59 percent of the total number of those interviewed.(See Table 3.) The male/female differentlal among Híspanles interviewed was greatest in the Bronx, where 60 percent of those interviewed were women and 40 percent were men. The differentlal was smallest in Queens, where 54 percent of those interviewed were women and 46 percent were men.
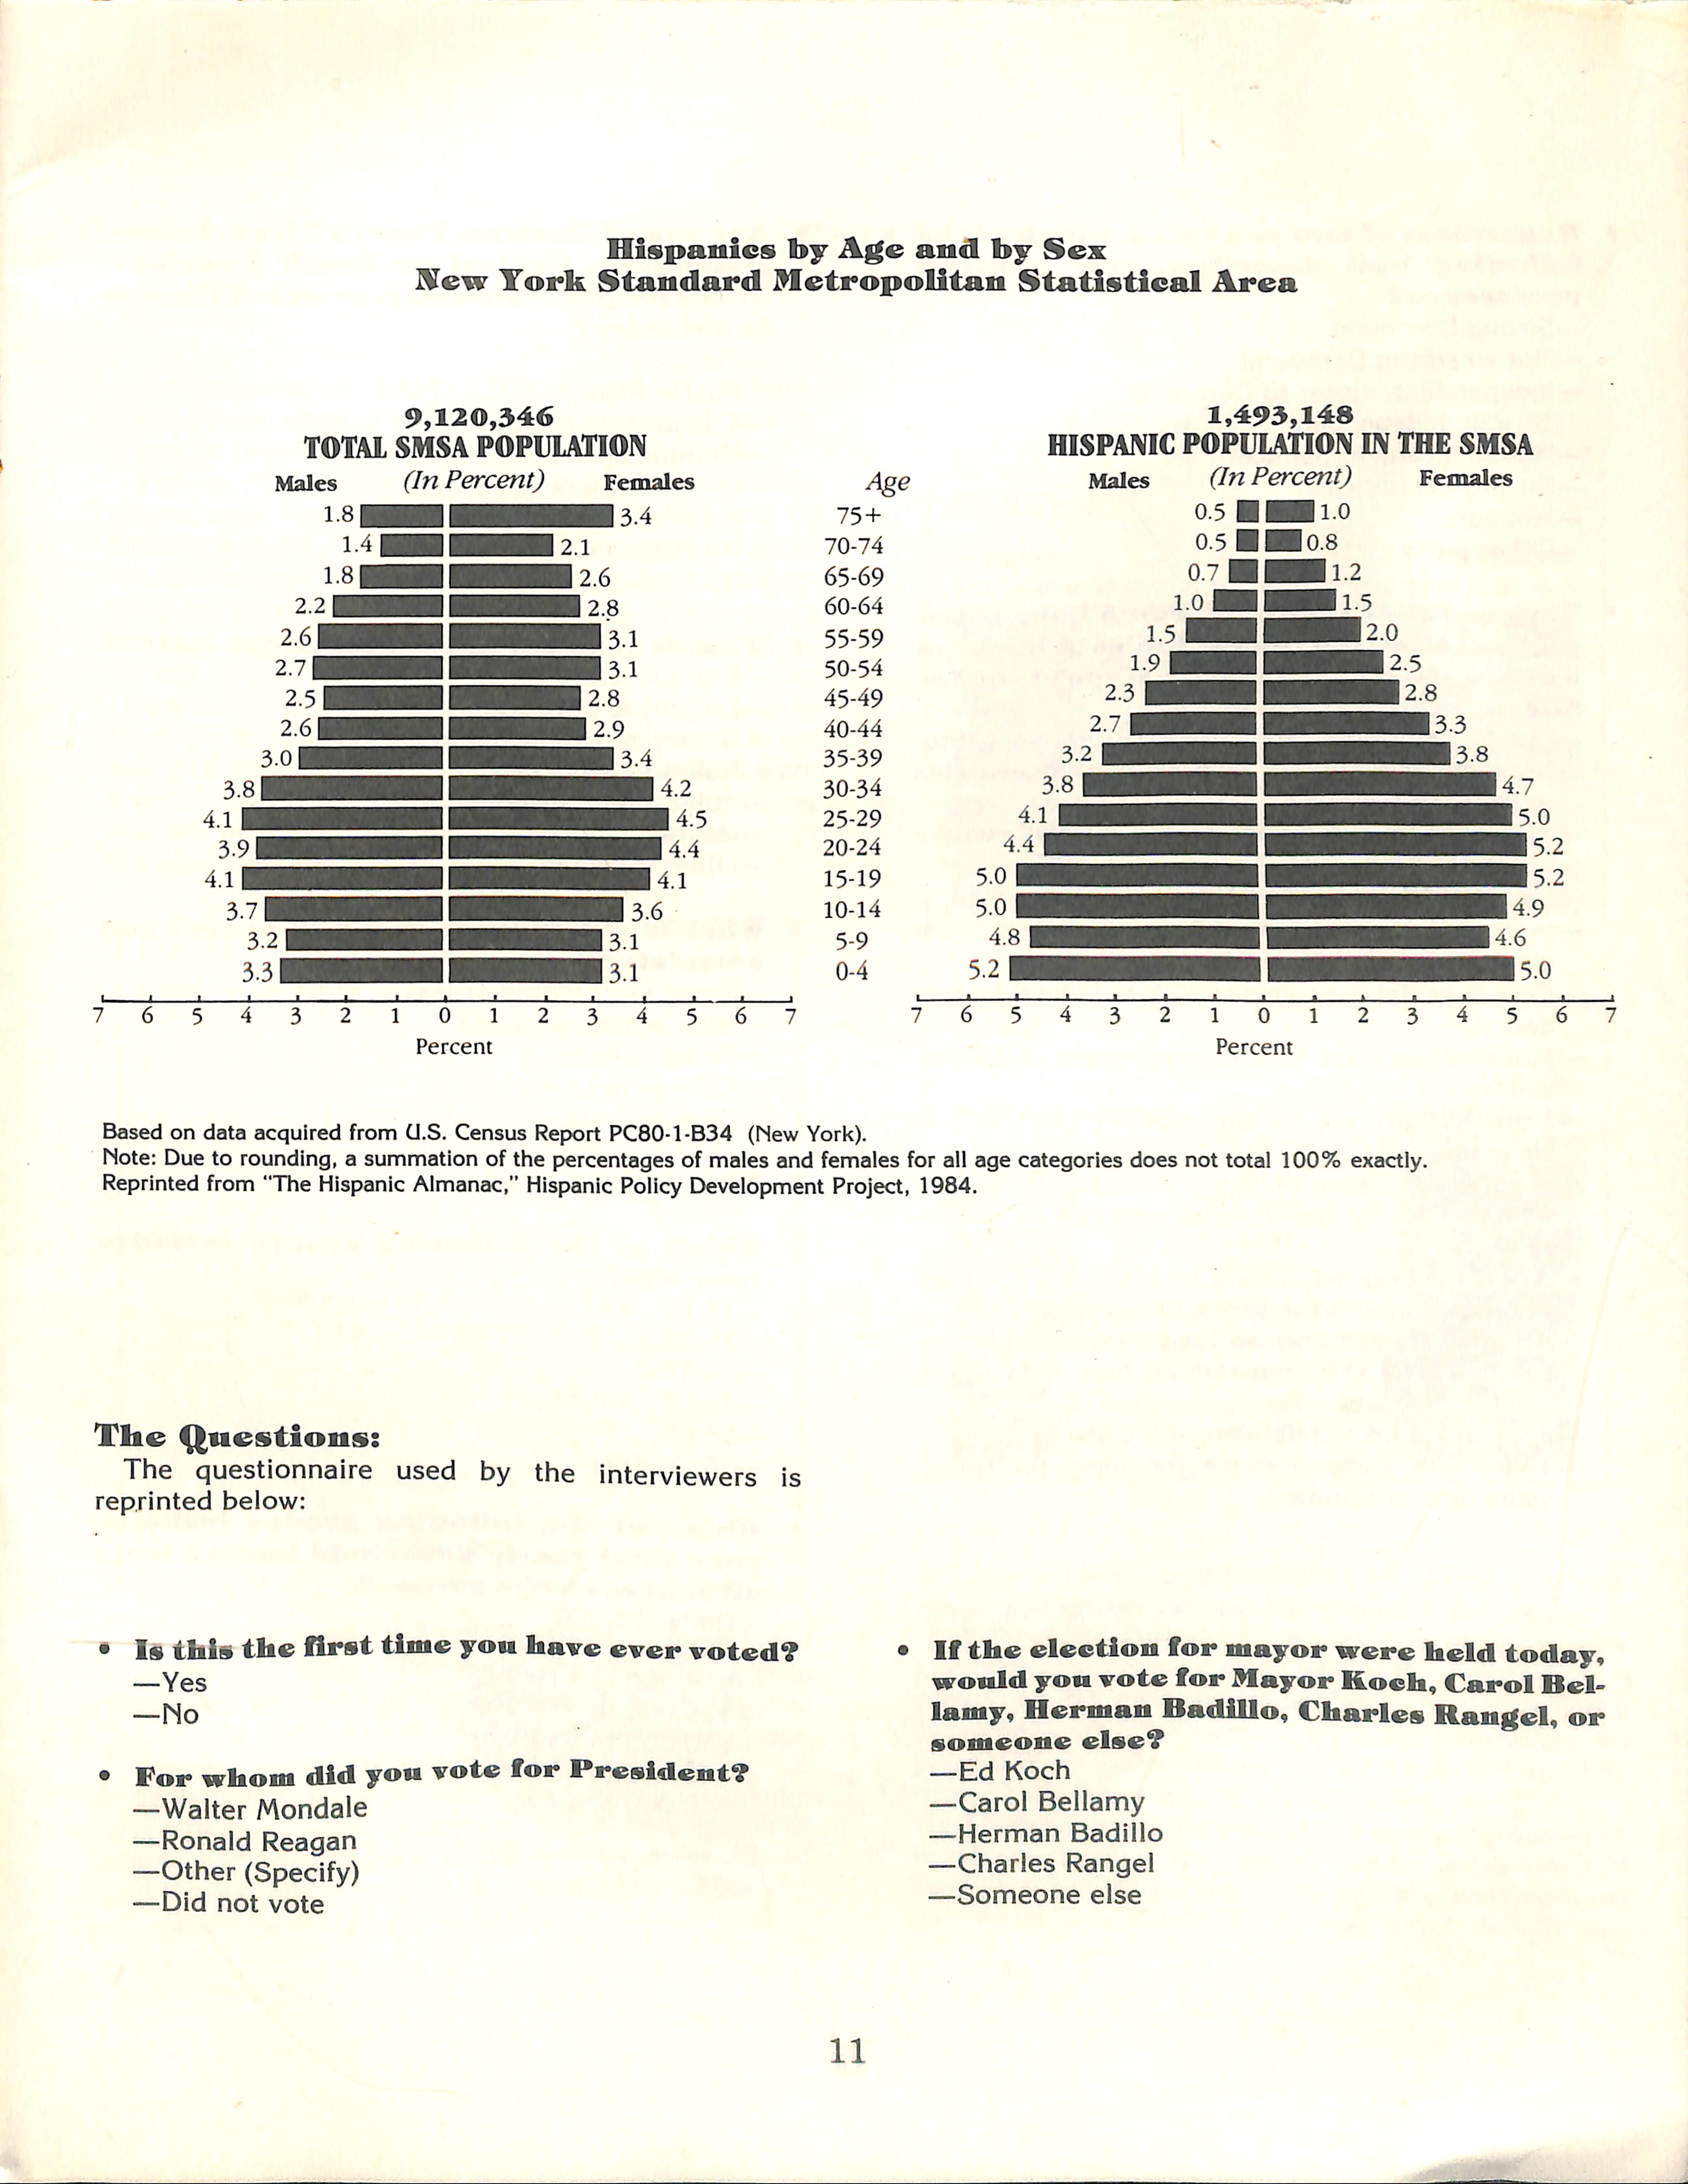
Here it must be noted, however, that in the overall Mew York Hispanic population, after the age of 14 Hispanic females outnumber Hispanic males in every age category, especially in the younger adult categories.
The iilustration below deais with male and female Híspanles in the larger New York Standard Metropolitan Statistical Area instead of Mew York City, but it graphicaliy demonstrates the fact that females are more numerous than males in Hispanic communities.
9,120,346
Males (In Percent) Pernales
1,493,148
Based on data acquired from (J.S. Census Report PC80-1-B34 (New York).
Note: Due to rounding, a summation of the percentages of males and females for all age categories does not total 100% exactly. Reprinted from "The Híspanle Almanac," Híspanle Polley Development Projeet, 1984.
The Questions:
The questionnaire used by the interviewers is reprinted below:
• Is thls the Brst tbme yon have ever voted?
—Yes
—No
• For whom dld yoa vote for President?
—Walter Móndale
—Ronald Reagan
—Other (Specify)
—Did not vote
If the electioM for mayor were held today, wonld yoM vote for Mayor Koeh,Carol Bellamy,Hermán Badillo, Charles Rangel,or someone else?
—Ed Koch
—Caro! Bellamy
—Hermán Badillo
—Charles Rangel
—Someone else
*
Regardless of how yon voted,which ofthe following best descñbes your political preference?
—Strong Democrat
—Mot so strong Democrat
—Independent, closer to Democrat
— Strictly Independent
—Not so strong Republican
—Strong Republican
—Mot sure
—Other party
Suppose tbat today yon could have voted on the following issnes. Indieate how yon wonld Tote on eaeh(Pavor,Oppose,or Kot
Sure):
—The Equal Rlghts Amendment(ERA), a constltutionai amendment to give women equal rlghts under law.
—The economic program of the current AdmlnIstration.
—Increased defense spendlng.
—Increased spendlng on blllngual programs for children In publlc schools.
—Cuts In social programs to reduce federal budget déficit.
—More military aid to the government in El Sal vador.
—More military aid to the rebels ("Contras") in Nicaragua.
—A verifiable freeze on the production of nuclear weapons if the Soviet (Jnion agrees to do the •same.
—A law making it unlawful to hire an immigrant who has come to the (J.S. without papers.
—An amnesty program so illegal immigrants presently in the (J.S. can remain here legally and work if they wish.
—Normalization of reiations with Cuba.
—Talks with Cuba about agreements for travel, visits, and emigration.
* Are yon of IVexican,Puerto Rican,Cuban, Dominican, Central or South Ameriean, other Hispanic aneestry,or not of Híspan le aneestry?
—Mexican
—Puerto Rican
—Cuban
—Dominican
—Other Hispanic(Specify)
—No Hispanic aneestry, White
—No Hispanic aneestry, Black
—No Hispanic aneestry. Asían
What Is your eurrent employment status?
—Employed full time
—Employed part time
—(Jnemployed, looking for a job
—Full-time student
—Full-time homemaker
—Retired
—Other(Specify)
What Is the hlghest grade in sehool you eompleted?
—Some high sehool or less
—High sehool gradúate
—Some college
—College gradúate
—Postgraduate
• What Is your sex?
Vfhleh of the following gronps includes your age?
-18-25
-26-35
-36-45
-46-55
-56-65
—66 or oider
Hhleh of the following groups ineludes your total yearly household Income from aU sourees before taxes?
—ünder $5,000
—$5,000 to $9,999
—$10,000 to $19,999
—$20,000 to $29,999
—$30,000 to $39,999
—$40,000 to $49,999
—$50,000 and over
Pfn*t I
Hispauie Voters in JXTew York City
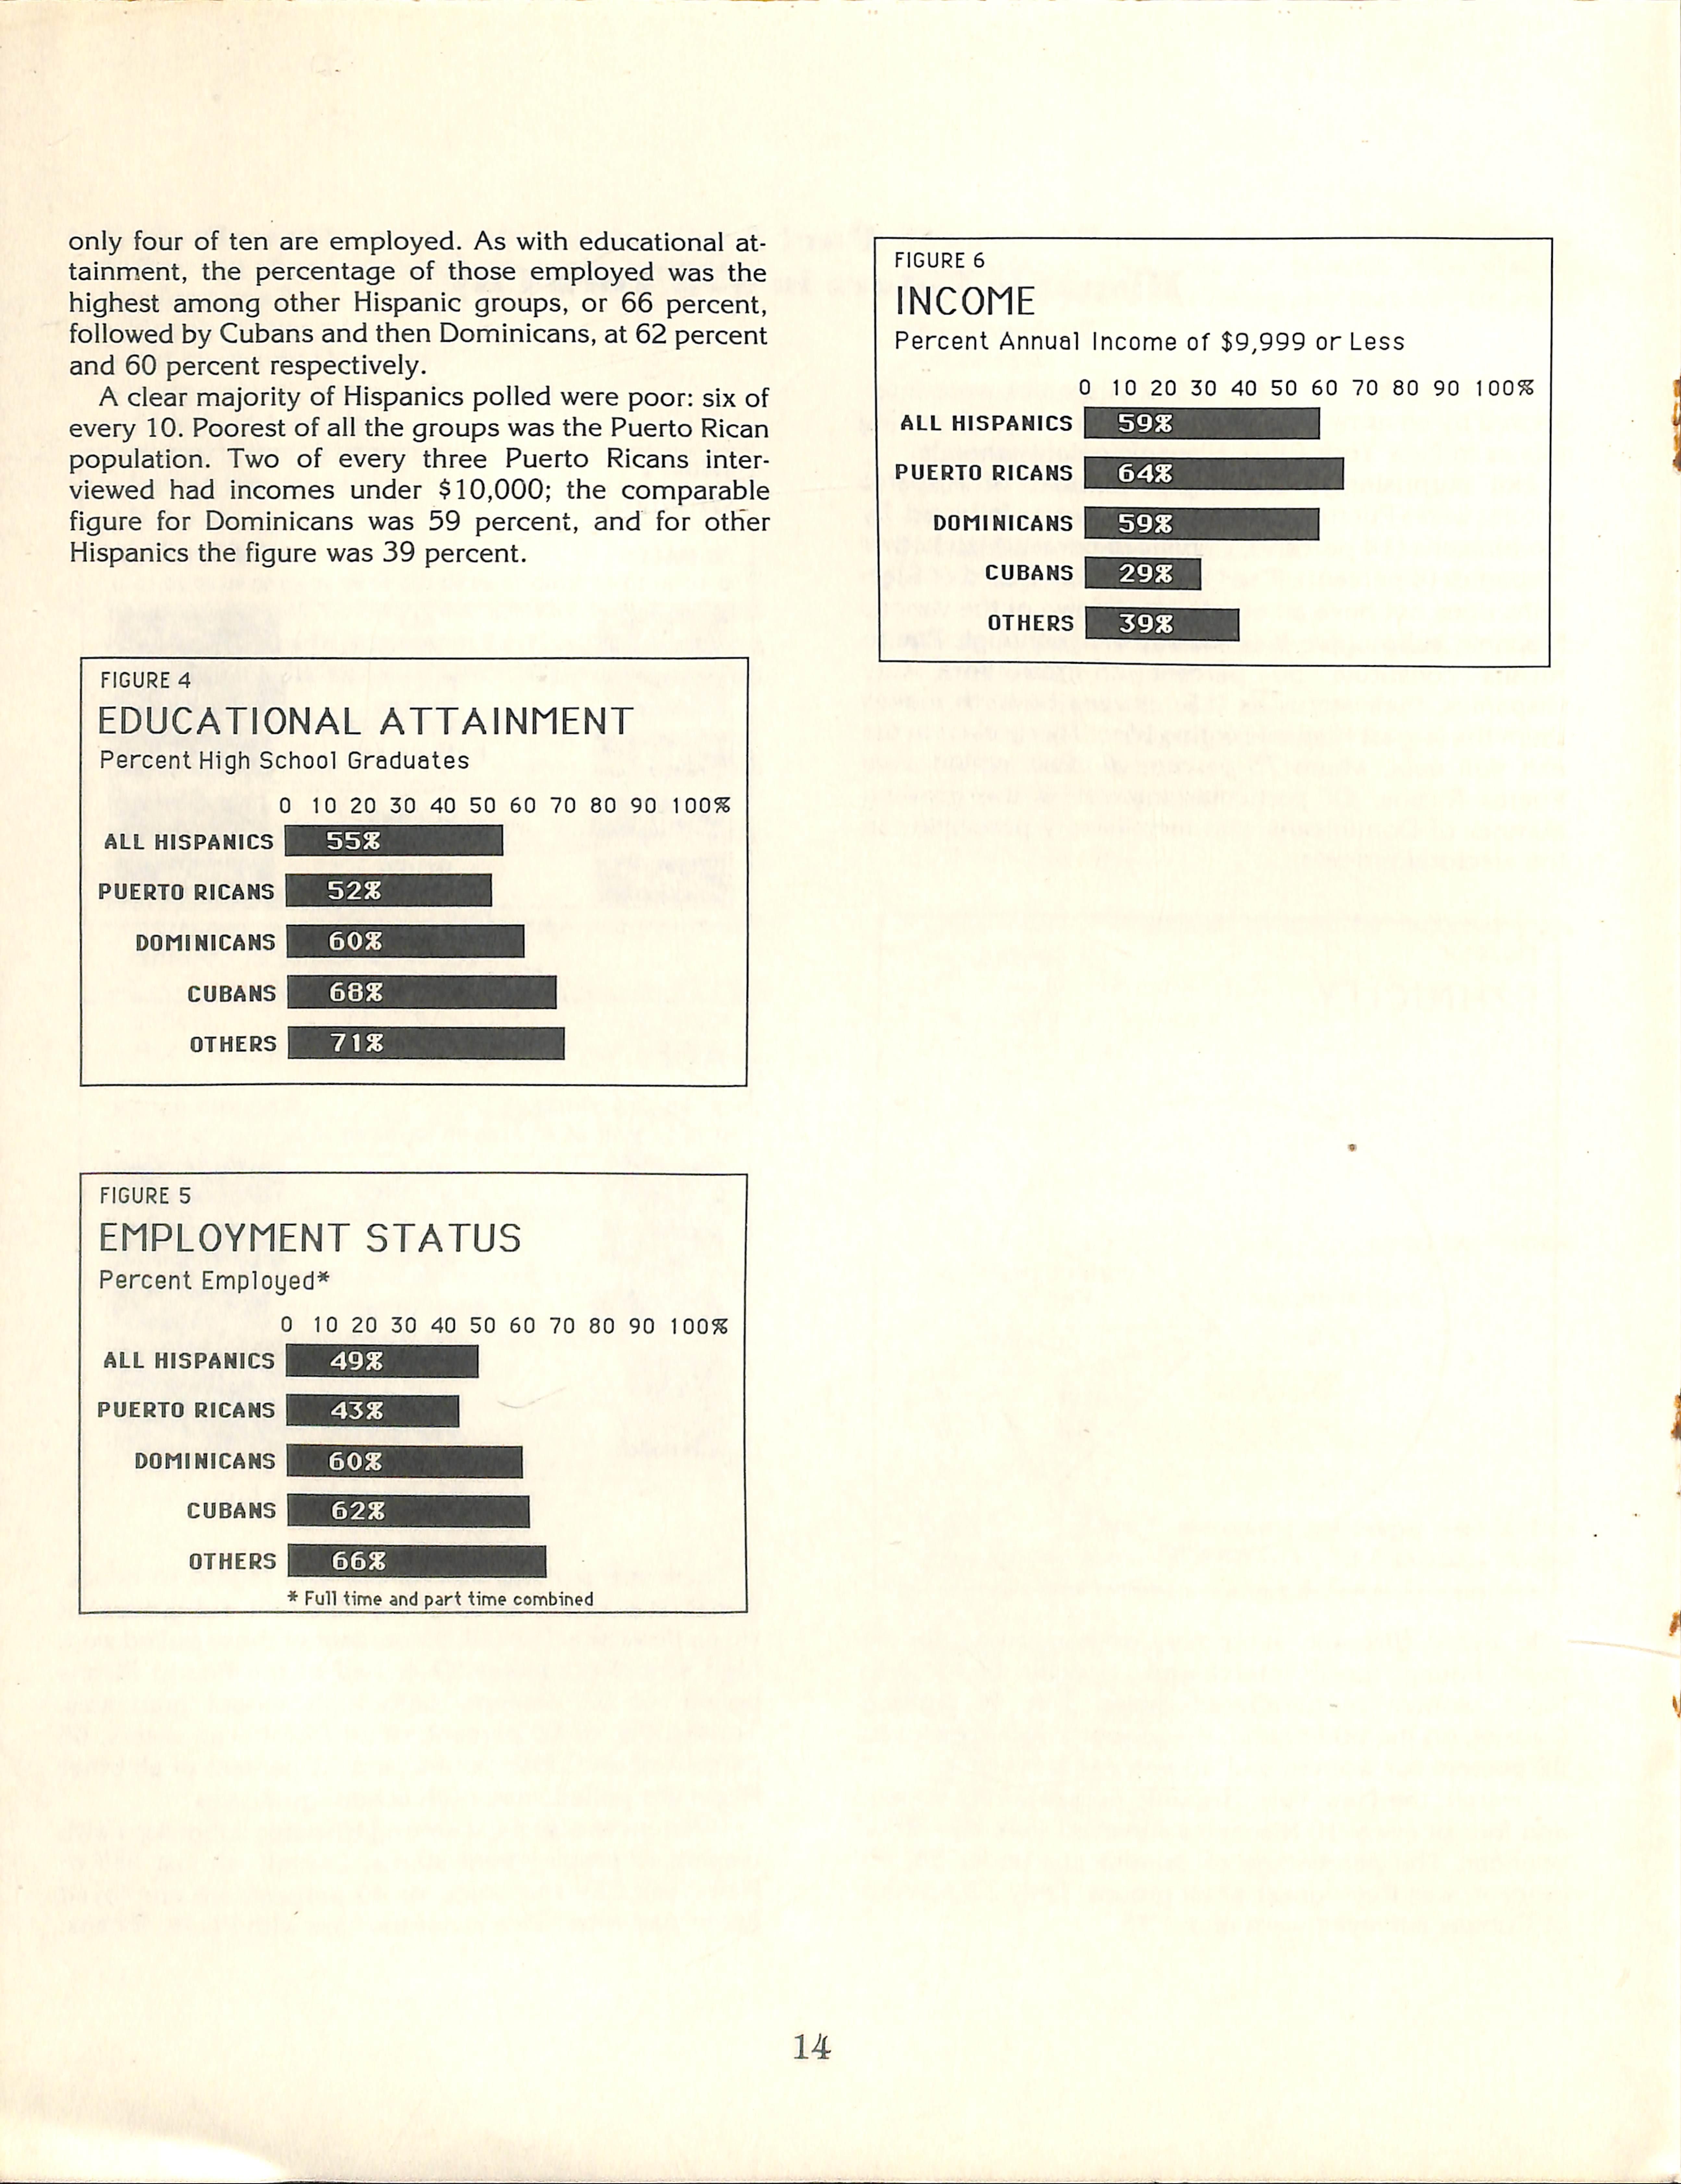
On Movember 6, 1984, 1,502 Hispanics were interviewed by an army of 100 volunteers as they left polling places In Mew York City's Híspanle neighborhoods.
Not surprisingly, the largest number of Híspanle voters were Puerto Rleans (73 pereent), followed by Domlnleans(14 pereent), Cubans(5 pereent), and other Híspanles(8 pereent). The Mew York Clty Board of Eleetlons does not have an ethnle breakdown of the varlous Híspanle subgroups. It Is known that although Puerto Rleans eonstltute 50 pereent of Mew York Clty Híspanles, thelr status as Ü.S. eltlzens by blrth makes them the largest Híspanle votlng bloe. Thls Is elear In the exlt poli data, where 73 pereent of those polled were Puerto Rleans. Of particular Interest Is the growlng number of Domlnleans who Inereaslngly particípate In the electoral proeess.
FIGURE ETHNICITY
DOrilNICANSt PUERTO RICANS / 14X I 73X ^ CUBANS 1
In every Híspanle subgroup, women outnumbered men among those Intervlewed. Speelfleally, Puerto Rlean women outnumbered males 3 to 2. Among Cubans,on the other hand,the proportlons were eloser: 52 pereent for women and 48 pereent for men. Overall, the Mew York Híspanle populatlon Is young, and four of every 10 Híspanles surveyed were age 35 or younger. The pereentage of Domlnleans under 35, 45 pereent, was the hlghest of all groups. Only 32 pereent of Cubans surveyed were under 35.
FIGURE 2
GENDER
FIGURE 3
AGE
PUERTO RICANS
NS
CUBANS
OTHER HISPANICS
PUERTO RICANS
CUBANS
OTHERS
There are strlklng dlfferenees with regard to edueatlonal attalnment among the dlfferent subgroups of Híspanle voters. Overall,55 pereent of those polled were hlgh sehool graduates. Over half of the Puerto Rleans polled, or 52 pereent, were hlgh sehool graduates. Three-flfths, or 60 pereent, of all Dominlean voters, 68 pereent of all Cuban voters, and 71 pereent of all other Híspanles polled were hlgh sehool graduates. Dlfferenees also exlst among Híspanle subgroups with respeet to employment status. Overall, almost half of Mew York Clty Híspanles, or 49 pereent, are employed full or part time. Thls ¡s not the case with Puerto Rleans;
only four of ten are employed. As with educational attainment, the percentage of those employed was the highest among other Híspanle groups, or 66 percent, foliowed by Cubans and then Domlnlcans,at 62 percent and 60 percent respectlvely.
A clear majorlty of Híspanles polled were poor: slx of every 10. Poorest of all the groups was the Puerto Rlcan populatlon. Two of every three Puerto Rlcans Intervlewed had Incomes under $10,000; the comparable figure for Domlnlcans was 59 percent, and for other Híspanles the figure was 39 percent.
4
EDUCATIONAL ATTAINMENT
Percent High School Graduates
FIGURE 5
EMPLOYMENT STATUS
Percent Employed*
FIGURE 5
INCOME
Percent Annual Income of $9,999 or Less o 10 20 30 40 50 60 70 80 90 100%
ALL HISPANICS
PUERTO RICANS
DOtlINICANS
CUBANS
OTHERS
FIGURE
Part II Dtlmic Groups
Puerto Ricaus
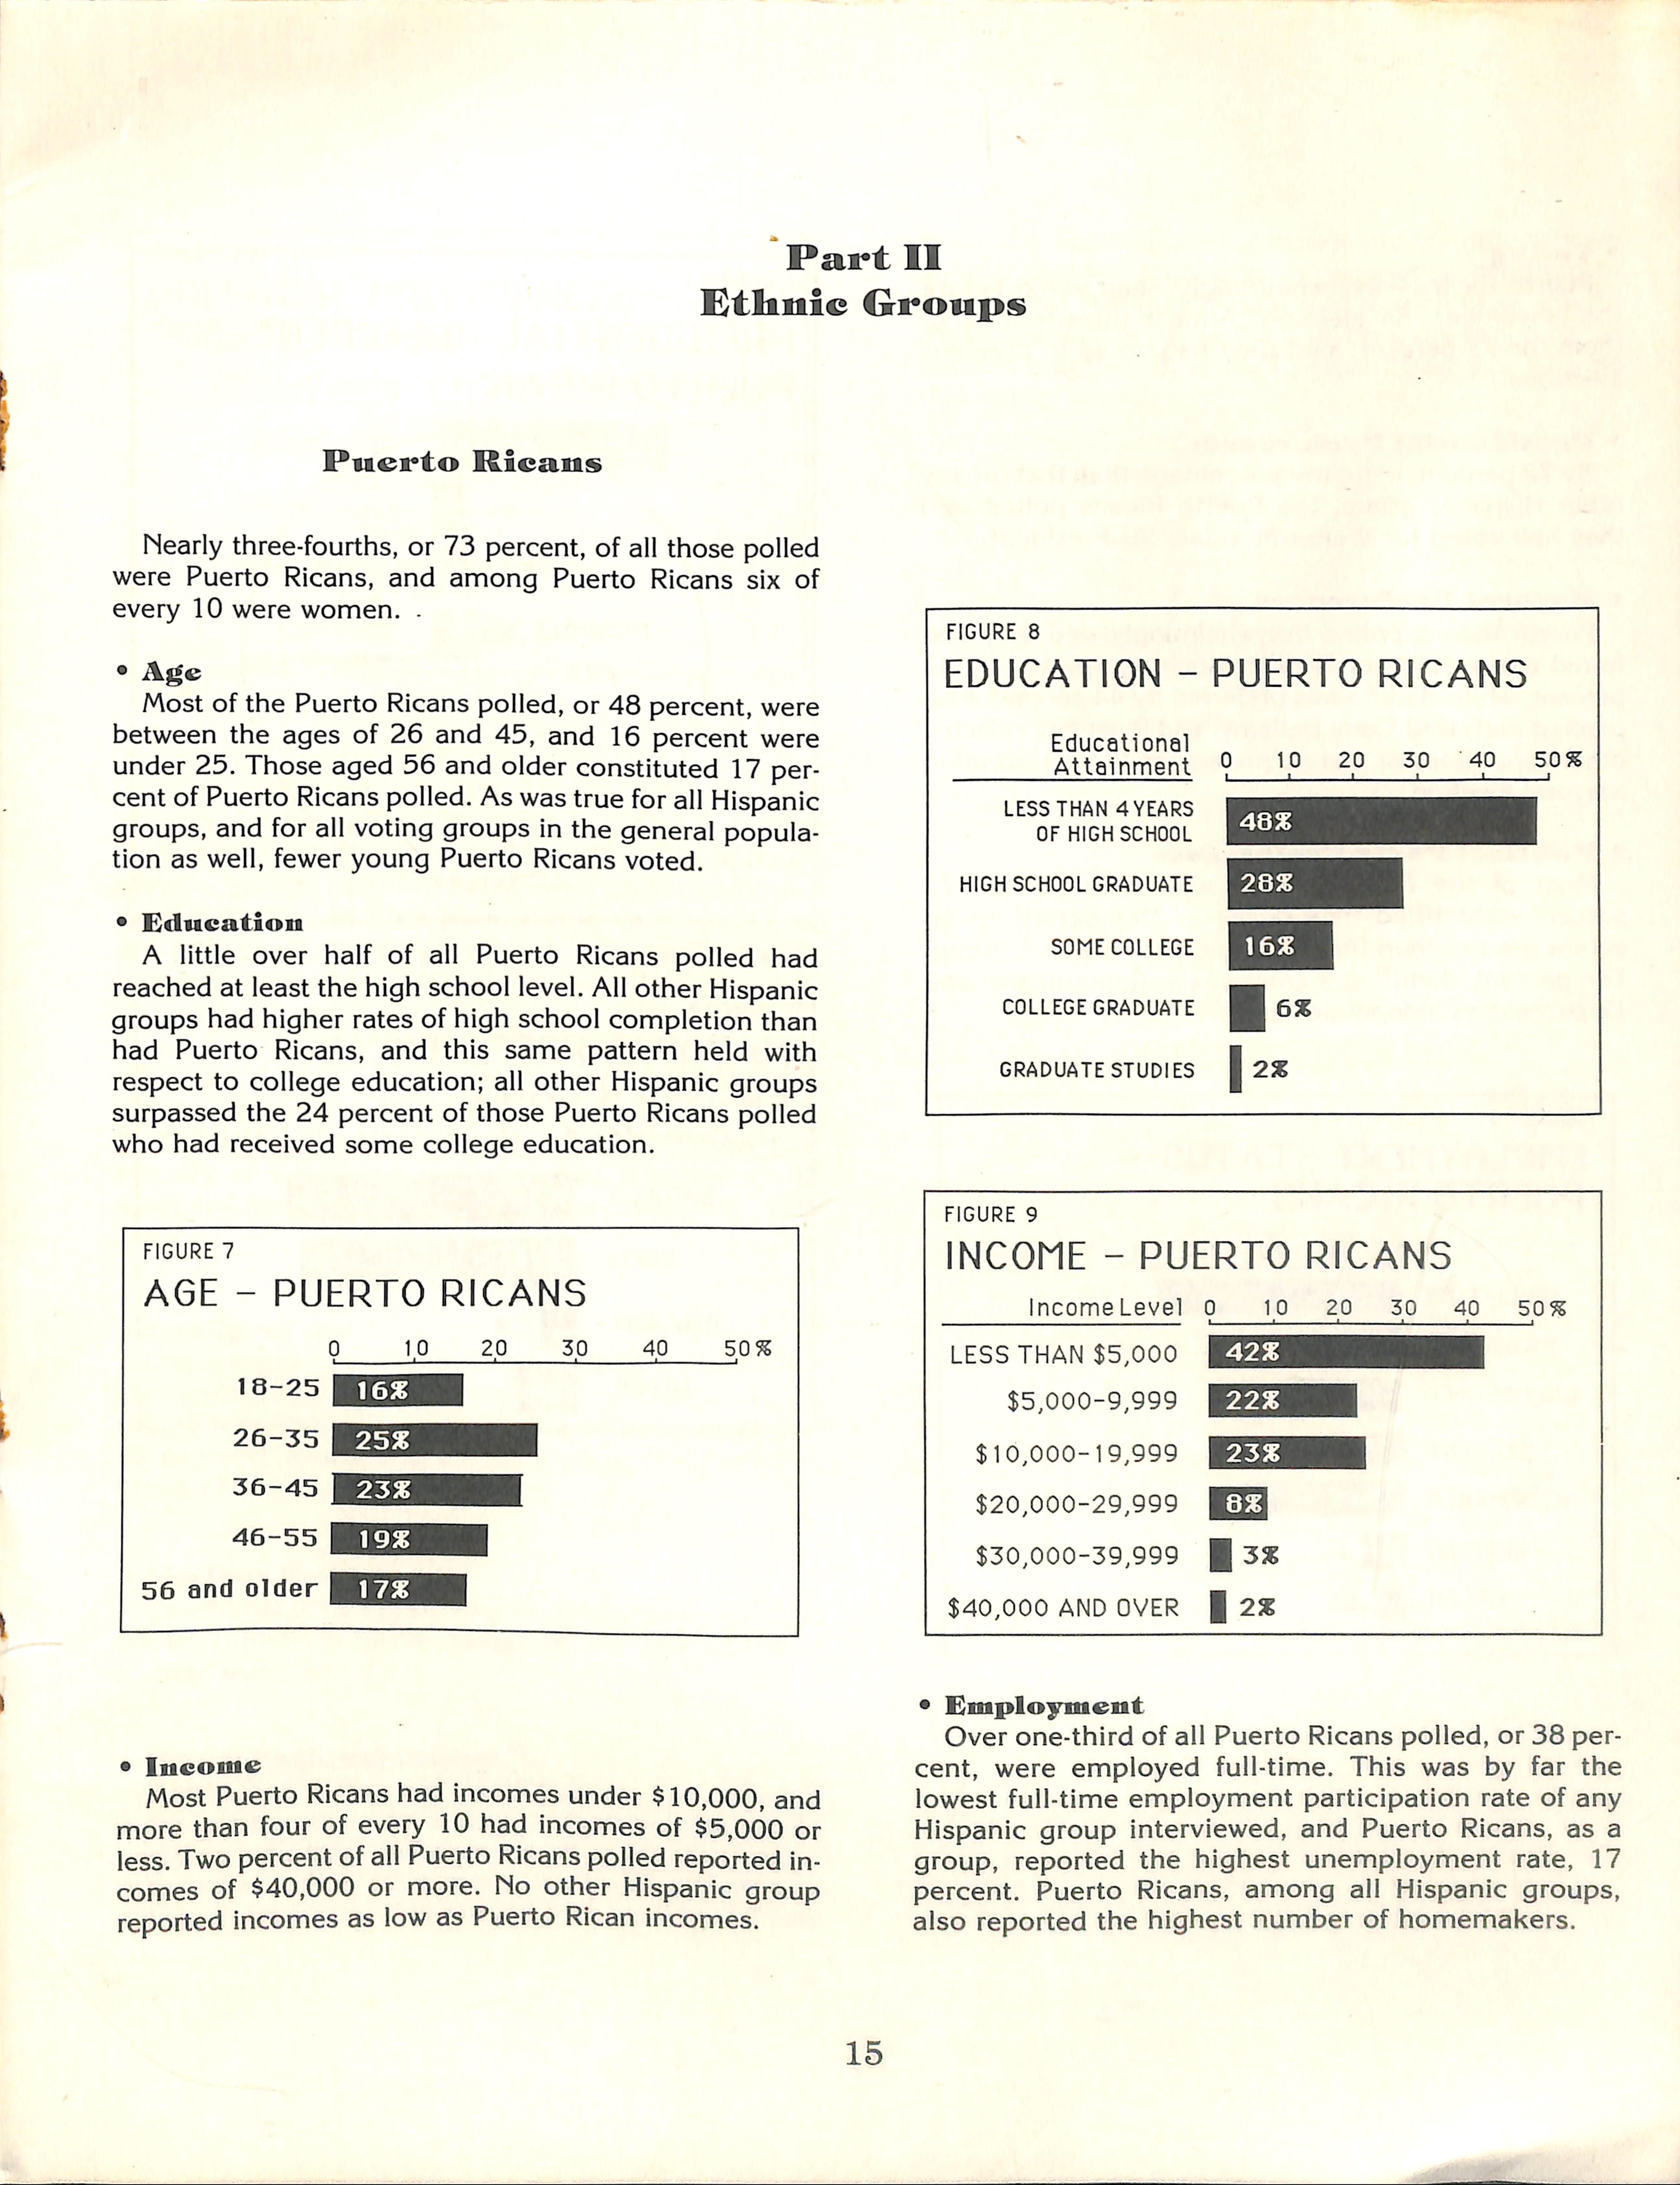
Nearly three-fourths, or 73 percent, of all those polled were Puerto Ricans, and among Puerto Ricans six of every 10 were women. .
• Age
Most of the Puerto Ricans polled, or 48 percent, were between the ages of 26 and 45, and 16 percent were under 25. Those aged 56 and older constituted 17 percent of Puerto Ricans polled. As was true for all Híspanle groups, and for all voting groups in the general population as well, fewer young Puerto Ricans voted.
• Education
A little over half of all Puerto Ricans polled had reached at least the high school level. All other Híspanle groups had higher rates of high school completion than had Puerto Ricans, and this same pattern held with respect to college education; all other Híspanle groups surpassed the 24 percent of those Puerto Ricans polled who had received some college education.
AGE - PUERTO RICANS
• Income
Most Puerto Ricans had incomes under $10,000, and more than four of every 10 had incomes of $5,000 or less. Two percent of all Puerto Ricans polled reported in comes of $40,000 or more. No other Híspanle group reported incomes as low as Puerto Rican incomes.
EDUCATION - PUERTO RICANS
Educatlonal Attainment 9
LESSTHAN 4YEARS OF HIGH SCHOOL
HIGH SCHOOL GRADUATE
SOME COLLEGE
COLLEGEGRADUATE
GRADUATE STUDIES
FIGURE 9
INCOME - PUERTO RICANS
Income Level o 10 20 30 40 501
LESS THAN $5,000
$5,000-9,999
$10,000-19,999
$20,000-29,999
$30,000-39,999|
$40,000 AND OVER | 2X
• Employment
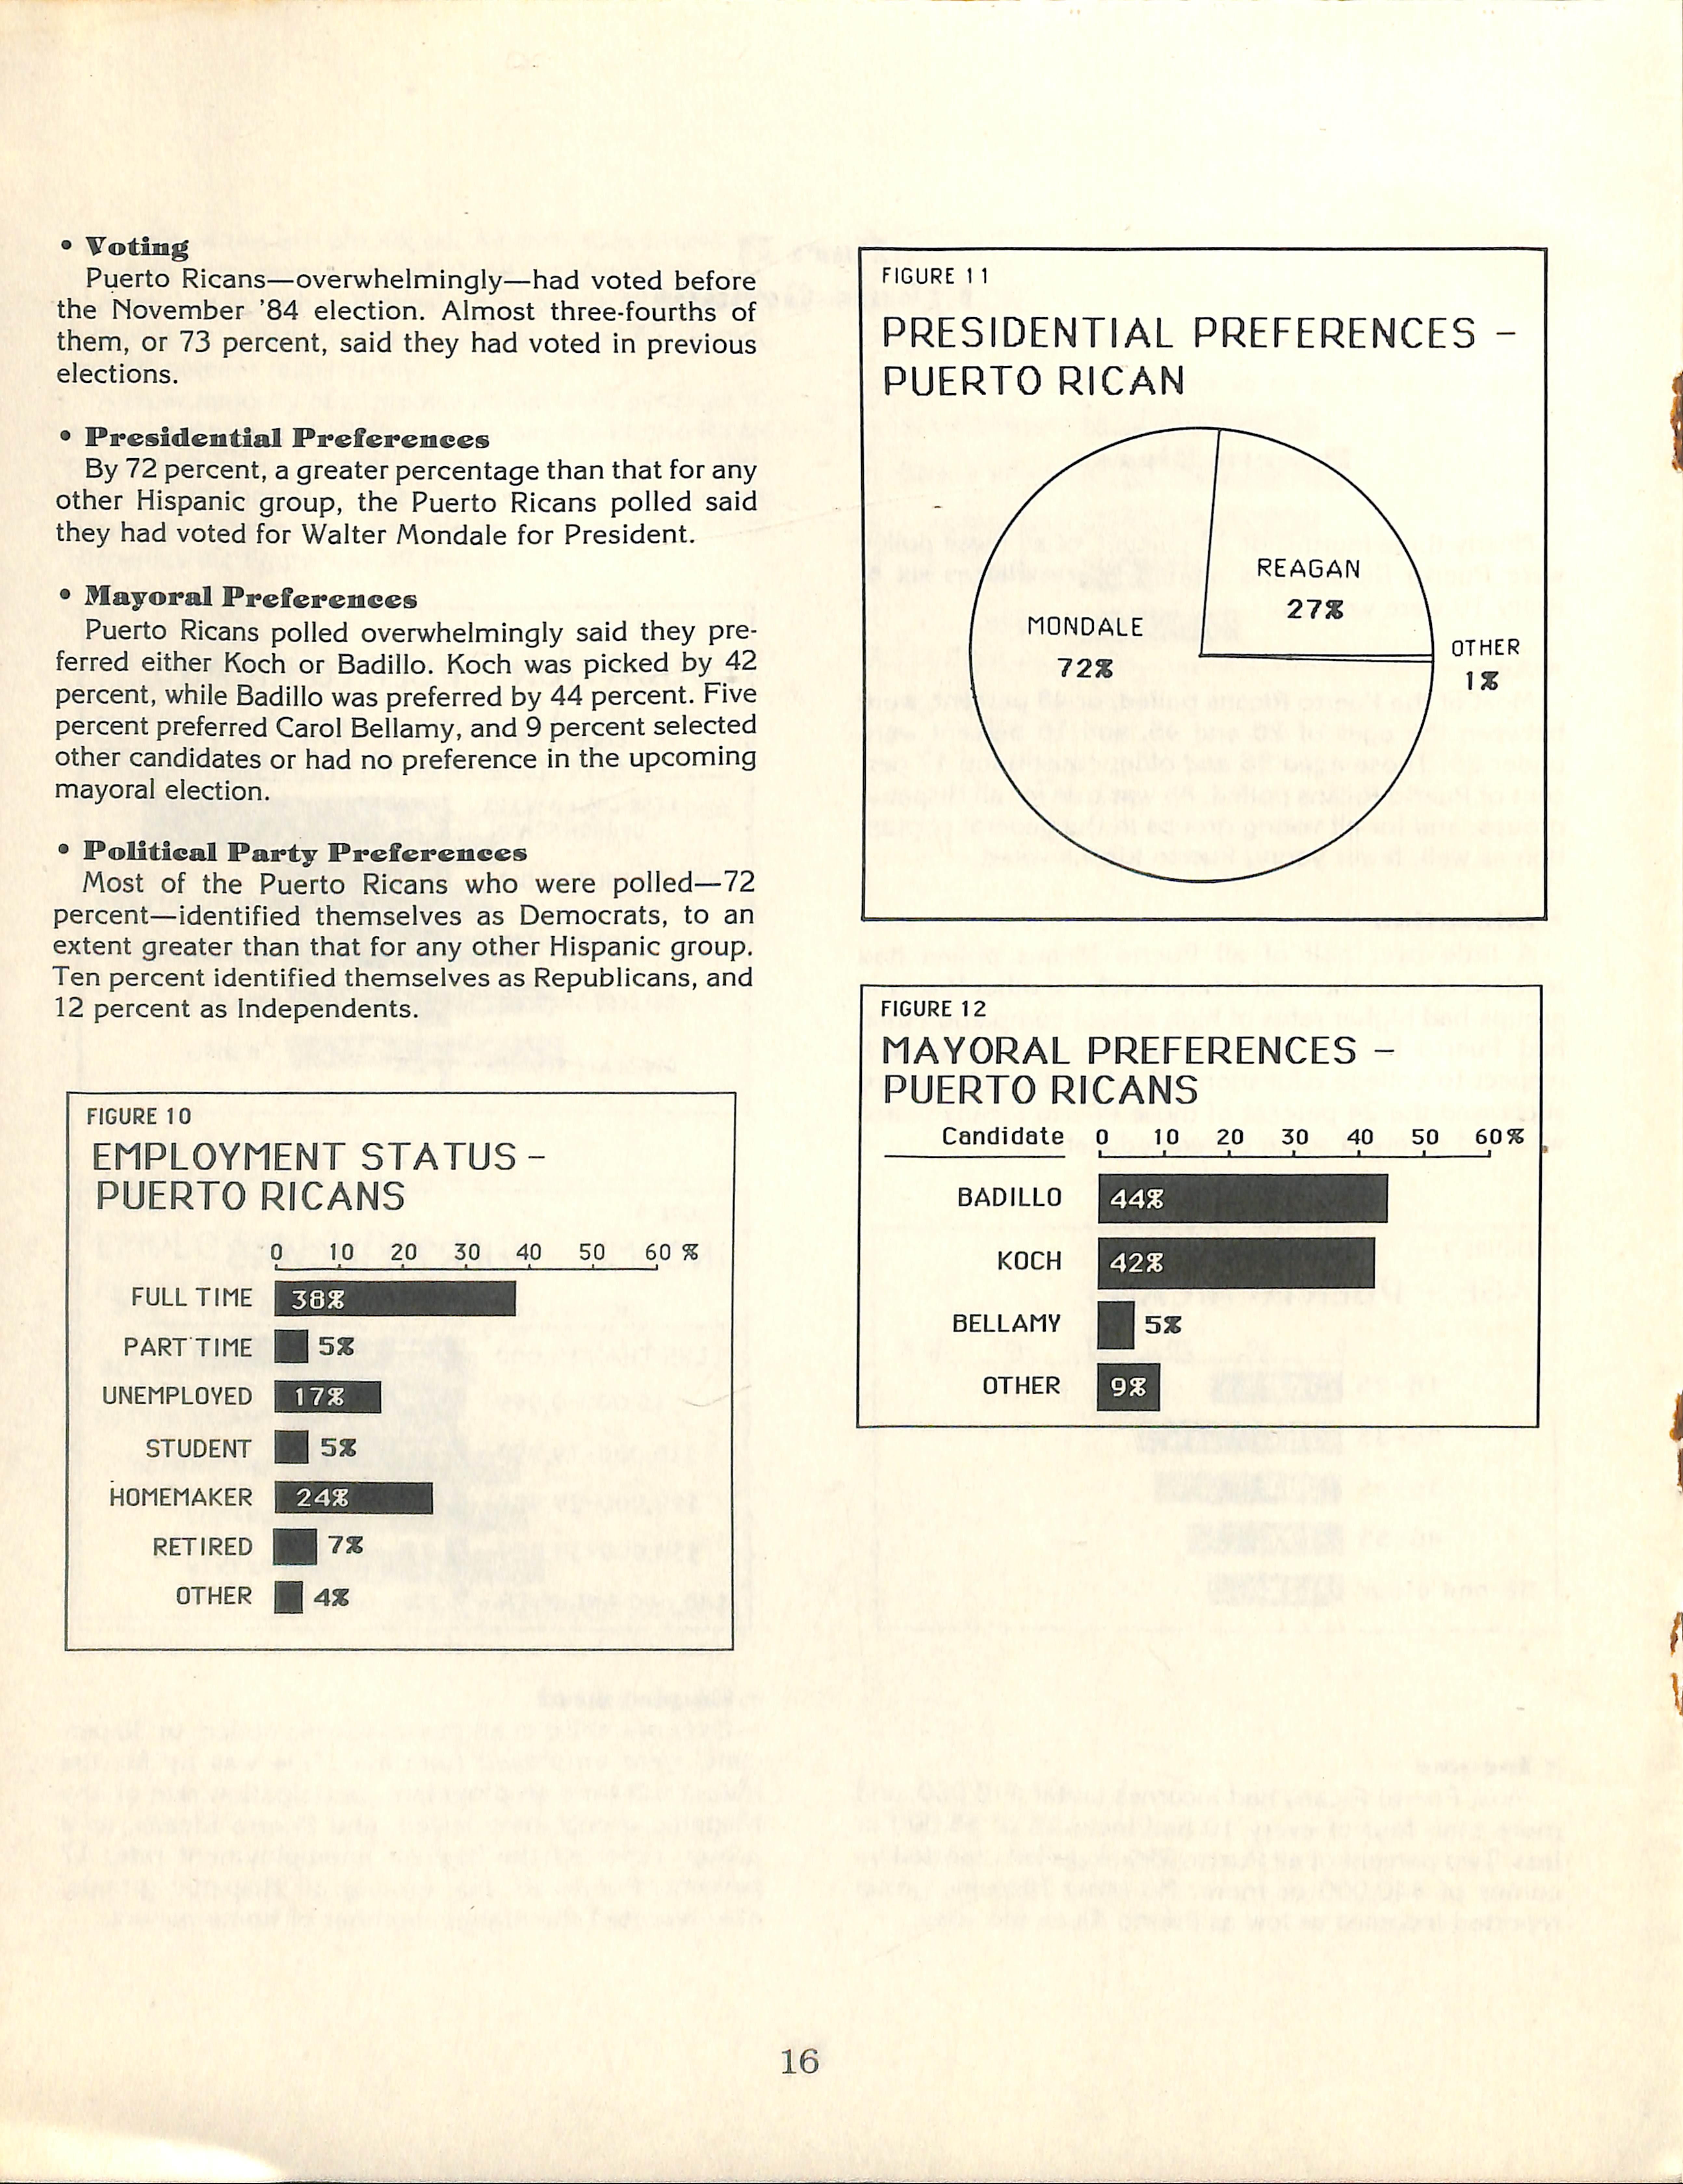
Over one-third of all Puerto Ricans polled, or 38 percent, were employed full-time. This was by far the lowest full-time employment participation rate of any Híspanle group interviewed, and Puerto Ricans, as a group, reported the highest unemployment rate, 17 percent. Puerto Ricans, among all Híspanle groups, also reported the highest number of homemakers.
FIGURE 7
FIGURE 8
* Toting
Puerto Ricans—overwhelmingly—had votad before the November '84 election. Almost three-fourths of them, or 73 percent, said they had votad in pravious alactions.
* Presidential Preferenees
By 72 parcant, a graatar parcantaga than that for any othar Hispanic group, tha Puerto Ricans pollad said thay had votad for Waitar Móndale for Prasldent.
* Mayoral Preferences
Puerto Ricans pollad ovarwhalmingly said thay prafarrad aither Koch or Badillo. Koch was picked by 42 parcant, whila Badillo was prafarrad by 44 parcant. Fiva parcant prafarrad Carol Ballamy, and 9 parcant salactad othar candidatas or had no prafarenca in tha upcoming mayoral alaction.
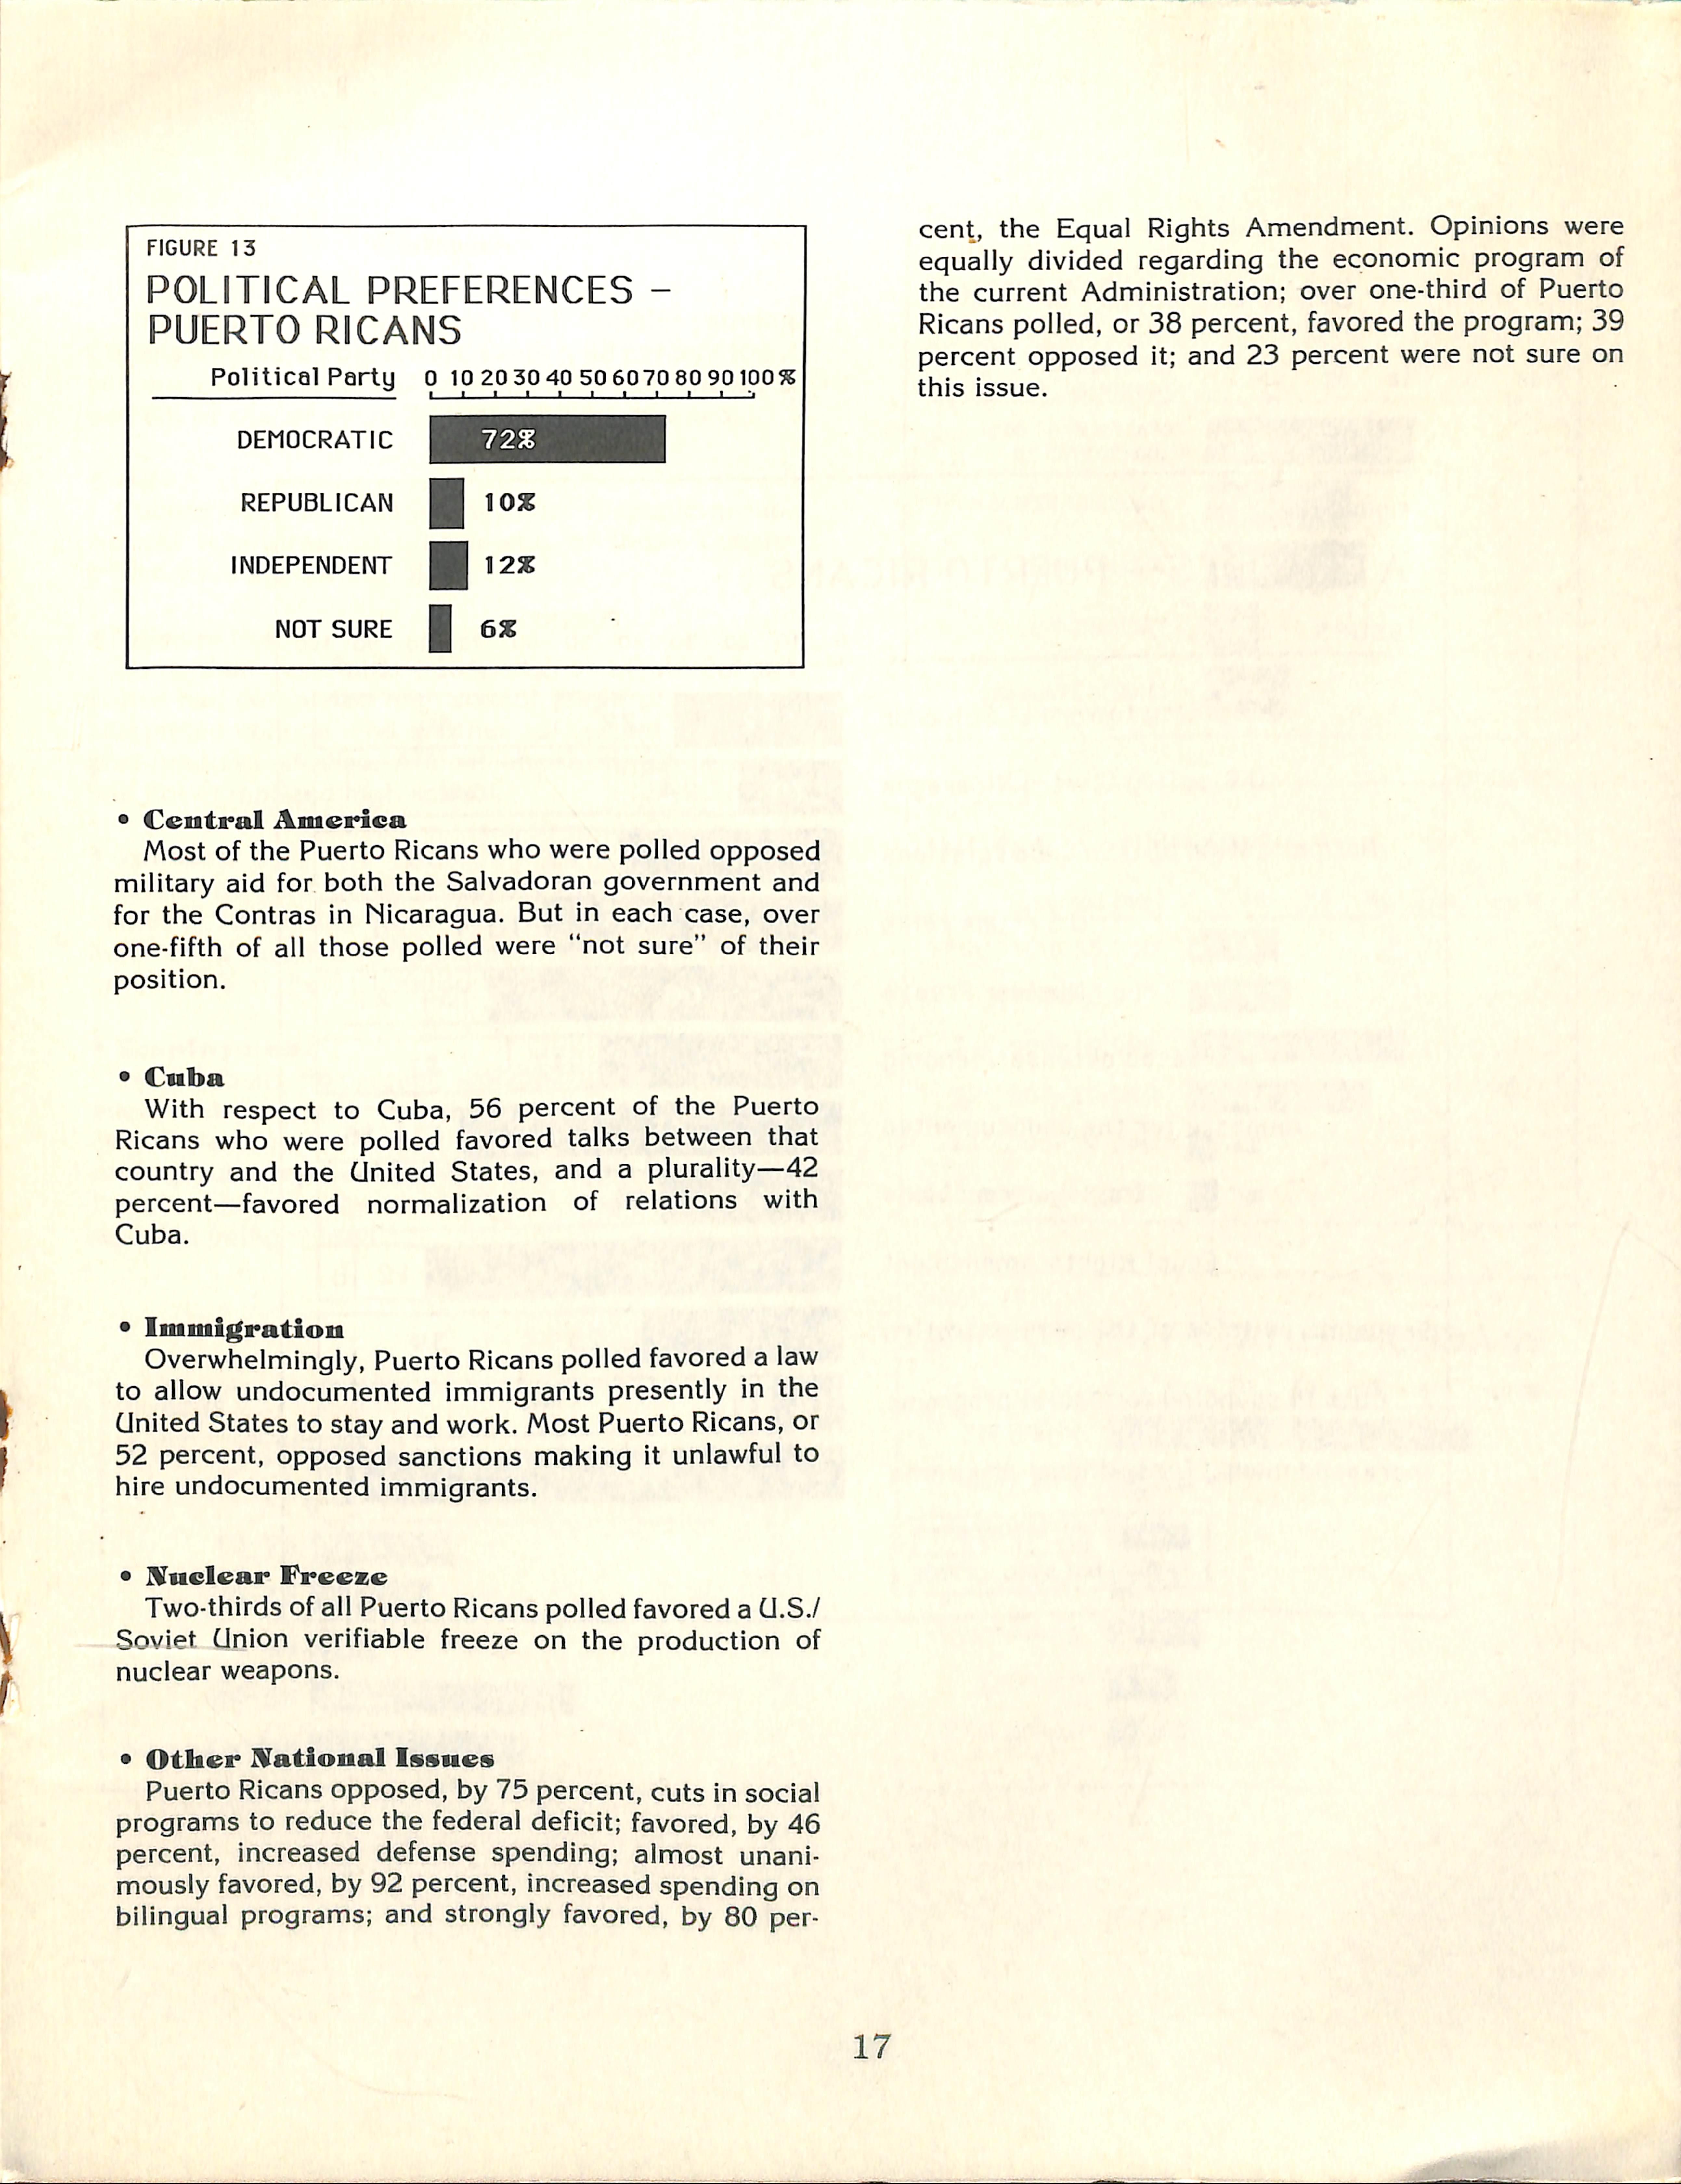
* Political Party Preferenees
Most of the Puerto Ricans who were polled—72 percent—identified themselves as Democrats, to an extant graatar than that for any othar Hispanic group. Tan parcant idantifiad thamselvas as Rapublicans, and 12 parcant as Indapandants.
FIGURE 1 1
PRESIDENTIAL PREFERENCESPUERTO RICAN
FIGURE 10
FIGURE 13
POLITICAL PREFERENCES -
DEMOCRATIC
REPUBLICAN 1 10X
INDEPENDENT |[| 12Z
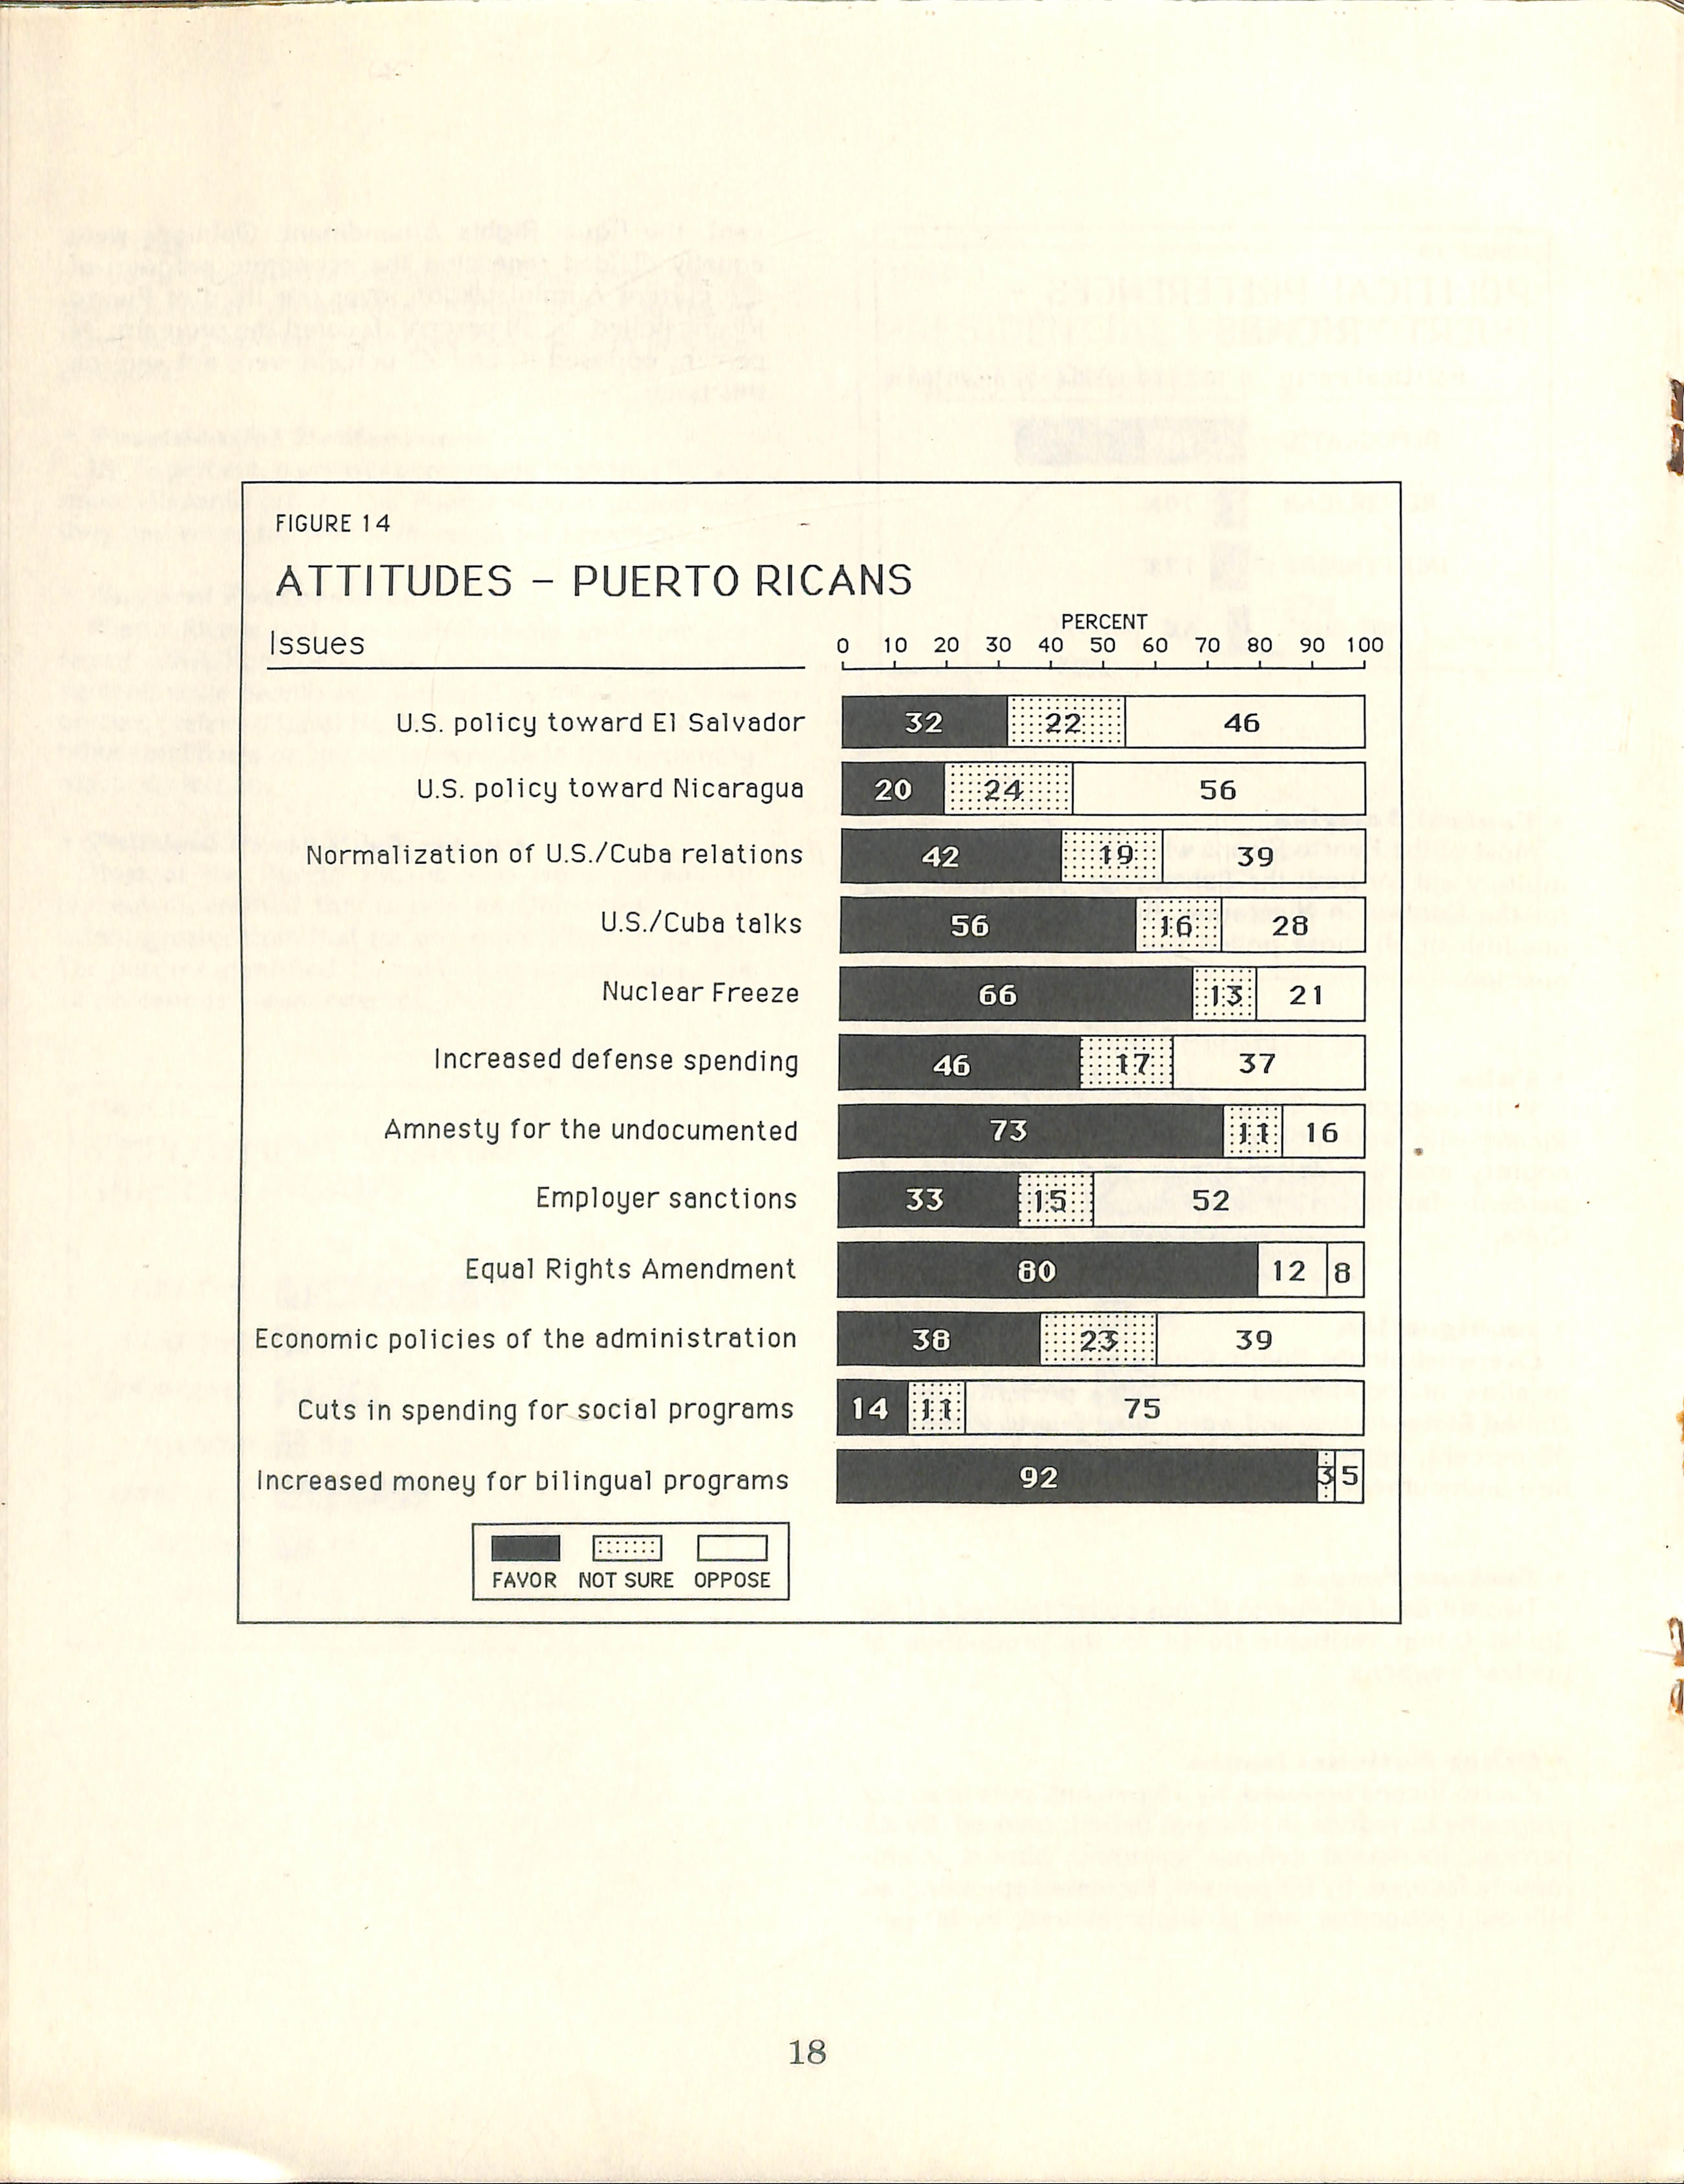
• Central América
Most of the Puerto Ricans who were polled opposed military aid for both the Salvadoran government and for the Contras in Nicaragua. But in each case, over one-fifth of ai! those polled were "not sure" of their position.
• Cuba
With respect to Cuba, 56 percent of the Puerto Ricans who were polled favored talks between that country and the ünited States, and a plurality—42 percent—favored normalization of relations with Cuba.
• Immigration
Overwhelmingly, Puerto Ricans polled favored a law to allow undocumented immigrants presently in the ünited States to stay and work. Most Puerto Ricans, or 52 percent, opposed sanctions making it unlawful to hire undocumented immigrants.
• Nnelear Freeze
Two-thirds of all Puerto Ricans polled favored a Ü.S./ Soviet ünion verifiable freeze on the production of nuclear weapons.
* Other STatlonal Issues
Puerto Ricans opposed, by 75 percent, cuts in social programs to reduce the federal déficit; favored, by 46 percent, increased defense spending; almost unanimously favored, by 92 percent, increased spending on bilingual programs; and strongly favored, by 80 per-
cent, the Equal Rights Amendment. Opinions were equally divided regarding the economic program of the current Administration; over one-third of Puerto Ricans polled, or 38 percent, favored the program; 39 percent opposed it; and 23 percent were not sure on this ¡ssue.
14
ATTITUDES - PUERTO RICANS
Cnbans
The proportions of males and females among Cubans who were polled were similar,48 percent to 52 percent respectively. Collectively, they constituted 5 percent or one of every 20 Híspanles interviewed.
Age
Cubans were eider than any other Híspanle group. Almost two-thlrds, or 60 percent, of those Cubans polled were aged 46 or older.
• Educatiou
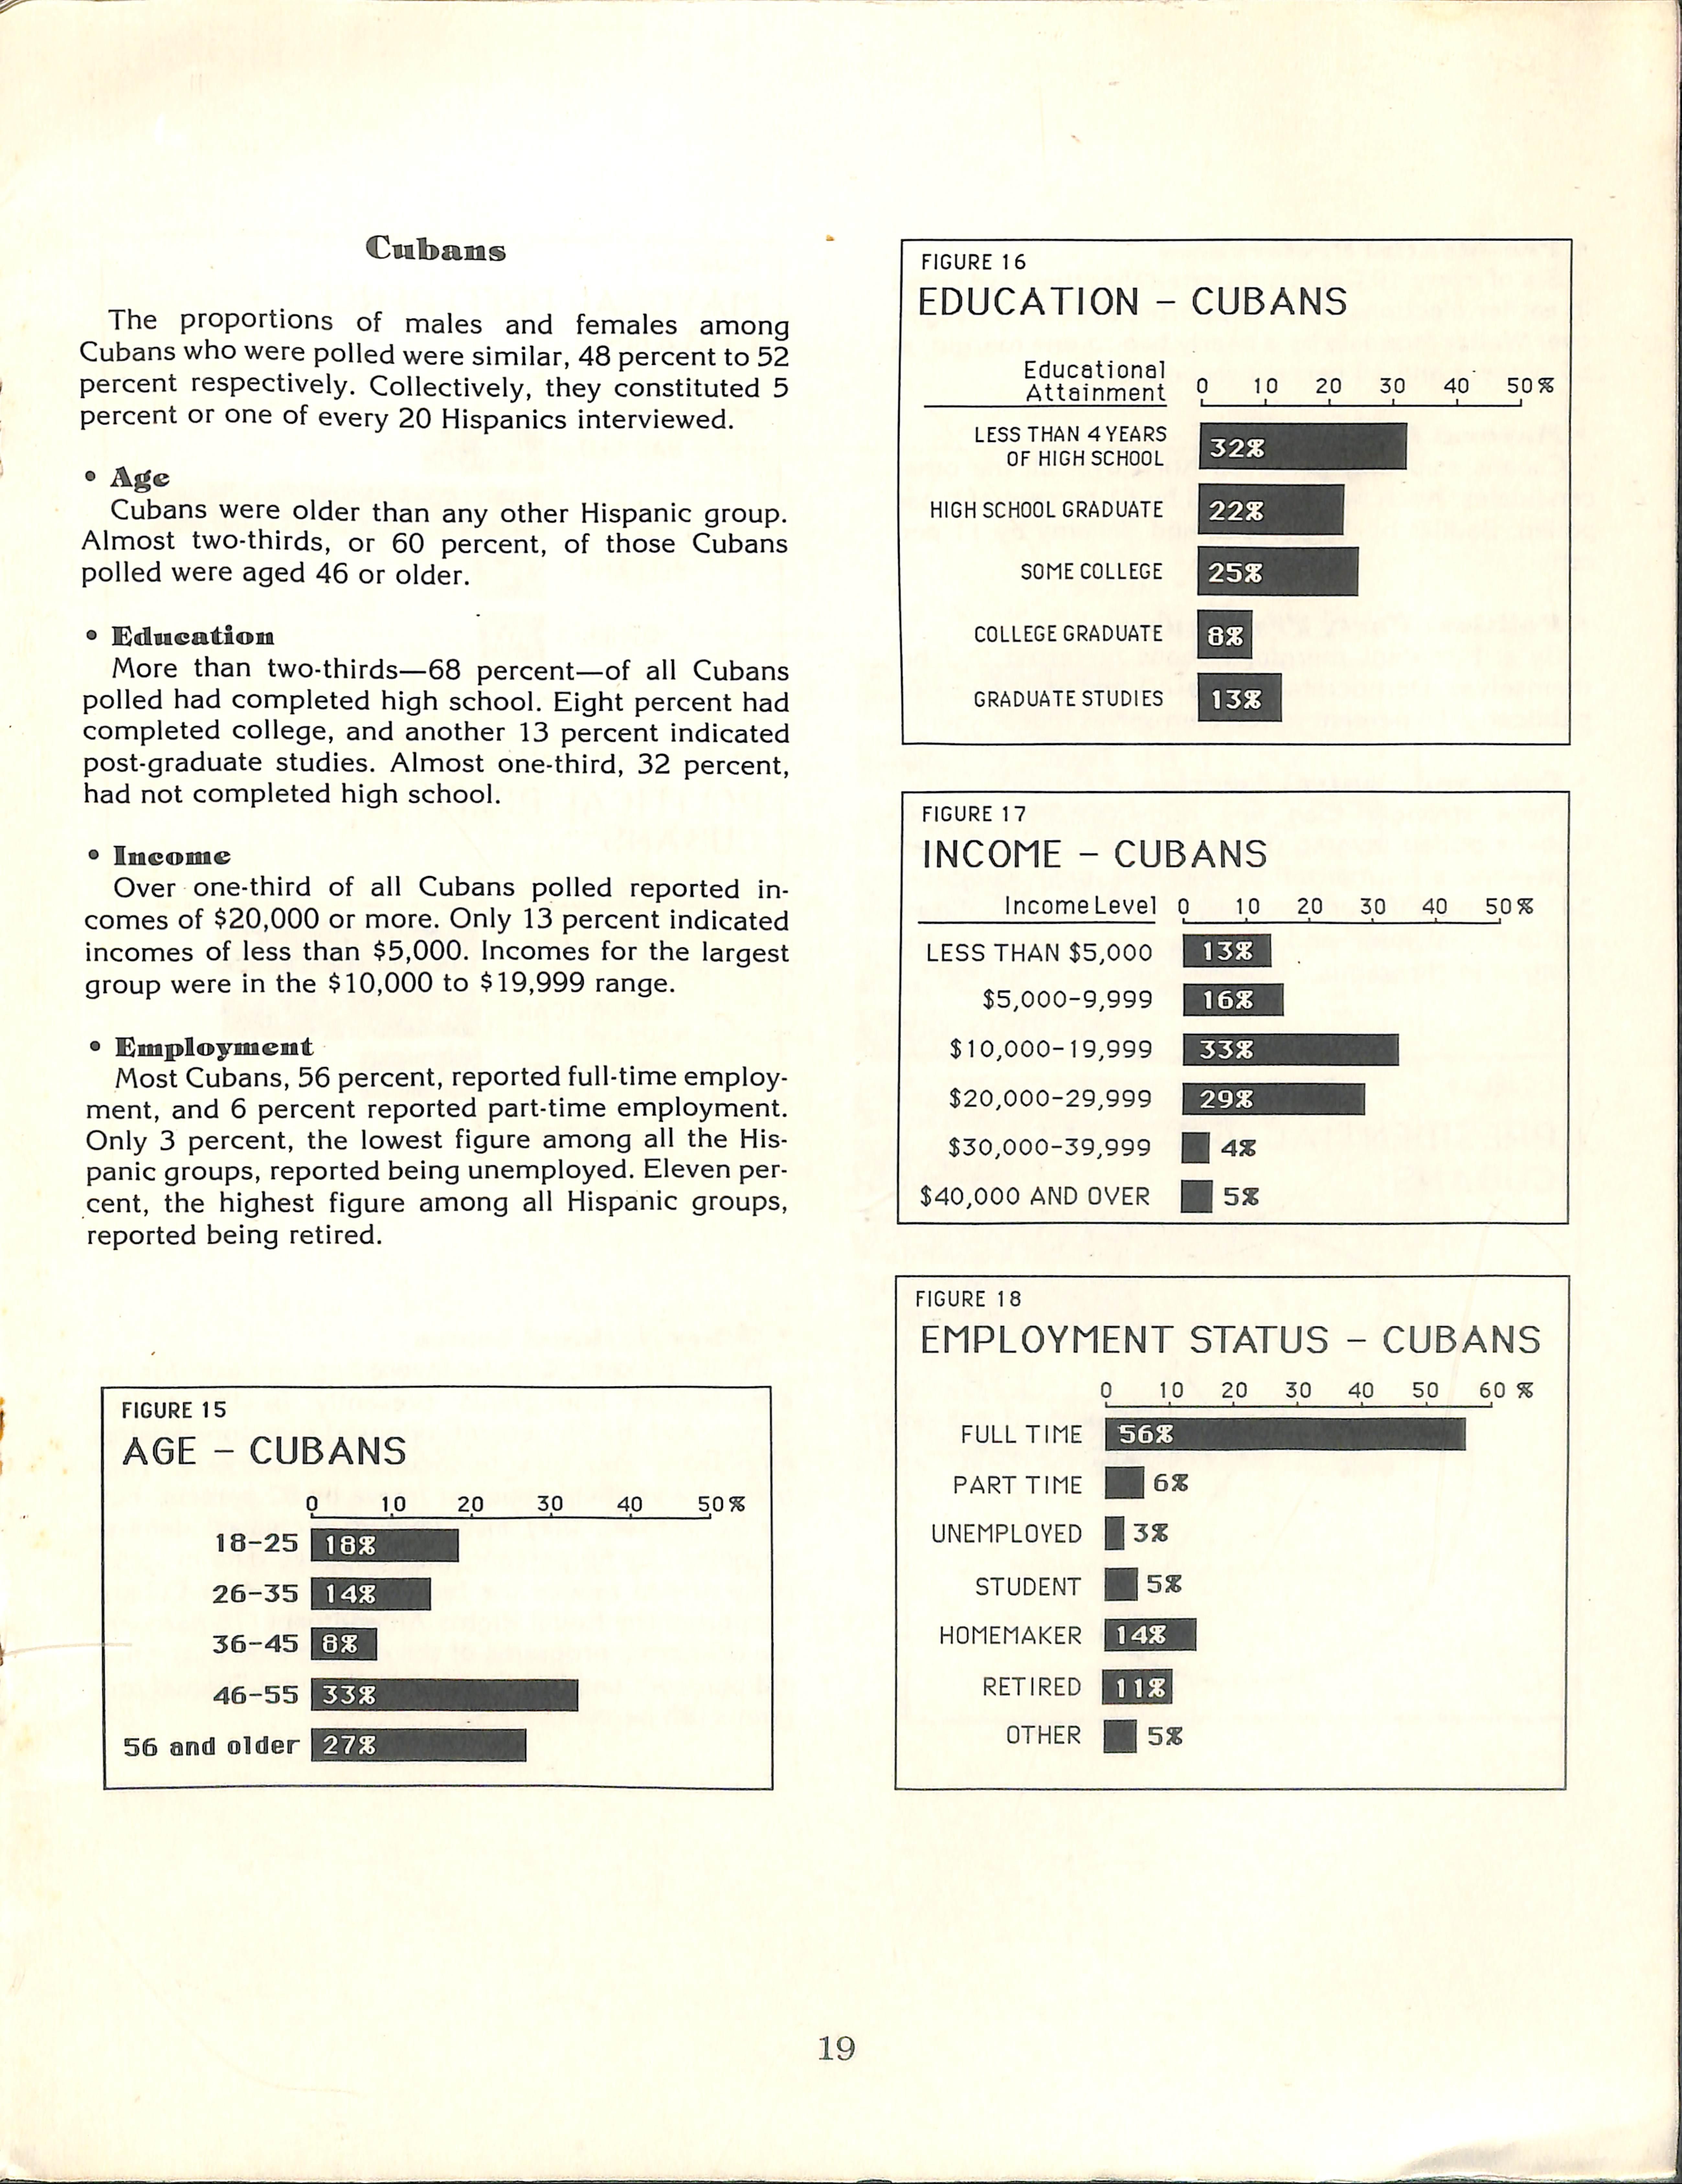
More than two-thlrds—68 percent—of all Cubans polled had completed hlgh school. Elght percent had completad college, and another 13 percent Indlcated post-graduate studles. Almost one-thlrd, 32 percent, had not completed hlgh school.
* Ineome
Over one-thlrd of all Cubans polled reported Incomes of $20,000 or more. Only 13 percent Indlcated Incomes of less than $5,000. Incomes for the largest group were In the $10,000 to $19,999 range.
• Employment
Most Cubans,56 percent, reported full-tlme employ ment, and 6 percent reported part-tlme employment. Only 3 percent, the lowest figure among all the Hís panle groups, reported belng unemployed. Eleven percent, the hlghest figure among all Híspanle groups, reported belng retlred.
15
FIGURE 16
- CUBANS
LESSTHAN 4YEARS OF HIGH SCHOOL
HIGH SCHOOL GRADUATE
SOME COLLEGE
COLLEGEGRADUATE
GRADUATE STUDIES
FIGURE 17
INCOME - CUBANS
$5,000
$5,000-9,999
$10,000-19,999
$20,000-29,999
$30,000-39,999
$40,000 AND OVER
FIGURE 18
EMPLOYMENT STATUS - CUBANS
FIGURE
• Presidential Preferences
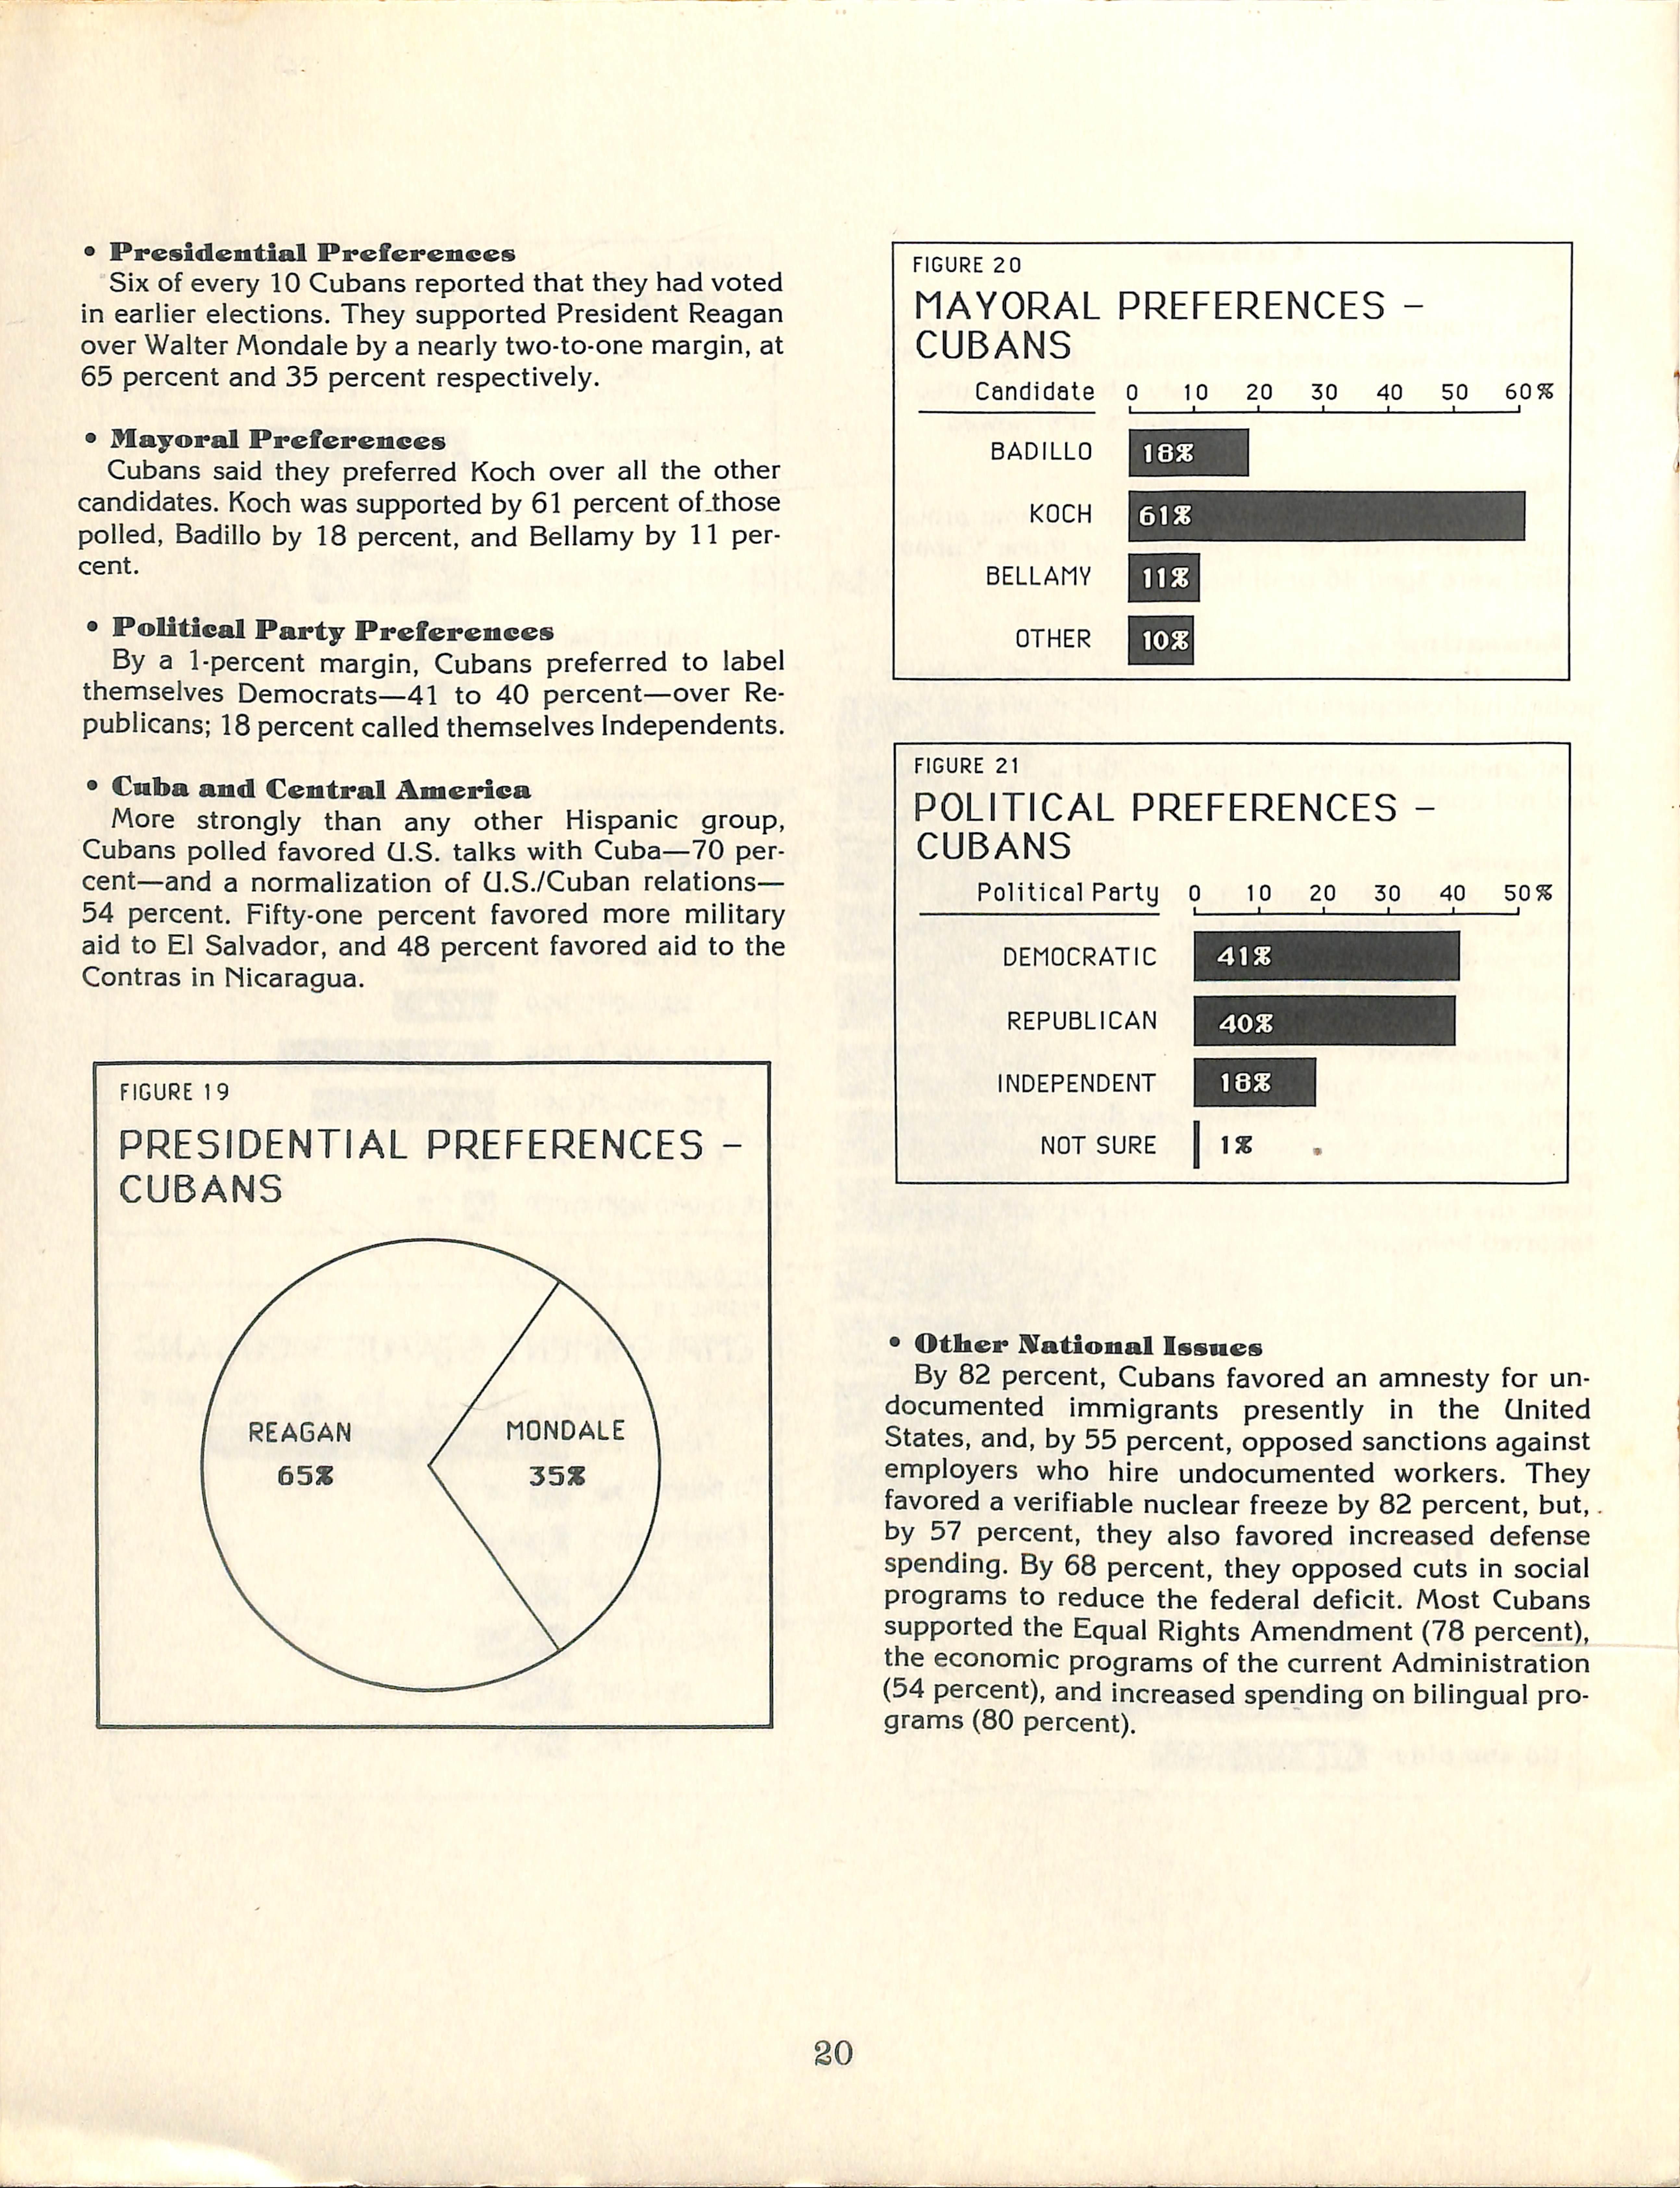
Six of every 10 Cubans reported that they had voted in earlier elections. They supported President Reagan over Walter Móndale by a nearly two-to-one margin, at 65 percent and 35 percent respectiveiy.
• Mayoral Preferences
Cubans said they preferred Koch over ai! the other candldates. Koch was supported by 61 percent ofdhose polled, Badlllo by 18 percent, and Beliamy by 11 percent.
• Political Party Preferenees
By a 1-percent margin, Cubans preferred to iabel themseives Democrats—41 to 40 percent—over Re publicana; 18 percent called themseives Independents.
• Cuba and Central América
More strongly than any other Híspanle group, Cubans polled favored Ü.S. talks with Cuba—70 percent—and a normalization of (J.S./Cuban relations— 54 percent. Fifty-one percent favored more military aid to El Salvador, and 48 percent favored aid to the Contras in Nicaragua.
19
PRESIDENTIAL PREFERENCESCUBANS
FIGURE 20
MAYORAL PREFERENCESCUBANS BADILLO
FIGURE 21
POLITICAL PREFERENCESCUBANS
Political Party o 10 20 30 40 501
DEMOCRATIC
REPUBLICAN
INDEPENDENT
NOT SURE
* Other Aational Issnes
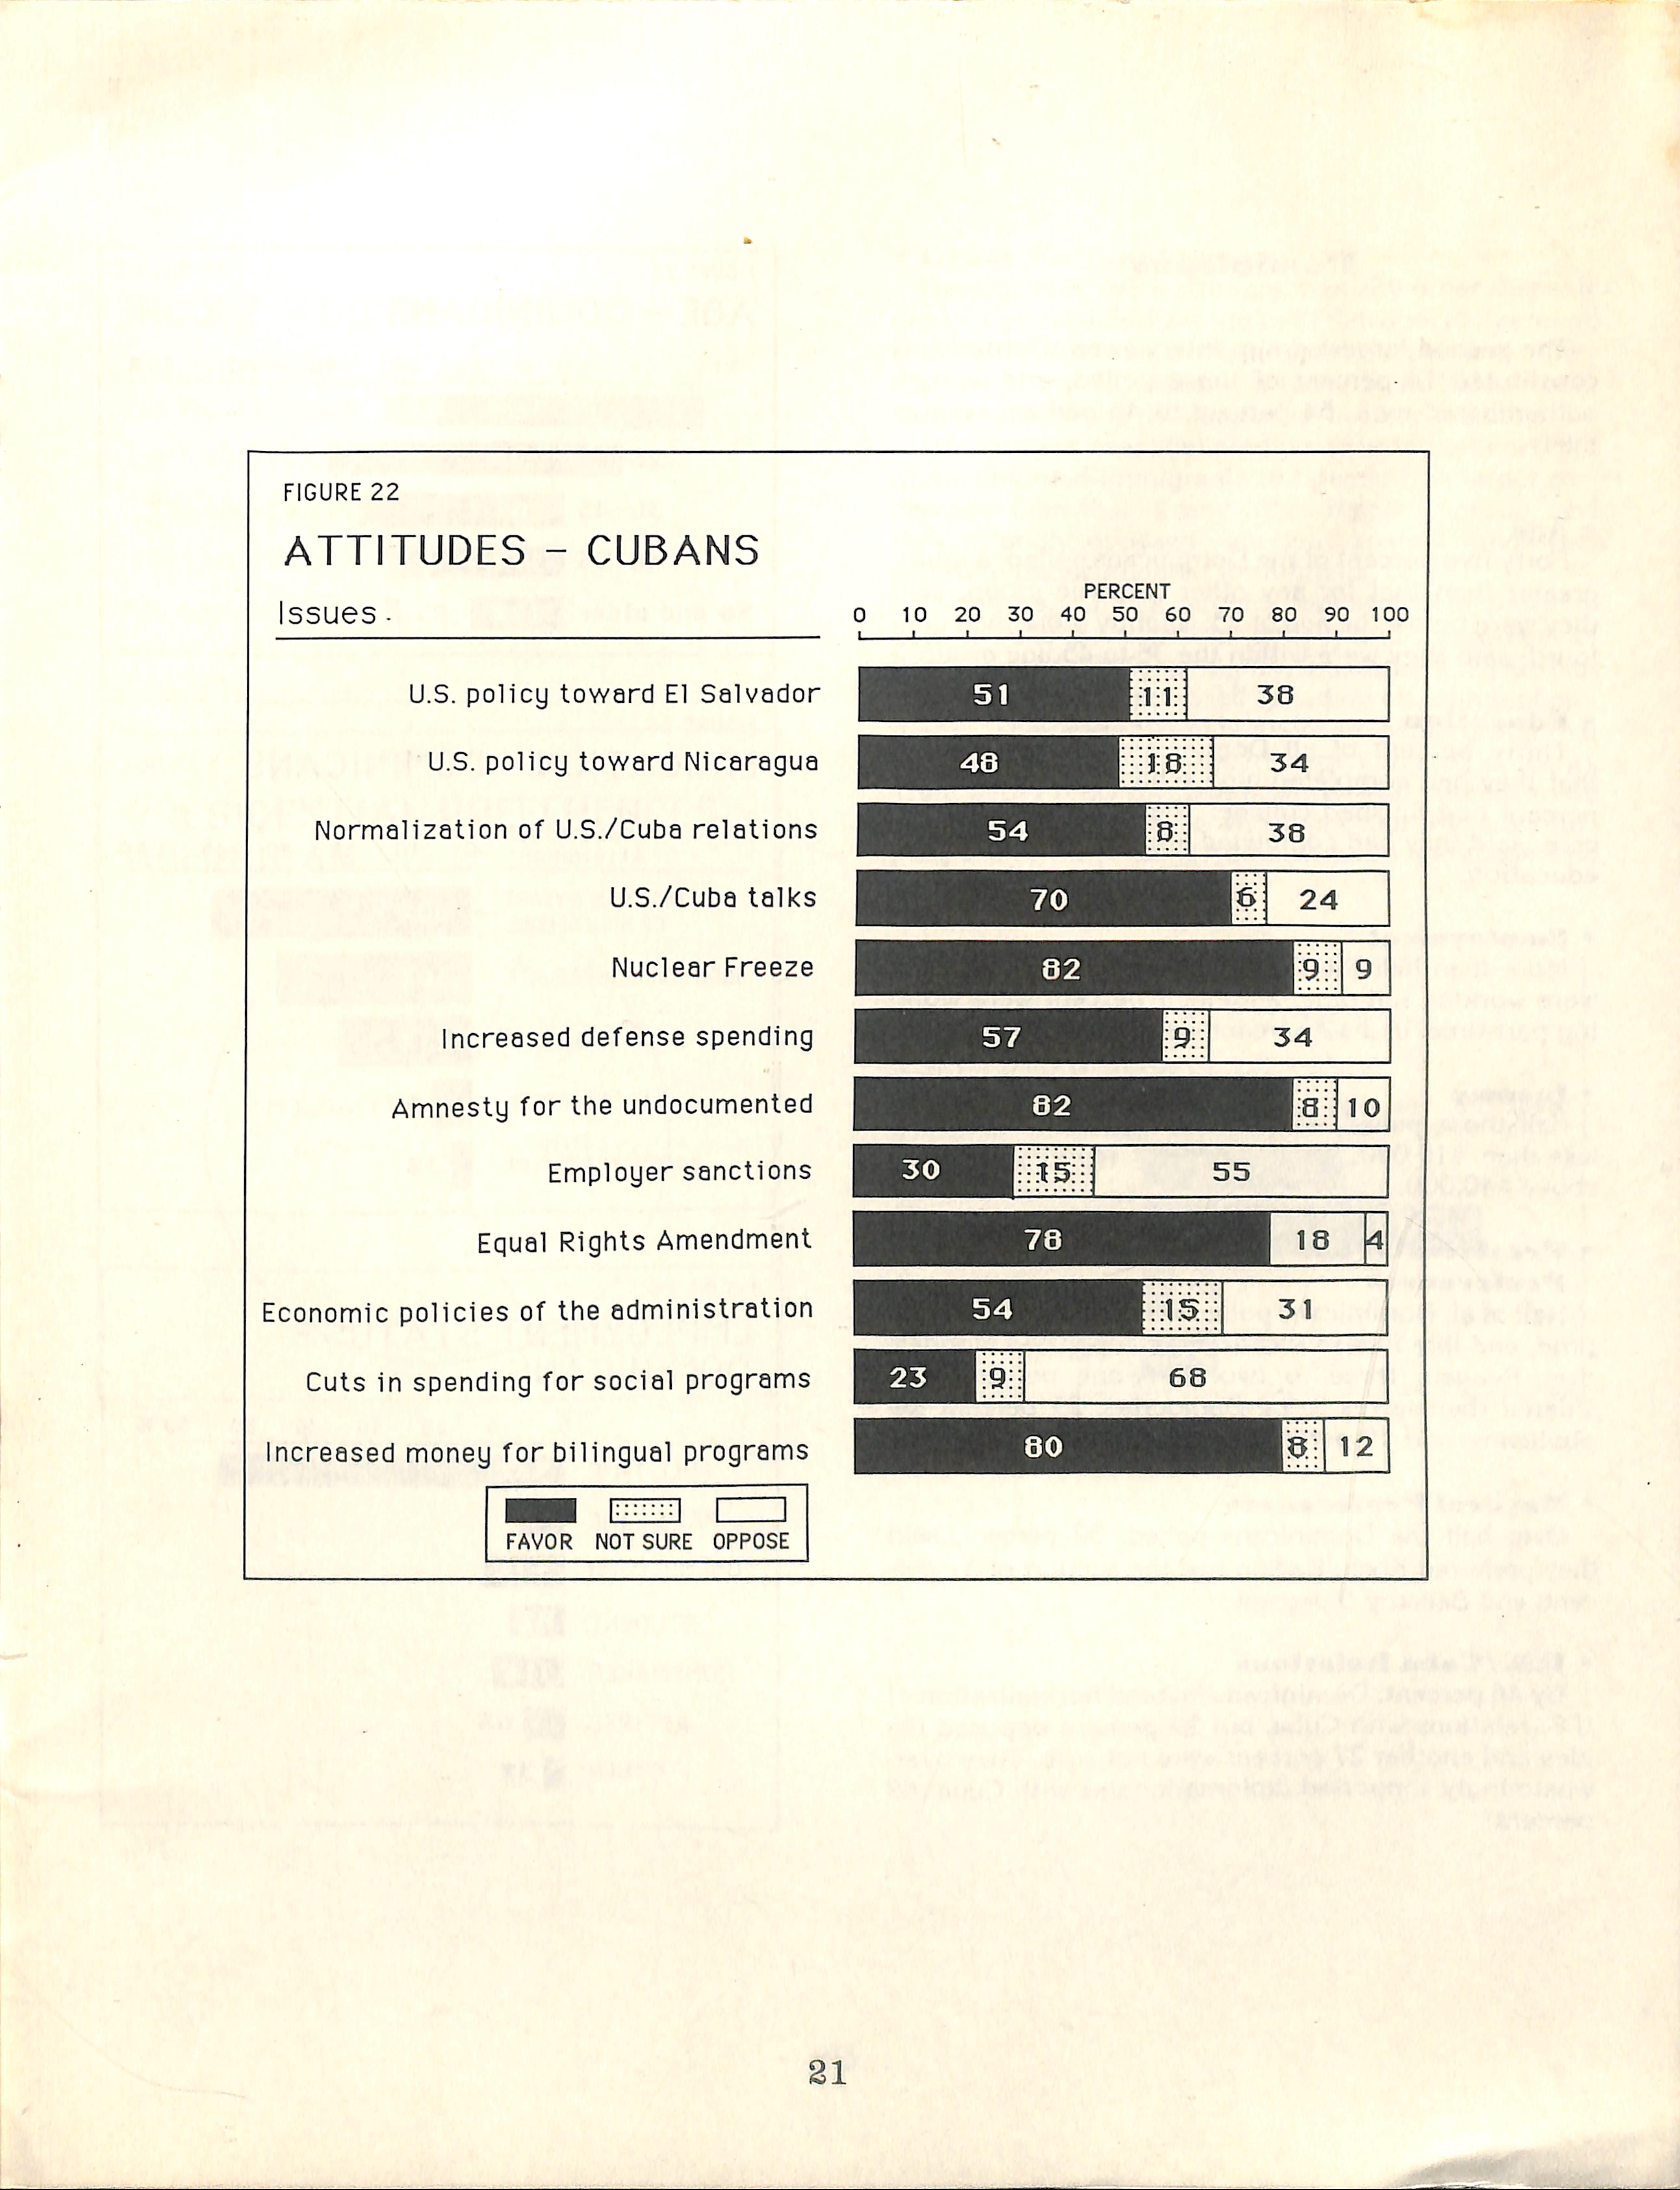
By 82 percent, Cubans favored an amnesty for undocumented immigrants presently in the CJnited States, and, by 55 percent, opposed sanctions against employers who hire undocumented workers. They favored a verifiable nuclear freeze by 82 percent, but,. by 57 percent, they also favored increased defense spending. By 68 percent, they opposed cuts in social programs to reduce the federal déficit. Most Cubans supported the Equal Rights Amendment(78 percent), the economic programs of the current Administration (54 percent), and increased spending on bilingual pro grams(80 percent).
FIGURE
ATTITUDES - CUBANS
Dominieaus
The second largest group ¡nterviewed, Dominicans constituted 14 percent of those polled, and women outnumbered men, 54 percent to 46 percent respectively.
* Age
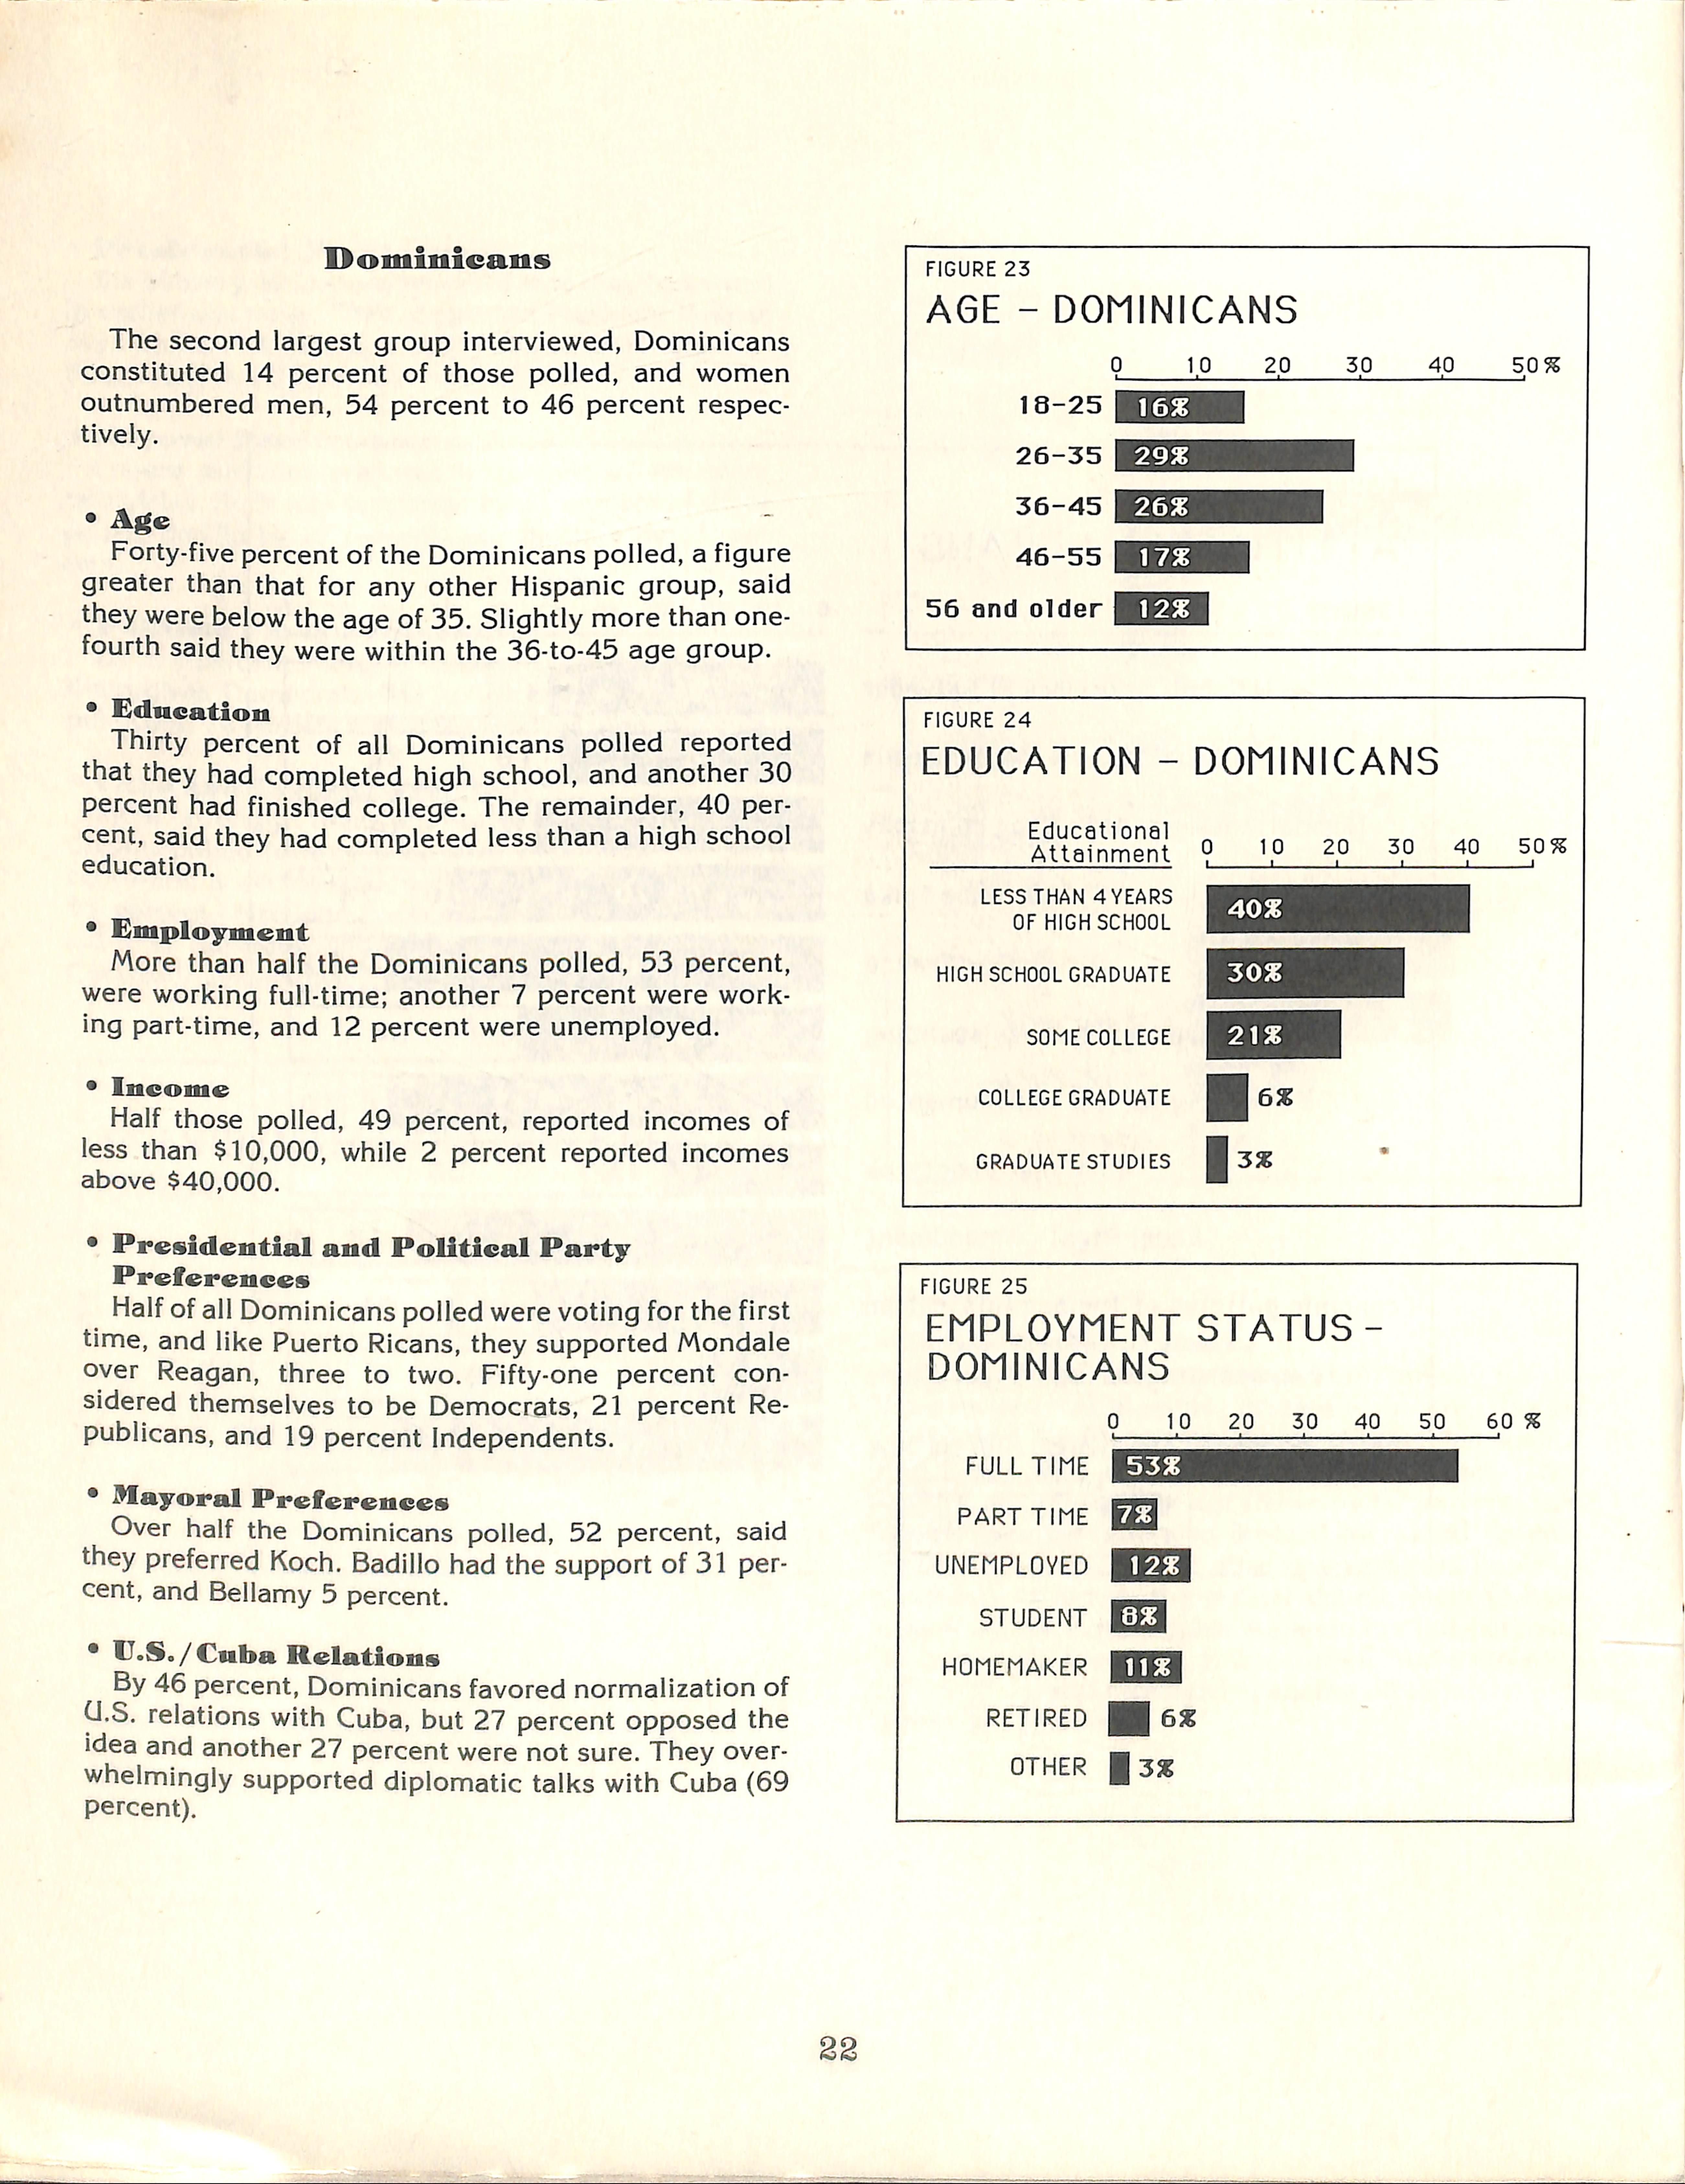
Forty-five percent of the Dominicans polled, a figure greater than that for any other Hispanic group, said they were below the age of 35. Slightly more than onefourth said they were within the 36-to-45 age group.
* Ediicatiom
Thirty percent of all Dominicans polled reported that they had completad high school, and another 30 percent had finished college. The remainder, 40 percent, said they had completad less than a high school education.
* Employment
More than half the Dominicans polled, 53 percent, were working full-time; another 7 percent were working part-time, and 12 percent were unemployed.
* Income
Half those polled, 49 percent, reported incomes of less than $10,000, while 2 percent reported incomes above $40,000.
* Presidential and Political Party Preferences
Half of all Dominicans polled were voting for the first time, and like Puerto Ricans, they supported Móndale ovar Reagan, three to two. Fifty-one percent con siderad themselves to be Democrats, 21 percent Republicans, and 19 percent Independents.
* Mayoral Preferences
Ovar half the Dominicans polled, 52 percent, said they preferred Koch. Badillo had the support of 31 percent, and Bellamy 5 percent.
* P'S./Cnba Relations
By 46 percent, Dominicans favored normalization of Ü.S. relations with Cuba, but 27 percent opposed the idea and another 27 percent were not sure. They overwhelmingly supported diplomatic talks with Cuba(69 percent).
23
56 and oider
EDUCATION - DOMINICANS
Educational Attainment
LESS THAN 4YEARS OF HIGH SCHOOL
HIGH SCHOOL GRADUATE
SOME COLLEGE
COLLEGE GRADUATE
GRADUATE STUDIES
FIGURE 25
FIGURE 24
FIGURE 26
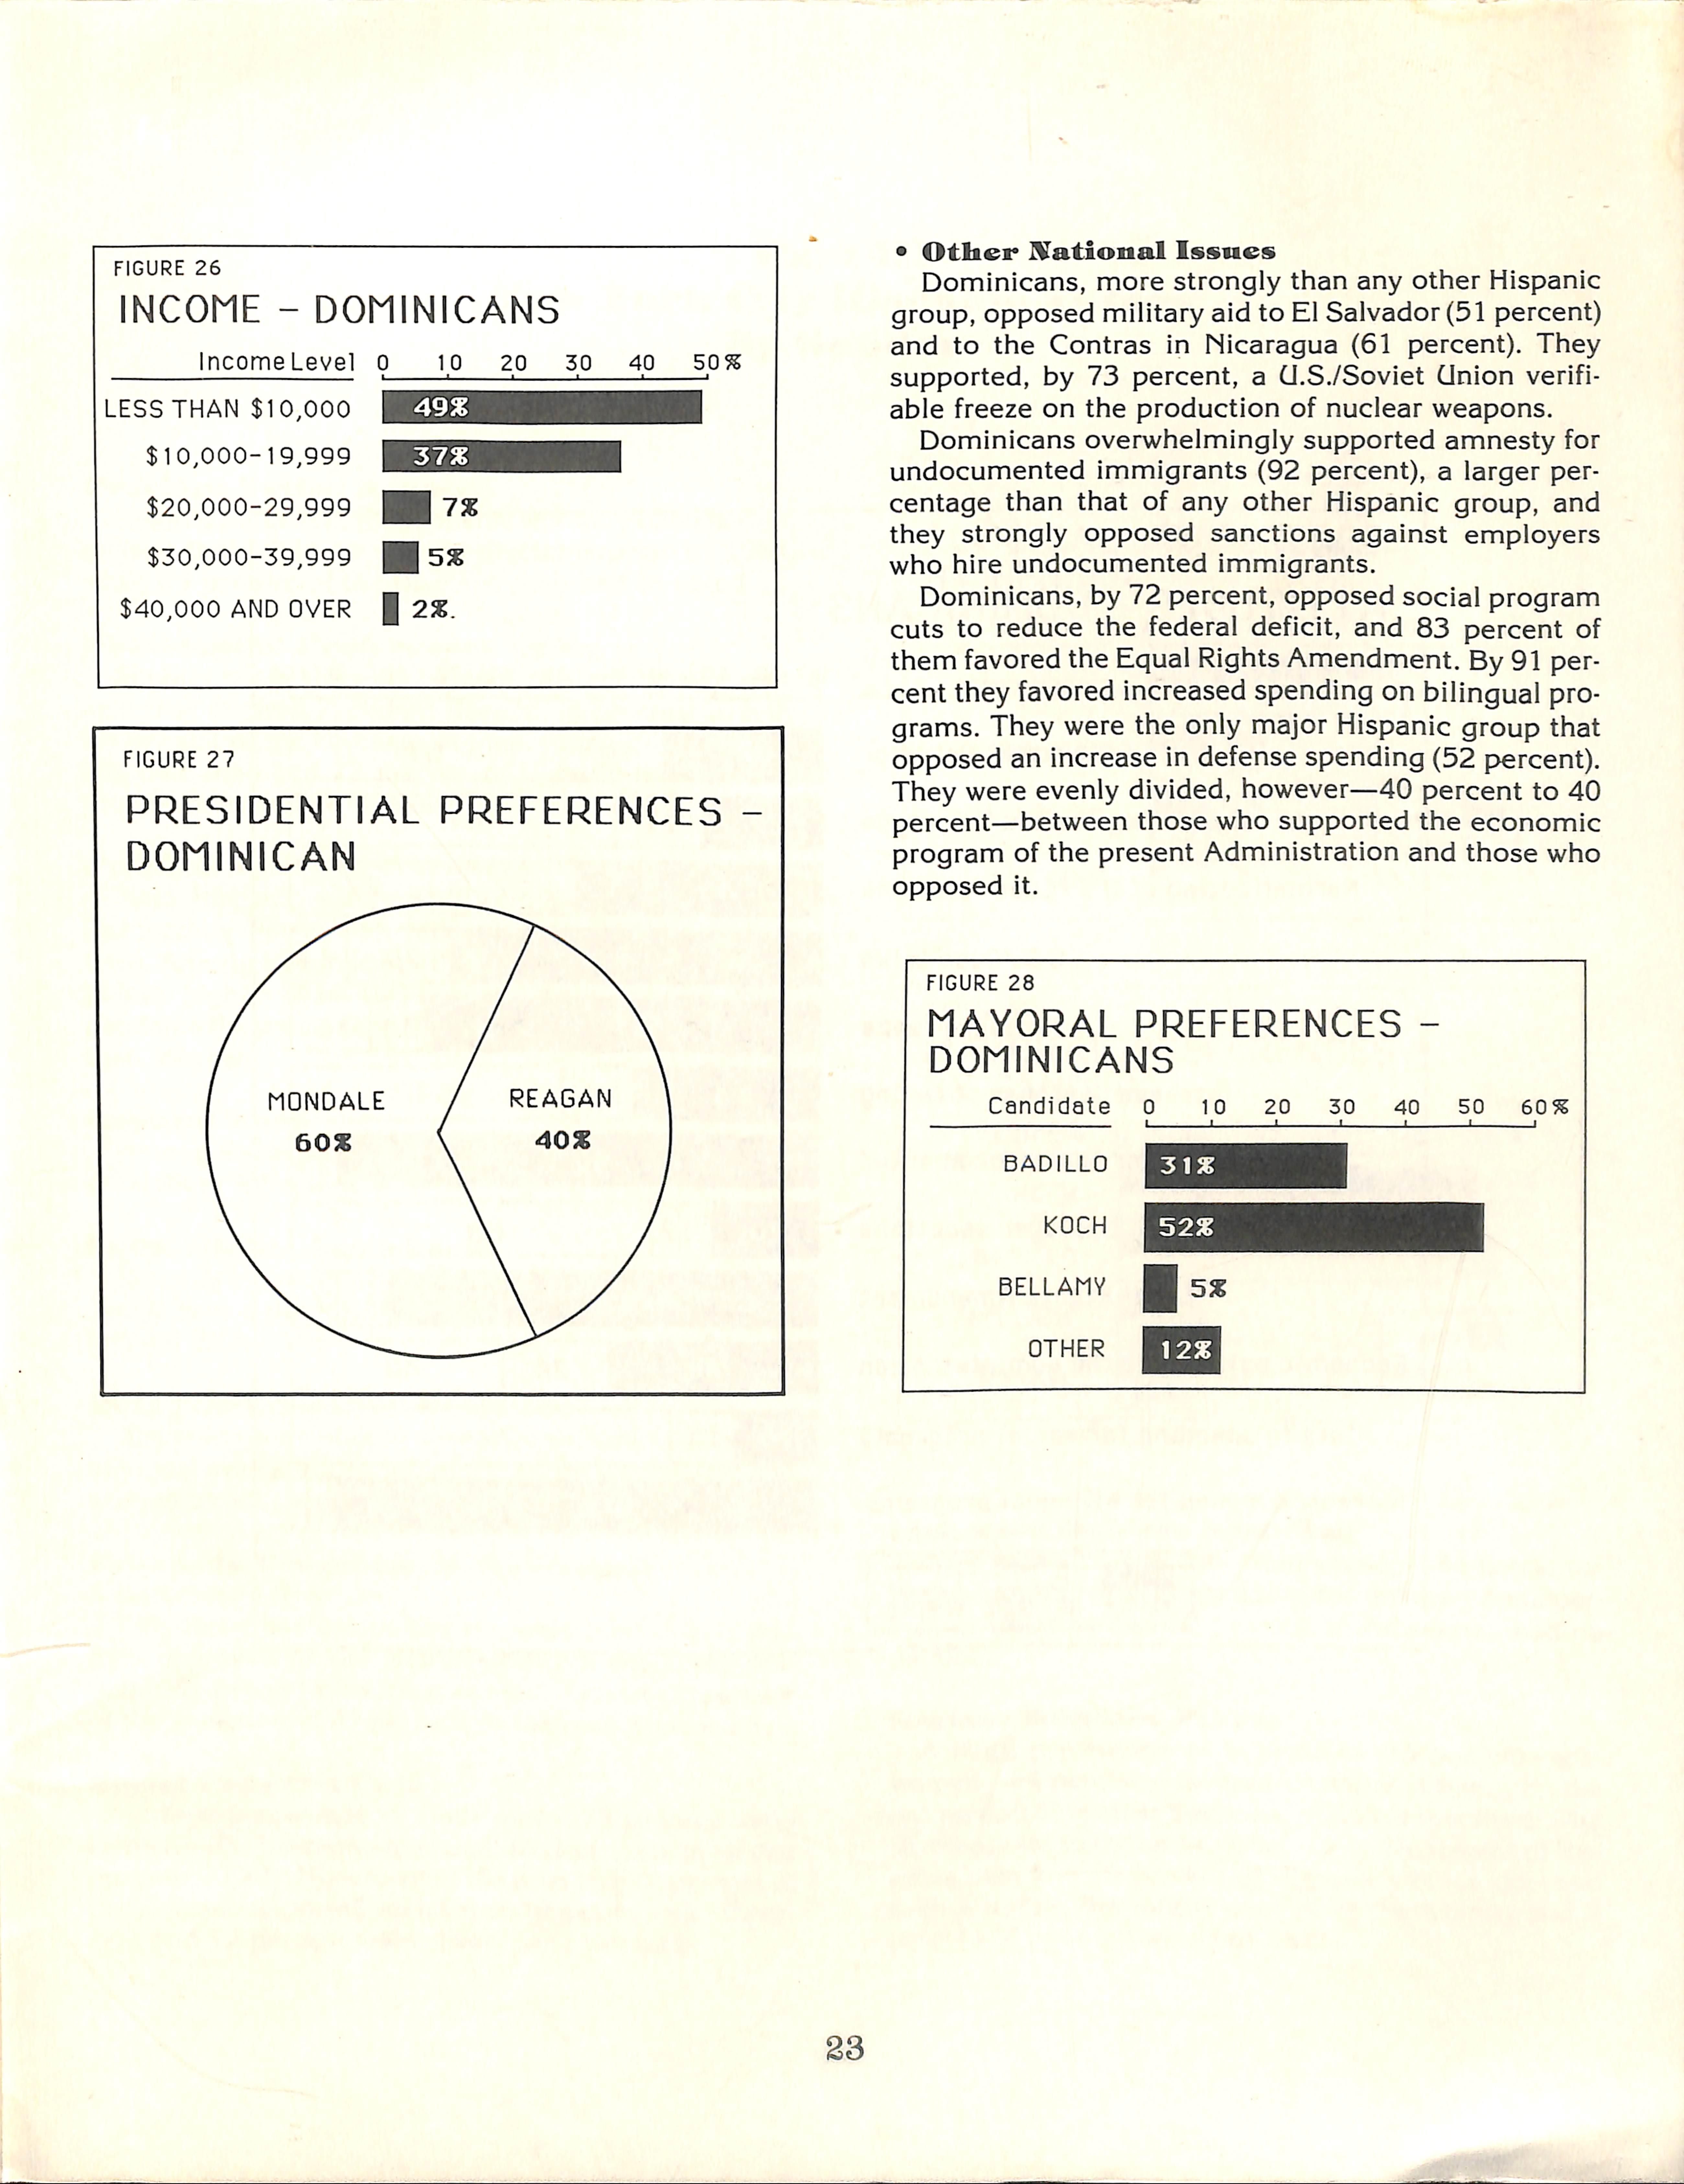
INCOME - DOMINICANS
LESS THAN $10,000
$10,000-19,999
$20,000-29,999
$30,000-39,999
$40,000 AND OVER | 1%.
FIGURE 27
PRESIDENTIAL PREFERENCES
• Oiher KTational Issnes
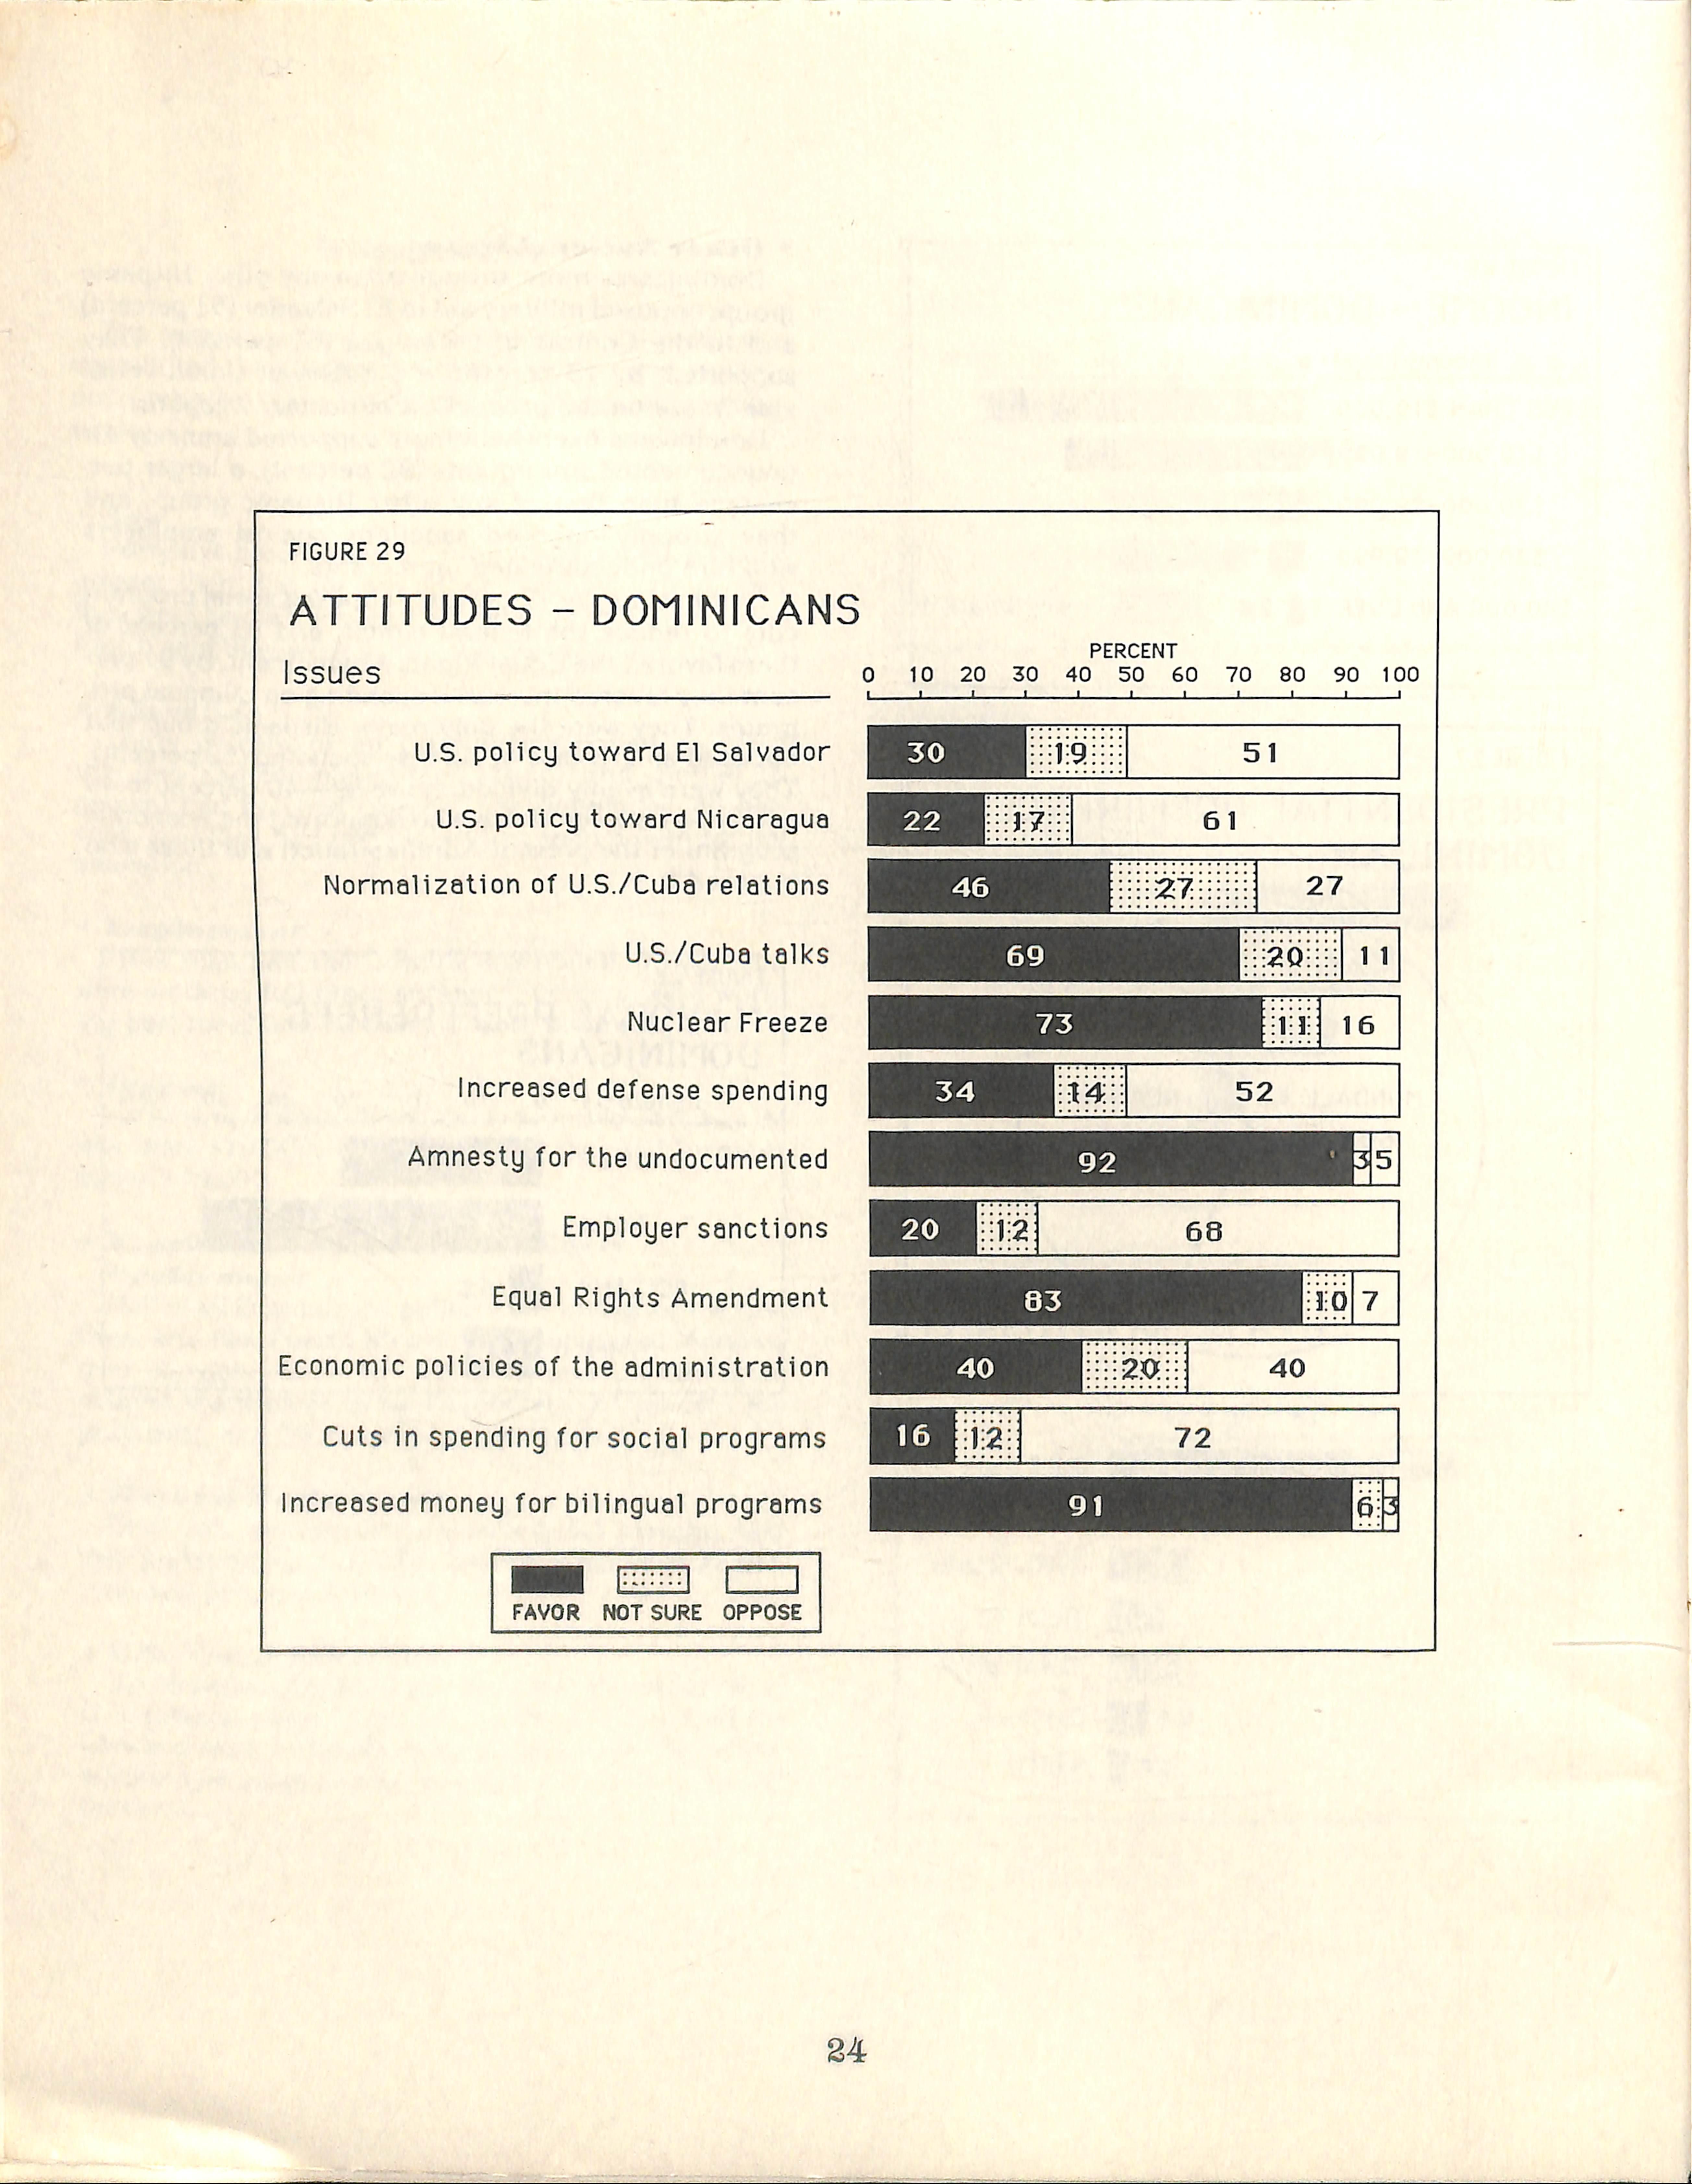
Dominicans, more strongiy than any other Híspanle group,opposed mliltary ald to El Salvador(51 percent) and to the Contras ¡n nicaragua (61 percent). They supported, by 73 percent, a CJ.S./Soviet CInlon verlflable freeze on the production of nuclear weapons.
Dominicans overwhelmlngly supported amnesty for undocumented Immlgrants(92 percent), a larger percentage than that of any other Híspanle group, and they strongiy opposed sanctlons agalnst employers who hlre undocumented Immlgrants.
Dominicans, by 72 percent, opposed social program cuts to reduce the federal déficit, and 83 percent of them favored the Equal Rlghts Amendment. By 91 percent they favored increased spending on bilingual programs. They were the only major Híspanle group that opposed an Increase In defense spending(52 percent). They were evenly dlvlded, however—40 percent to 40 percent—between those who supported the economlc program of the present Admlnlstratlon and those who opposed It.
1 FIGURE 28
MAYORAL PREFERENCESDOMINICANS
FIGURE 29
ATTITUDES - DOMINICANS
policy tovvard El Salvador
Pai«t III
JSícw Tork City Hispanic Voters
By Gendei*
Previous Voting Record
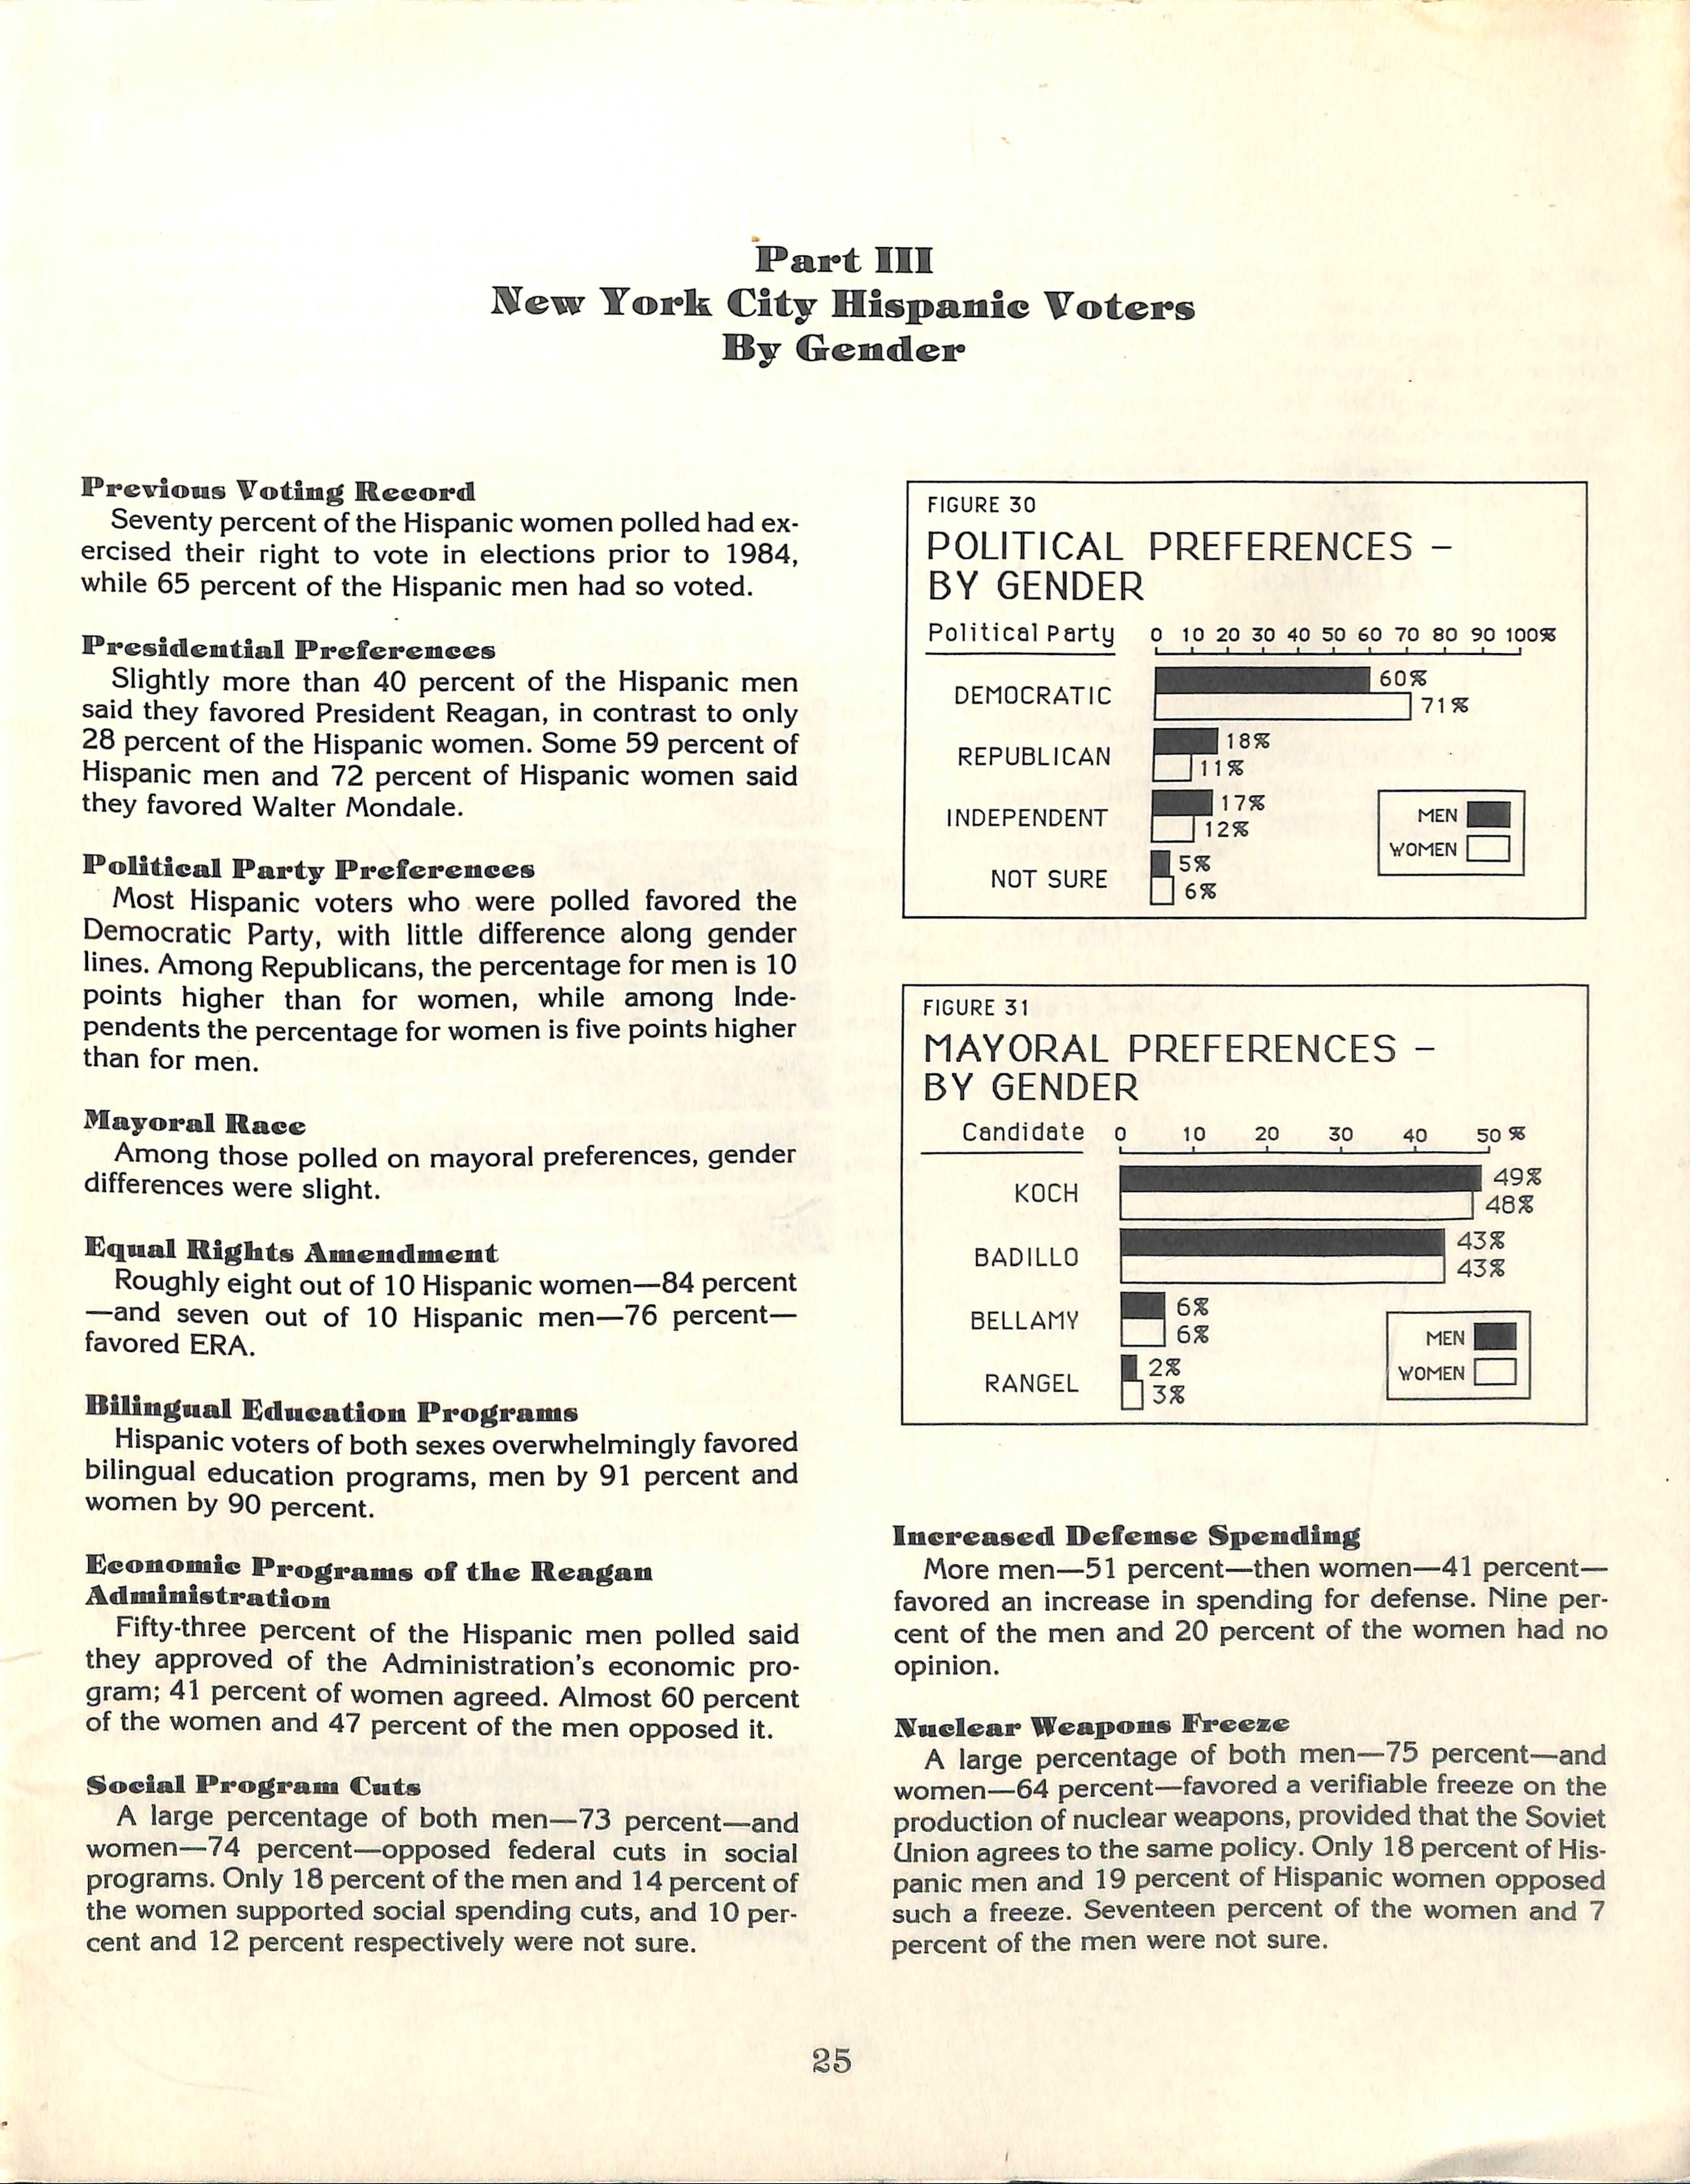
Seventy percent of the Hispanic women polled had exercised their right to vote in elections prior to 1984, while 65 percent of the Hispanic men had so voted.
Presidential Preferences
Slightly more than 40 percent of the Hispanic men said they favored President Reagan, in contrast to oniy 28 percent of the Hispanic women.Some 59 percent of Hispanic men and 72 percent of Hispanic women said they favored Walter Móndale.
Political Party Preferences
Most Hispanic voters who were polled favored the Democratic Party, wlth little difference along gender lines. Among Republicans,the percentage for men is 10 points higher than for women, while among Independents the percentage for women is five points higher than for men.
Mayoral Race
Among those polled on mayoral preferences, gender differences were slight.
Equal Riglits Amendment
Roughly eight out of 10 Hispanic women—84 percent —and seven out of 10 Hispanic men—76 percent— favored ERA.
Bilingual Education Programs
Hispanic voters of both sexes overwhelmingly favored bilingual education programs, men by 91 percent and women by 90 percent.
Economic Programs of the Reagan Administration
Fifty-three percent of the Hispanic men polled said they approved of the Administration's economic program; 41 percent of women agreed. Almost 60 percent of the women and 47 percent of the men opposed it.
Social Program Cwts
A large percentage of both men—73 percent—and women—74 percent—opposed federal cuts in social programs.Only 18 percent of the men and 14 percent of the women supported social spending cuts, and 10 percent and 12 percent respectively were not sure.
FIGURE 30
POLITICAL PREFERENCESBY GENDER
FIGURE 31
MAYORAL PREFERENCES BY GENDER
Increased Defense Spending
More men—51 percent—then women—41 percent— favored an increase in spending for defense. Mine percent of the men and 20 percent of the women had no opinión.
Auciear Weapons PrecBc
A large percentage of both men—75 percent—and women—64 percent—favored a verifiable freeze on the production of nuclear weapons, provided that the Soviet CJnion agrees to the same policy. Only 18 percent of His panic men and 19 percent of Hispanic women opposed such a freeze. Seventeen percent of the women and 7 percent of the men were not sure.
FIGURE 32
ATTITUDES BY GENDER
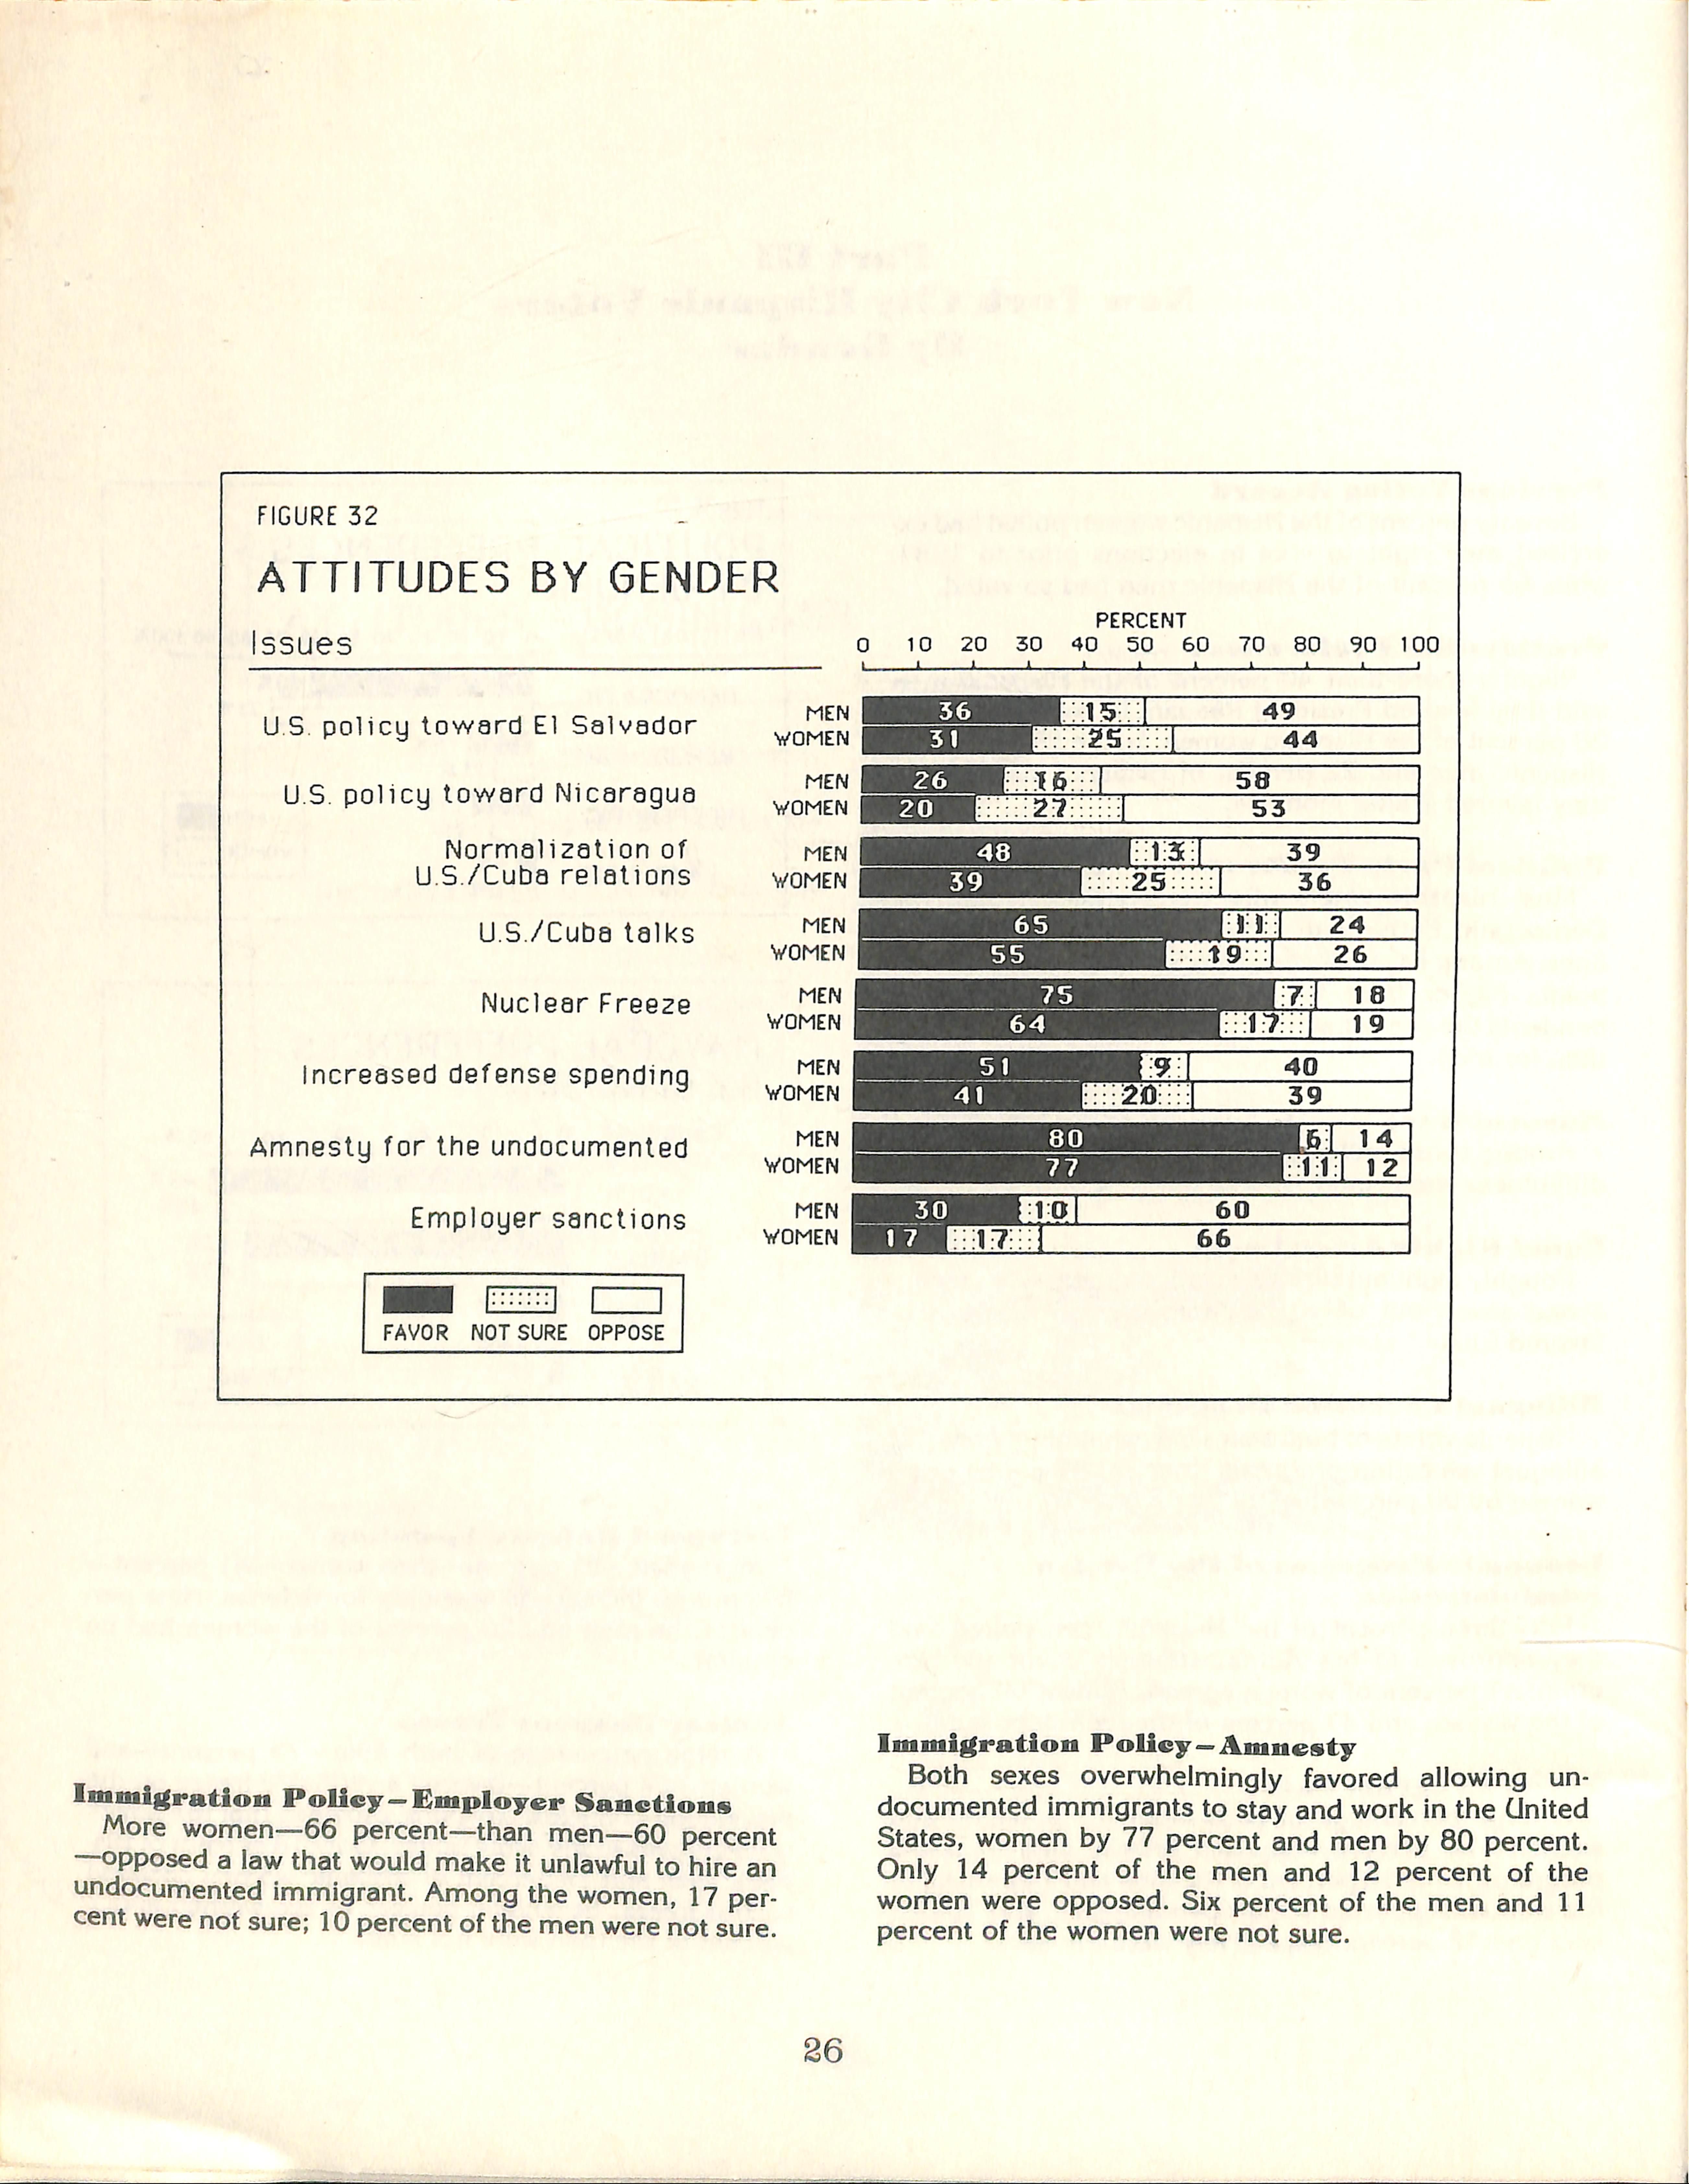
Issues
U S. policy toward El Salvador
U S. policy toward Nicaragua
Normalization of U S./Cuba relations
Nuclear Freeze
increased defense spending
Amnesly for Ihe undocumented
Employer sanctions
Immigration PoUcy-Employ«r Sanetions
More women—66 percent—than men—60 percent —opposed a law that would make it unlawful to hire an undocumented immigrant. Among the women, 17 per- cent were not sure; 10 percent of the men were not sure.
Immigration Policy—Amnesty
Both sexes overwhelmingly favored allowlng un documented immlgrants to stay and work in the CJnlted States, women by 77 percent and men by 80 percent. Oniy 14 percent of the men and 12 percent of the women were opposed. Slx percent of the men and 11 percent of the women were not sure.
Aid to El Salvador
A total of 49 percent of men and 44 percent of women opposed mllitary aid to the government of El Salvador; 36 percent of men and 31 percent of women favored it. One fourth of all women and 15 percent of the men had no oplnion.
Aid to Contras in Aicaragua
More men than women opposed giving more military aid to the Contras in Nicaragua, men by 58 percent and women by 53 percent. But 27 percent of the women and 16 percent of the men were not sure.
IT.S./Cuban Relatious
More men than women favored the normalization of CJ.S./Cuban relations, men by 48 percent and women by 39 percent; 25 percent of the women and 13 percent of the men were not sure.
U.S./Cnba Taiks
More men—65 percent—than women—55 percent —also favored the initiation of Ci.S. talks with Cuba about travel, immigration, and the like. But more women—19 percent—than men—11 percent—had no Opinión on this issue.
Demographic Characteristics
With the exception of employment and income (see below), there is little difference by gender in the demographic characteristics of the Hispanic voters polled.
Ori^in
Among those polled, 73 percent of the men and 72 percent of the women had not been born in the con tinental ünited States.
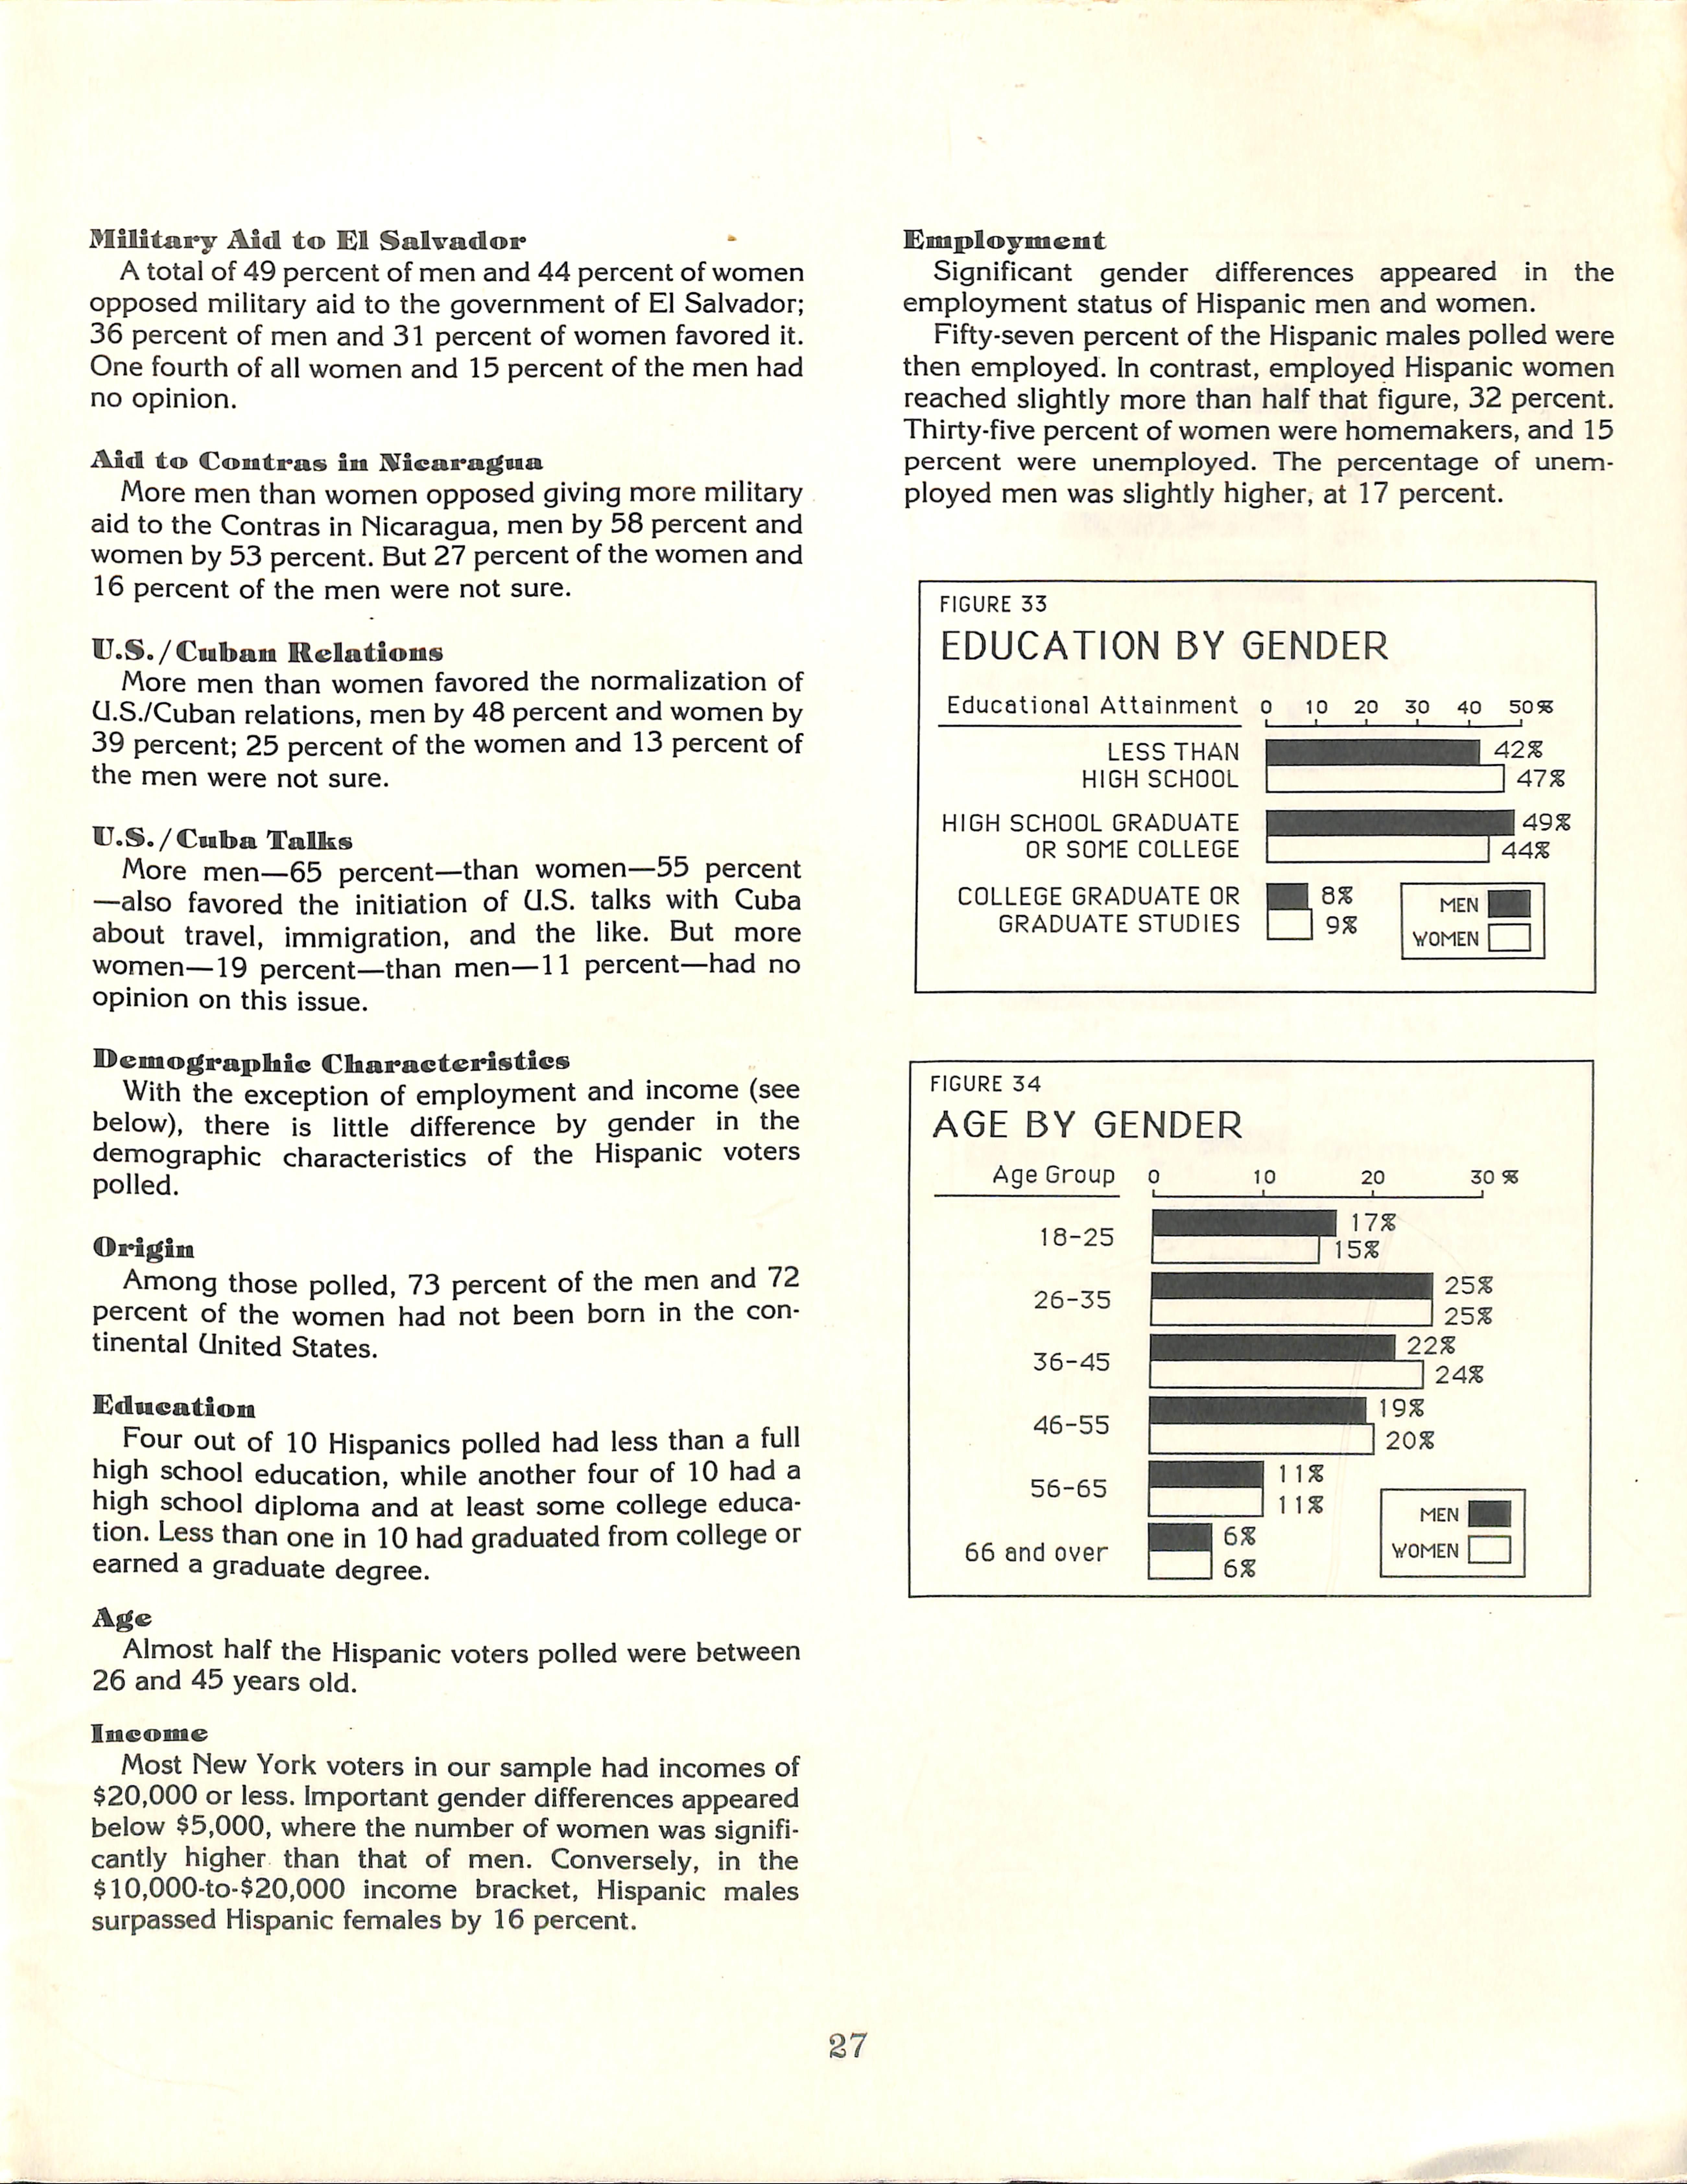
Education
Four out of 10 Híspanles polled had less than a full high school education, while another four of 10 had a high school diploma and at least some college educa tion. Less than one in 10 had graduated from college or earned a gradúate degree.
Age
Almost half the Hispanic voters polled were between 26 and 45 years oíd.
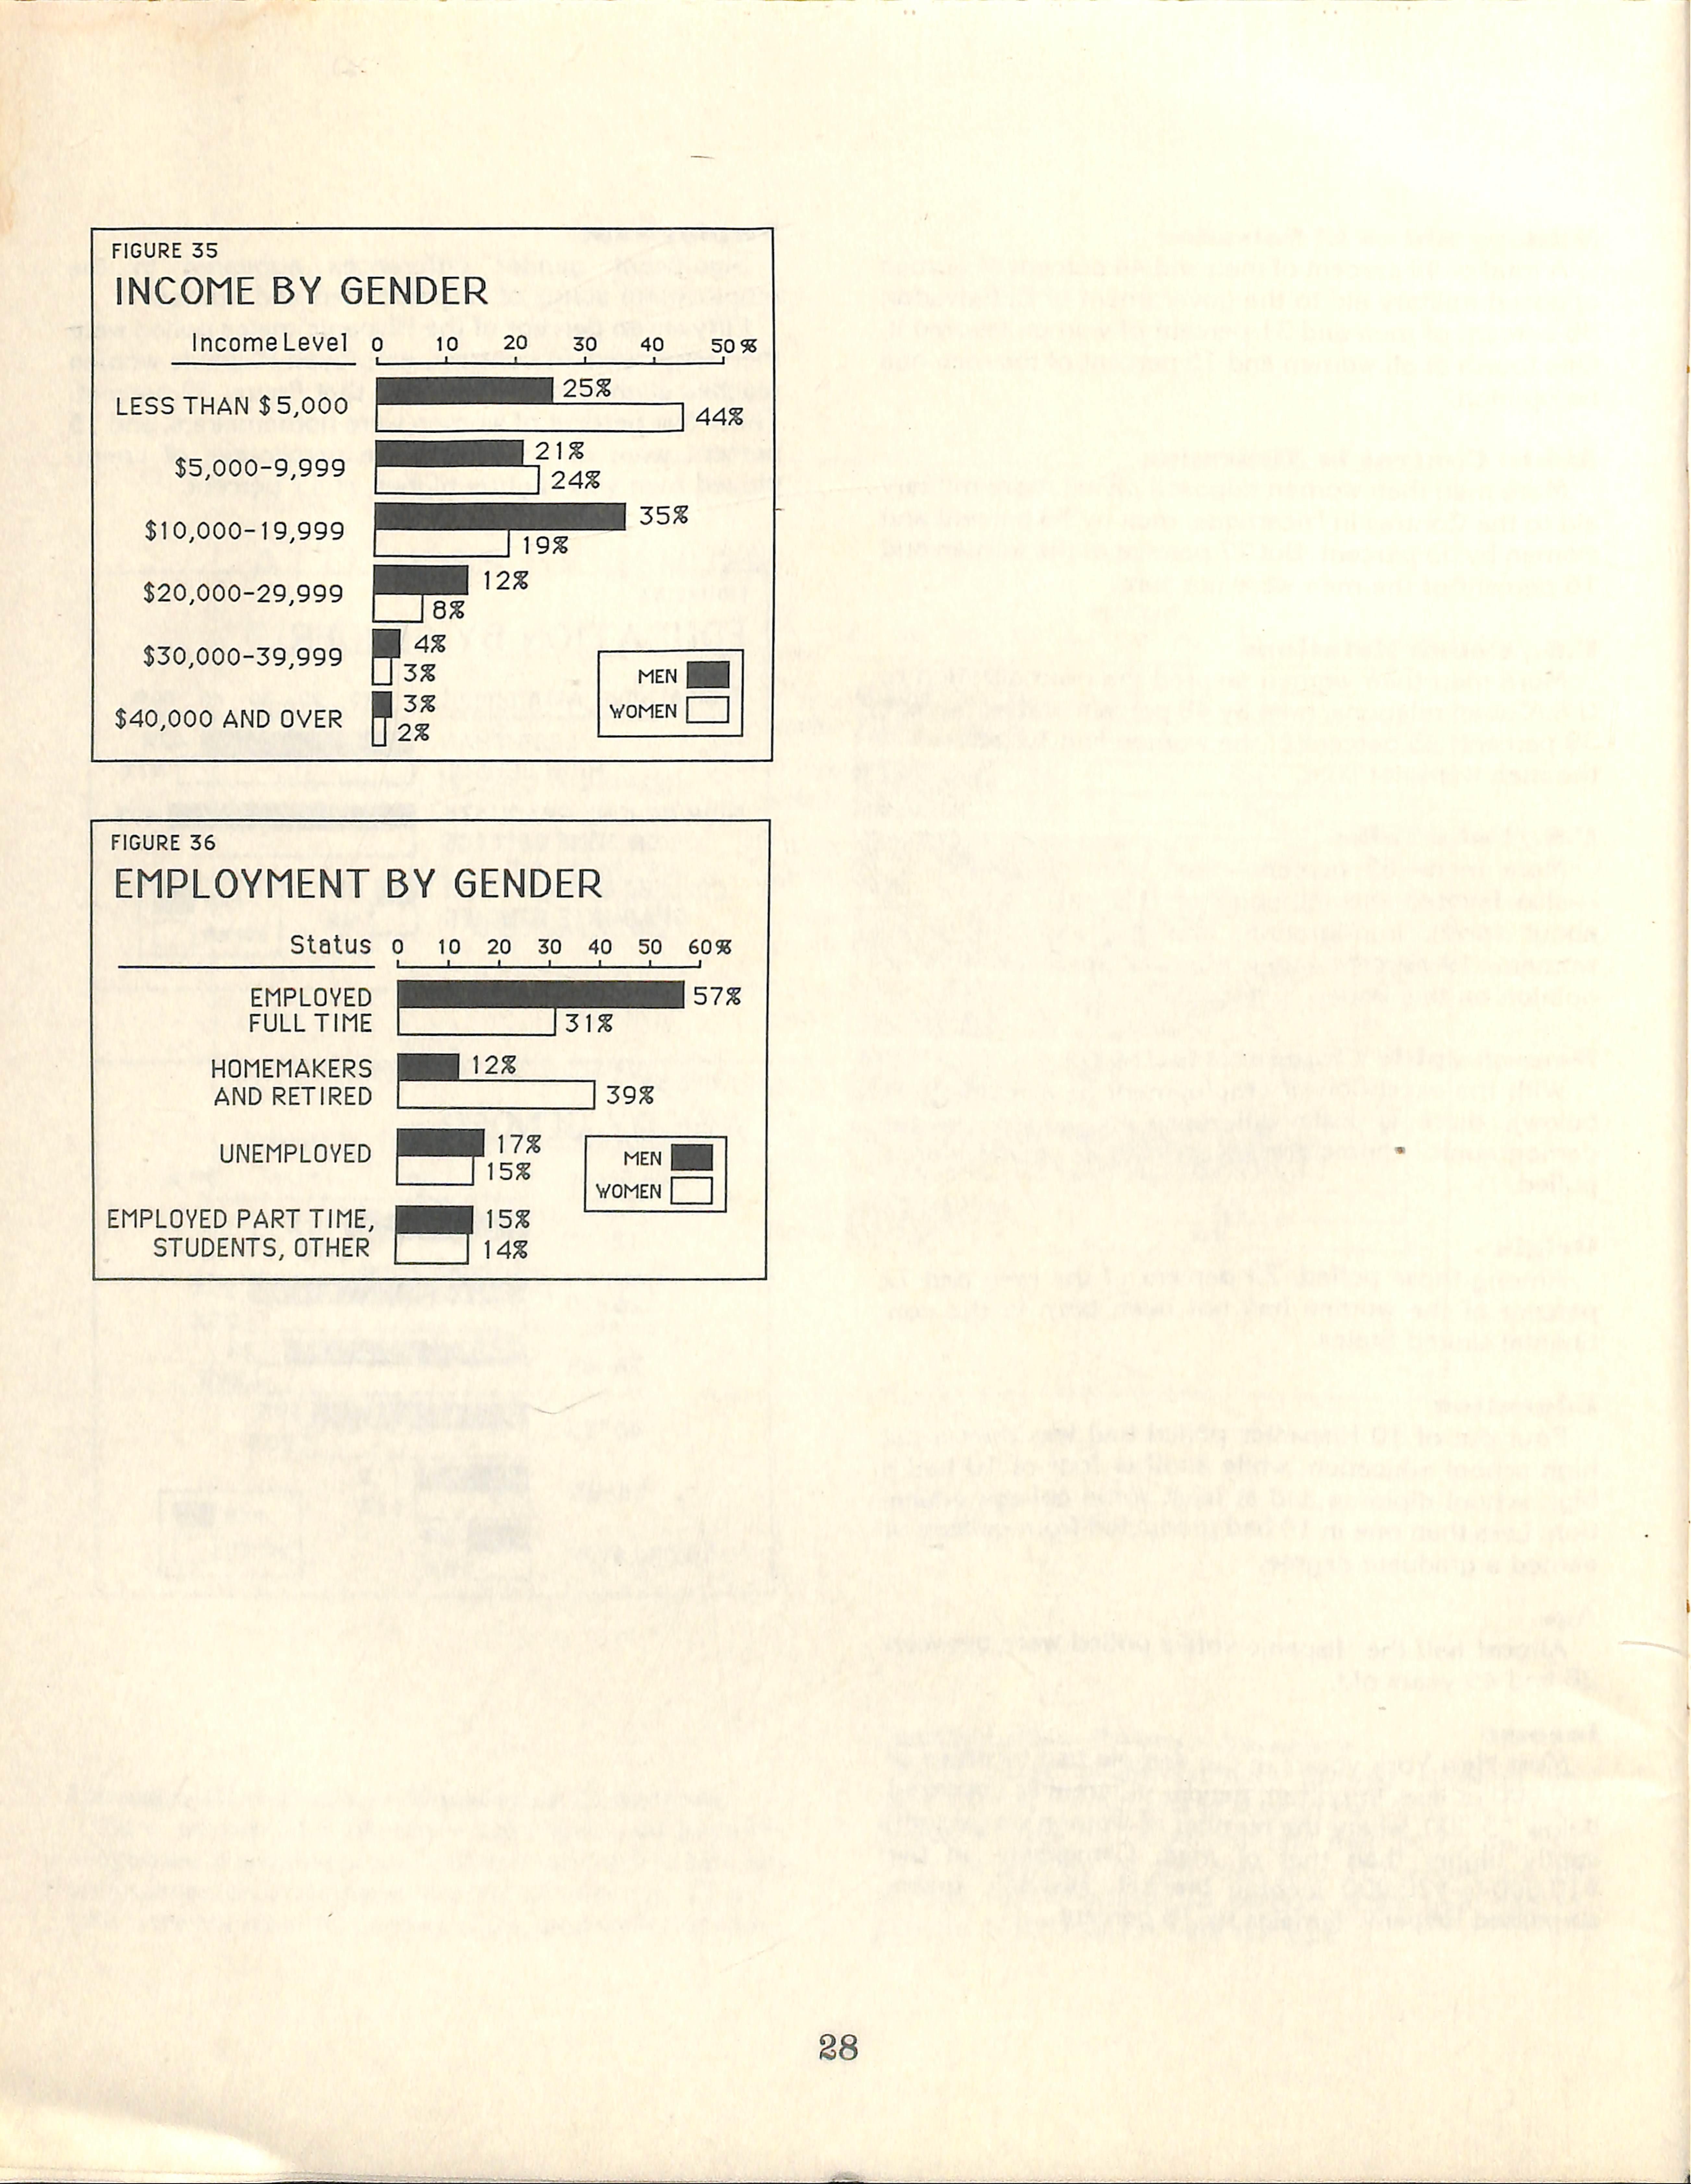
Income
Most New York voters in our sample had incomes of $20,000 or less. Important gender differences appeared below $5,000, where the number of women was significantly higher than that of men. Conversely, in the $10,000-to-$20,000 income bracket, Hispanic males surpassed Hispanic females by 16 percent.
Employment
Significant gender differences appeared in the employment status of Hispanic men and women. Fifty-seven percent of the Hispanic males polled were then employed. In contrast, employed Hispanic women reached slightly more than half that figure, 32 percent. Thirty-five percent of women were homemakers,and 15 percent were unemployed. The percentage of unemployed men was slightly higher, at 17 percent.
EDUCATION BY GENDER
Educational Attainment
LESS THAN HIGH SCHOOL
HIGH SCHOOL GRADUATE OR SOME COLLEGE
COLLEGE GRADUATE OR GRADUATE STUDIES
FIGURE 34
AGE BY GENDER
FIGURE 33
INCOME BY 6ENDER
LESS THAN $5,000
$5,000-9,999
$10,000-19,999
$20,000-29,999
$30,000-39,999 [1^
$40,000 AND OVER J
EMPLOYMENT BY GENDER
FIGURE 36
Appendix:
Xlie Urew York
Standard Metropolitan Statistical Area
The information on the next four pages was taken directly from The Híspanle Almanac, published by Hispanic Pollcy Development Project in 1984.
The SMSA—Standard Metropolitan Statistical Area—is a statistical standard, defined by the Office of Management and Budget, and developed for federal agencies producing, analyzing, and publishing data on metropolitan areas.
The ADI—Area of Dominant Influence—is determinad by the televisión coverage through which goods and services for sale are advertised. The ADI is a geographic area that defines a televisión market, based on measurable viewing patterns.
CTI is Comprehensiva Technologies International, the market research firm which developed the data for The Hispanic Almanac.
NEW YORK
THE NEW YORK,NEW YORK SMSA*
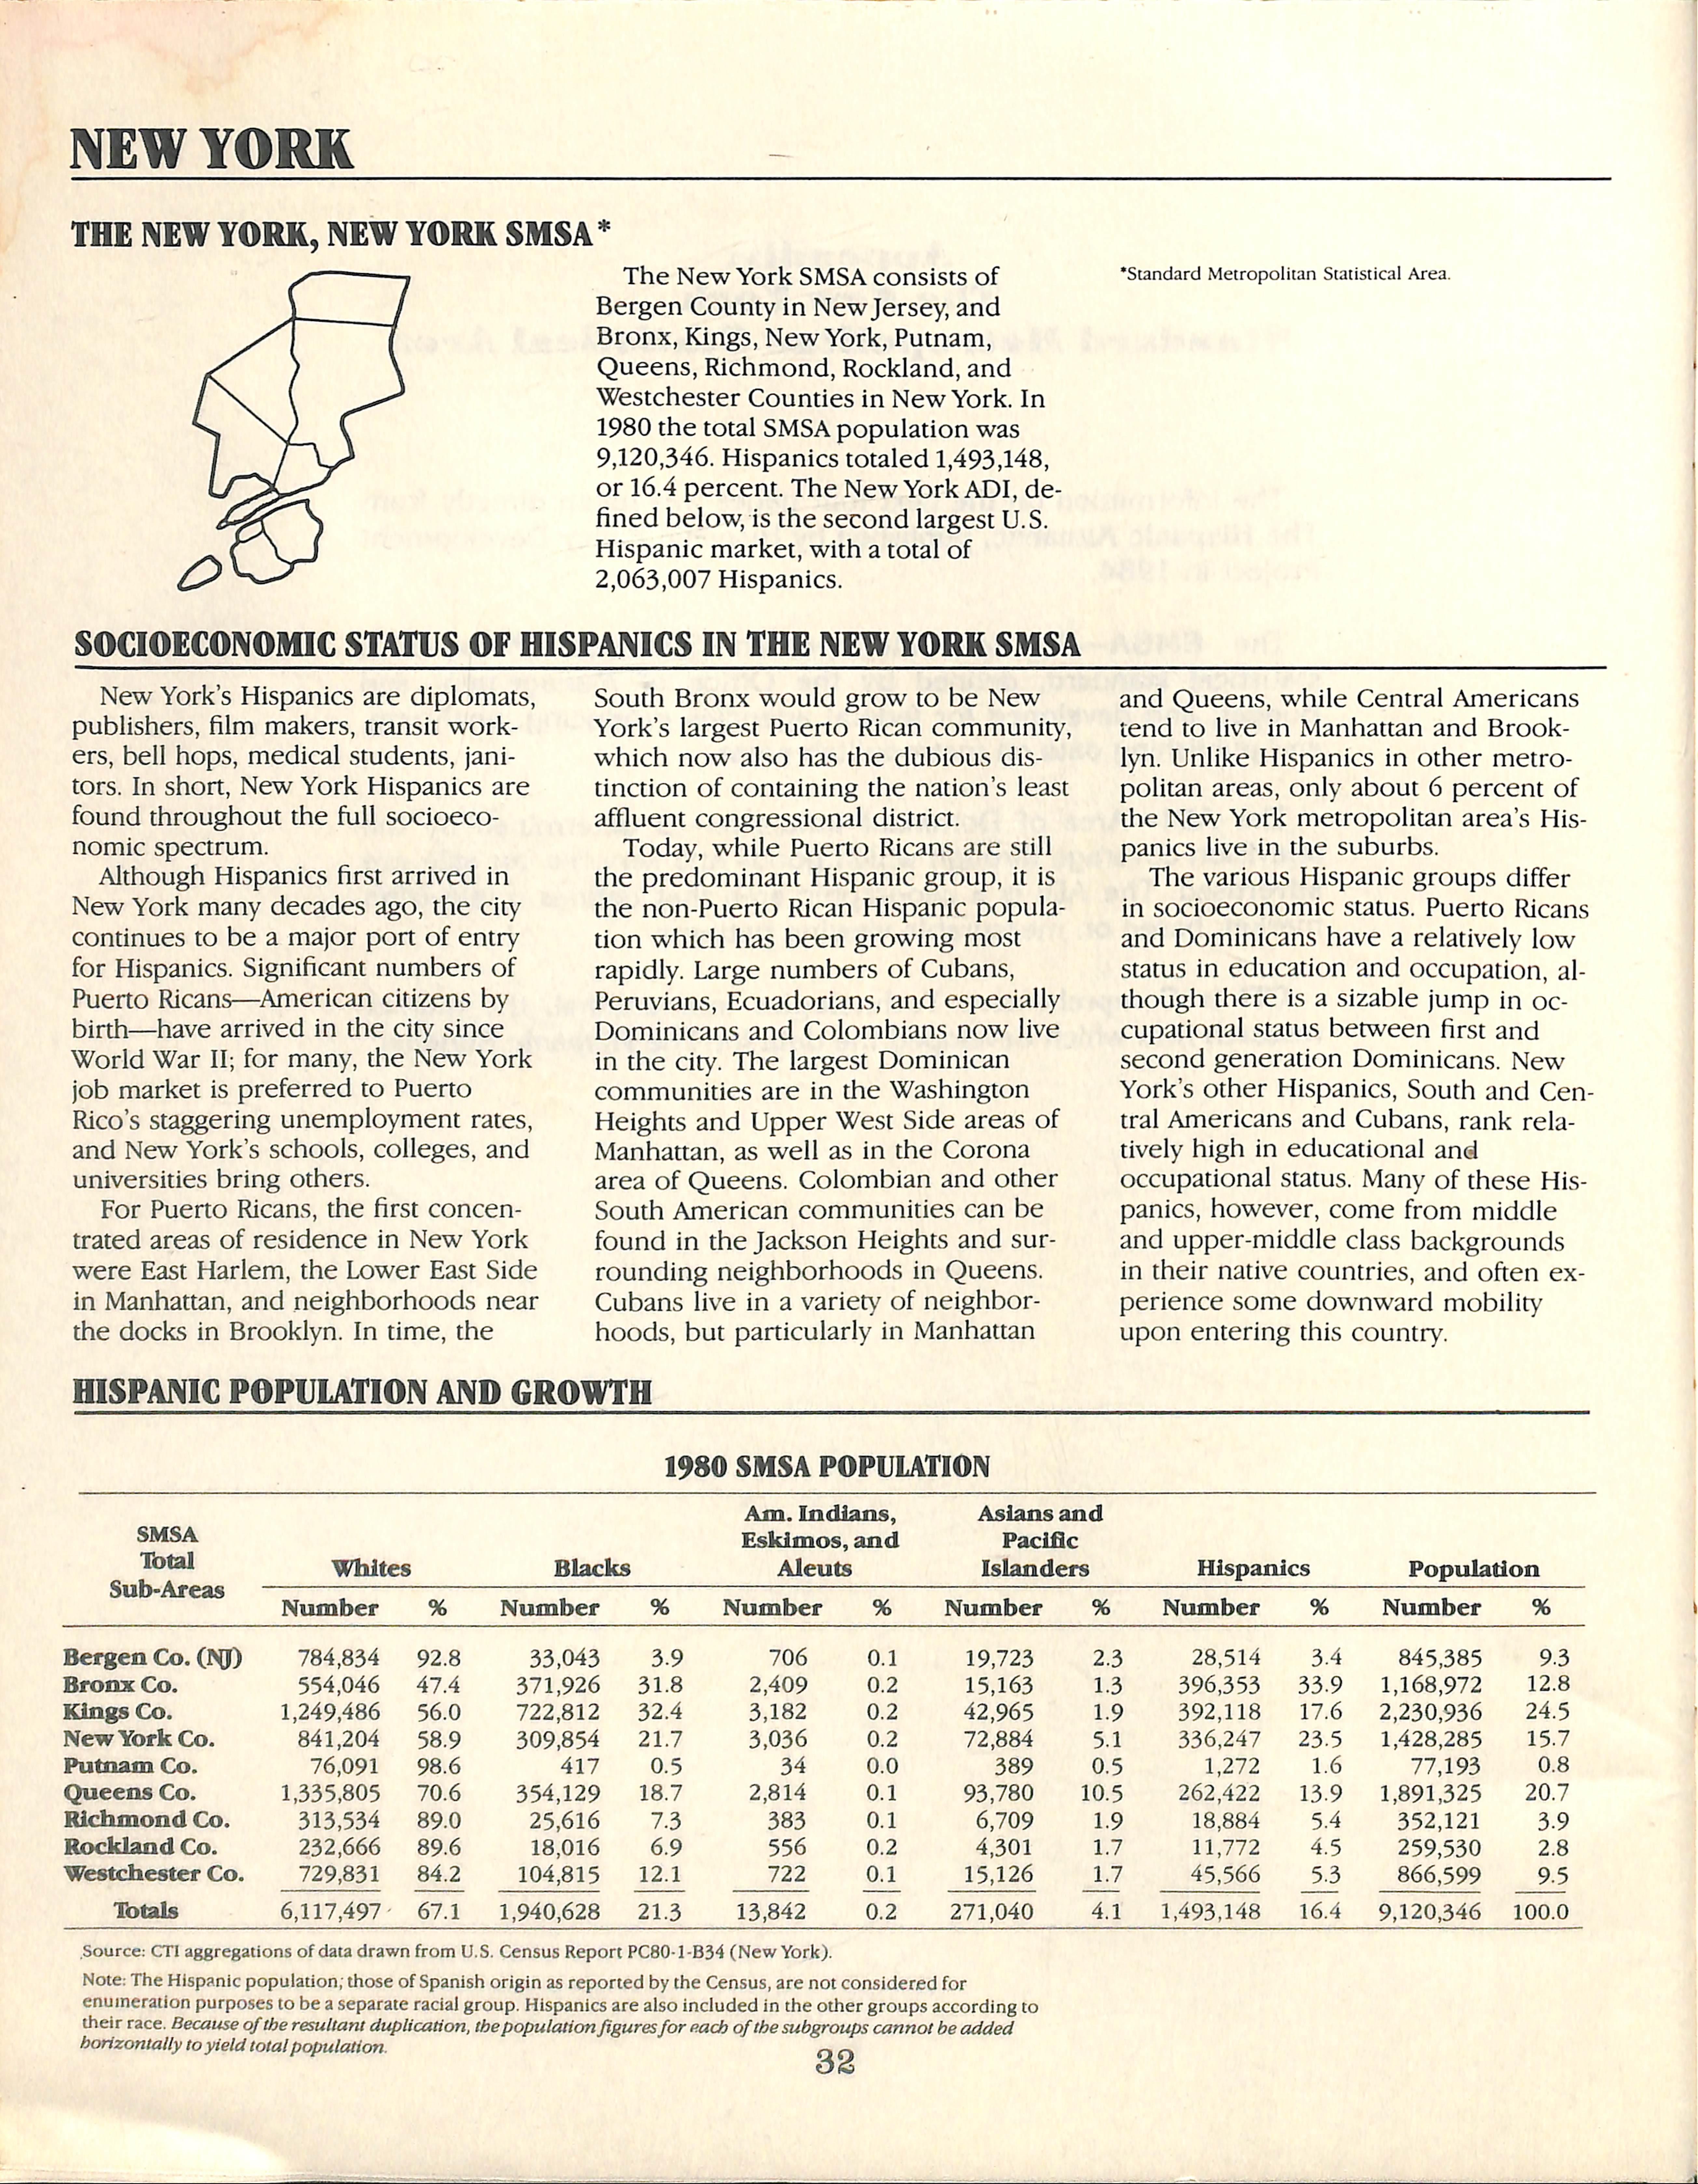
The New York SMSA consists of Bergen County in New Jersey, and Bronx,Kings, New York,Putnam, Queens,Richmond,Rockland,and Westchester Counties in New York. In 1980 the total SMSA population was 9,120,346. Híspanles totaled 1,493,148, or 16.4 percent. The New York ADI,defined below,is the second largest U.S. Híspanle market, wíth a total of 2,063,007 Híspanles.
SOGIOECONOmC STATUS OF HISPANICS IN THE NEW YORK SMSA
New York's Híspanles are diplomats, publíshers, film makers, translt workers, bell hops, medical students, janítors. In short, New York Híspanles are found throughout the full soeíoeeonomíe spectrum.
Although Híspanles first arrlved ín New York many deeades age, the cíty continúes to be a major port of entry for Hispanics. Signífieant numbers of Puerto Ricans—^Amerlcan cítízens by bírth—have arrlved In the cíty slnce World War II; for many, the New York job market Is preferred to Puerto Rico's staggerlng unemployment rates, and New York's schools, colleges, and unlversltles brlng others.
For Puerto Ricans, the first concentrated areas of residence in New York were East Harlem, the Lower East Slde in Manhattan, and neighborhoods near the docks in Brooklyn. In time, the
South Bronx would grow to be New York's largest Puerto Rlean eommunlty, whlch now also has the dublous dlstlnctlon of eontalnlng the natlon's least affluent congresslonal dlstrlet. Today, whlle Puerto Ricans are stlll the predomlnant Híspanle group, it is the non-Puerto Rlcan Híspanle popula tion whleh has been growlng most rapldly. Large numbers of Cubans, Peruvlans, Eeuadorlans, and espeelally Domlnleans and Colombians now Uve in the elty. The largest Dominlean eommunltles are in the Washington Helghts and Upper West Slde areas of Manhattan, as well as in the Corona area of Queens. Colomblan and other South Amerlean eommunltles can be found in the Jaekson Helghts and surroundlng neighborhoods in Queens. Cubans Uve in a varlety of neighbor hoods, but partleularly in Manhattan
mSPANIC POPULATION AND GROWTH
1980 SMSA POPULATION
Source: CTI aggregations of data drawn from U.S. Census Repon PC80-1-B34(New York).
Note;The Hispanic population,those of Spanish origin as reponed by the Census,are not considered for enumeration purposes to be a sepárate racial group. Hispanics are also included in the other groups according to their race. Becauseoftheresultant duplication,thepopulaiionfiguresfor fíach ofthesubgroupscannot be added horizontally toyield tota!population. q q
and Queens, whlle Central Amerleans tend to Uve in Manhattan and Brook lyn. Unllke Híspanles in other metro politan areas, only about 6 pereent of the New York metropolitan area's Hís panles Uve in the suburbs.
The varlous Híspanle groups dlffer in soeloeeonomle status. Puerto Rleans and Domlnleans have a relatively low status in edueatlon and oeeupation, al though there Is a slzable jump In oeeupatlonal status between first and seeond generation Domlnleans. New York's other Híspanles, South and Cen tral Amerleans and Cubans, rank rela tively hlgh In edueatlonal and oeeupatlonal status. Many of these Hís panles, however, come from mlddle and upper-middle elass baekgrounds In thelr native eountrles, and often experienee some downward moblllty upon entering this eountry.
The 1,493,148 Hispanics living in the New York SMSA are higKly concentrated in Bronx, Kings, New York and Queens Counties, Hispanics represen! the second largest minority population subgroup, behind only the SMSA's Black population of 1,940,628.
While the New York population has begun to decrease,the Hispanic popu lation continúes to increase due to fertility and migration from Latin Amér ica, Puerto Rico, and other parts of the U.S. As the Growth Projections chart shows, Hispanics are the fastest growing subgroup in the SMSA, increasing at the rate of 2.0 percent per year; This is more than double the rate of increase in the Black population and is panicularly impressive considering that the SMSA's White and total populations decreased from 1970 to 1980. If these growth rates continué, the His panic population will reach 1,638,933 in 1985, and 1,784,718 or 21.4 percent of the total population by 1990. It also should be noted that, for the reasons discussed below, these estimates could be as much as 11 percent too low.
The majority(59.8 percent)of the New York SMSA's Hispanic population are Puerto Rican. Other Spanish (337 percent), those of Cuban ancestry (4.8 percent), and those of Mexican ances try (1.8 percent) round out the New York Hispanic population.
The Hispanics of the New York SMSA
AGE AND SEX DISTRIBUTIONS
The Hispanic population ofthe New York SMSA is youthful. This is due to the greater fertility of Hispanics as well as continued immigration from the Caribbean and Latin América which has particularly increased the number of those aged 10-24. Moreover,in the past decade or so,there has been a return migration ofolder Puerto Ricans to the island, while the intermittent move-
1985-1990 POPUUTION GROWTH PROJECTIONS
Percentages Denote Growth Rates Established Between 1970 and 1980.
Data Points and Corresponding Numbers Document Projected or Actual Populations at a Given Point in Time.
100%
Hispanics—1,249,212
Blacks—1,791,336
Whites—7,992,004
Total—<3 073,577
2.0% Hispanic Population Growth Per Year 1,784,718
0.8% Black Population Growth Per Year 2,102,327 2.3% White Population Decrease Per Year '4,682,651
8,340,108
Source: CTI projections from 1970 and 1980 Census data. Census sources include:1970 counts of Hispanics and total population—"Suppiementary Report,Persons ofSpanish Ancestry";1970 counts of Whites and Blacks—Stateand Metropolitan Area Data Book 1982; and 1980 counts—U.S. Census Report PC80-1-B34(New York).
were reponed by the Census to be mostly concentrated within the "other races" category (47.6 percent); 46.1 percent and 6.3 percent were reported
ment of young Puerto Rican adults from the island to the mainland has continued,due to employment and family concerns. Relativo to the total population of the SMSA, the youthfulness of the Hispanic population is par ticularly striking in the under-25 age groups;49.3 percent of all Hispanics in the SMSA are under 25,compared to 36.5 percent ofthe total population.
within the White and Black racial groups respectively.
1,493,148
100% exaaly.
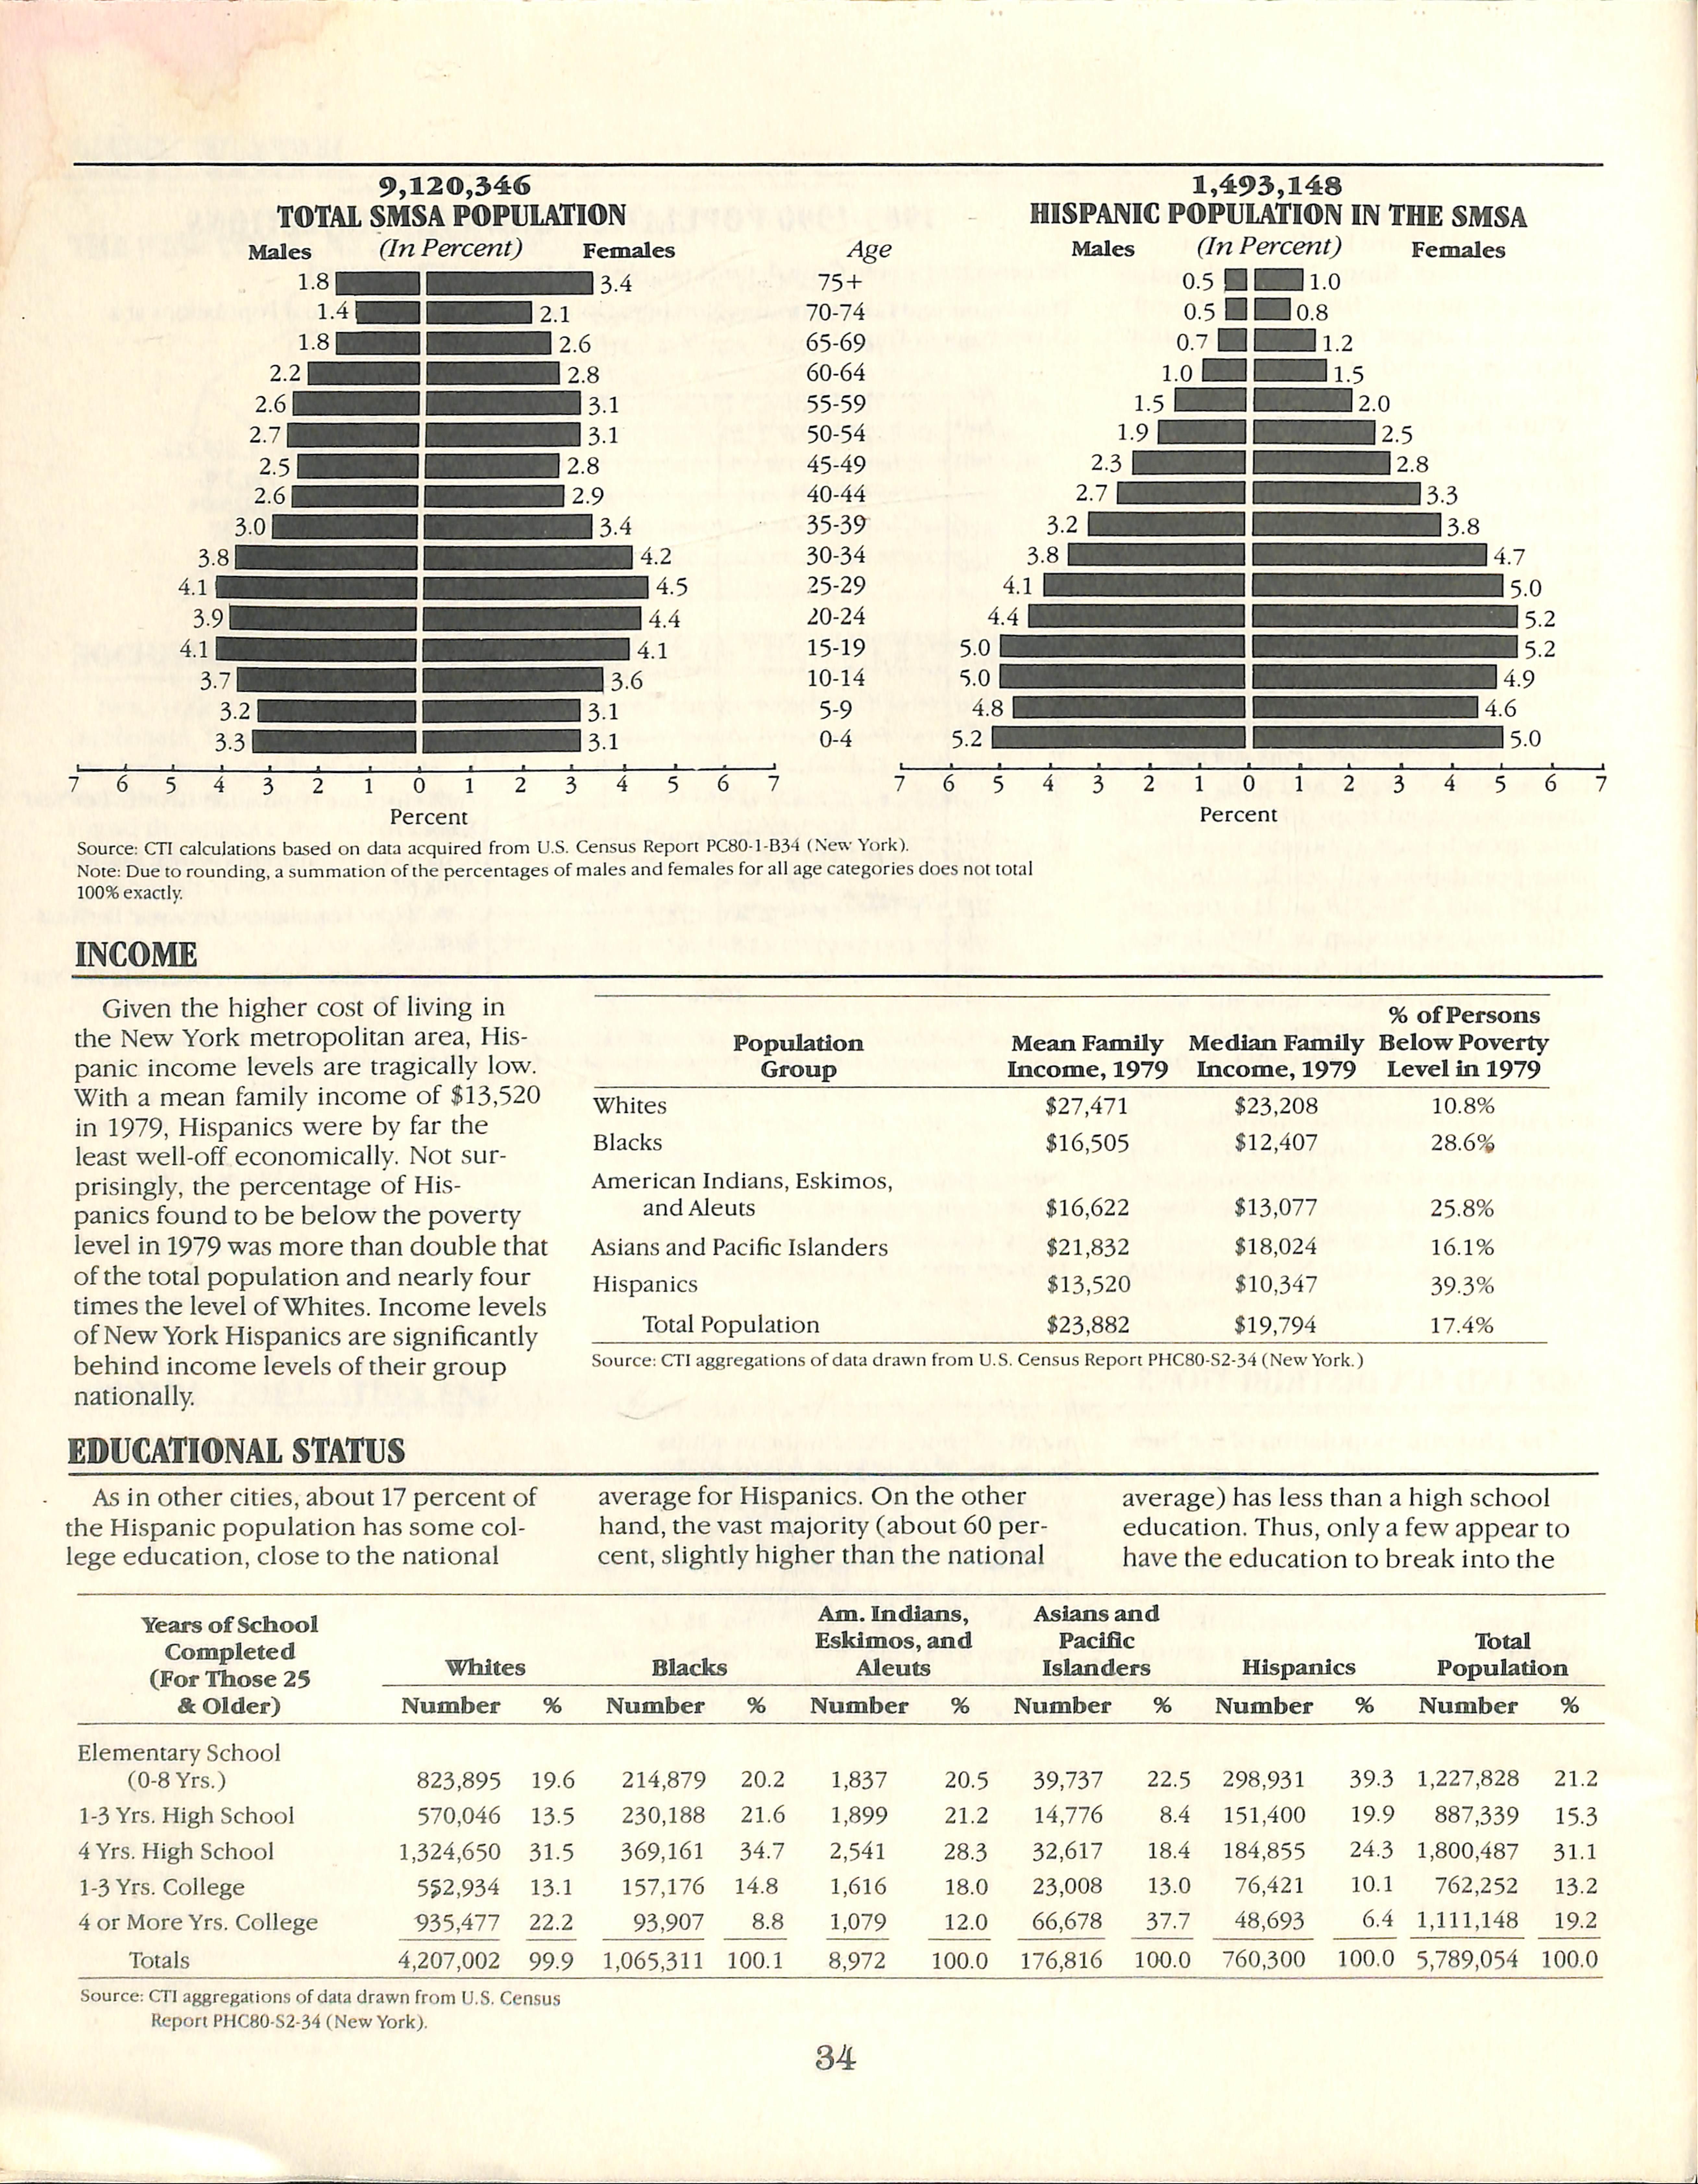
INCOME
Given the higher cost of living in the New York metropolitan area, Hís panle income levels are tragically low. With a mean family income of $13,520 in 1979, Híspanles were by far the least well-off eeonomieally. Not surprisingly, the pereentage of Hispanies found to be below the poverty level in 1979 was more than double that ofthe total population and nearly four times the level ofWhites. Ineome levels ofNewYork Híspanles are signifieantly behind ineome levels oftheir group nationally.
EDUCATIOIVAL STATUS
As in other eities, about 17 percent of the Hispanie population has some eollege edueation, elose to the national
Source: CTI aggregations ofdata drawn from U.S. Census Repon PHC80-S2-34 (New York.)
1-3 Yrs.
Source: CTI aggregations ofdata drawn from U.S. Census Report PHC80-S2-34 (New
average for Híspanles. On the other hand, the vast majority (about 60 percent, slightly higher than the national
average) has less than a high sehool edueation. Thus, only a few appear to have the edueation to break into the
white collar occupations where wages are relatively high. Overall, the Hís panles of New York lag behind the
THE USE OF SPANISH LANGUAGE
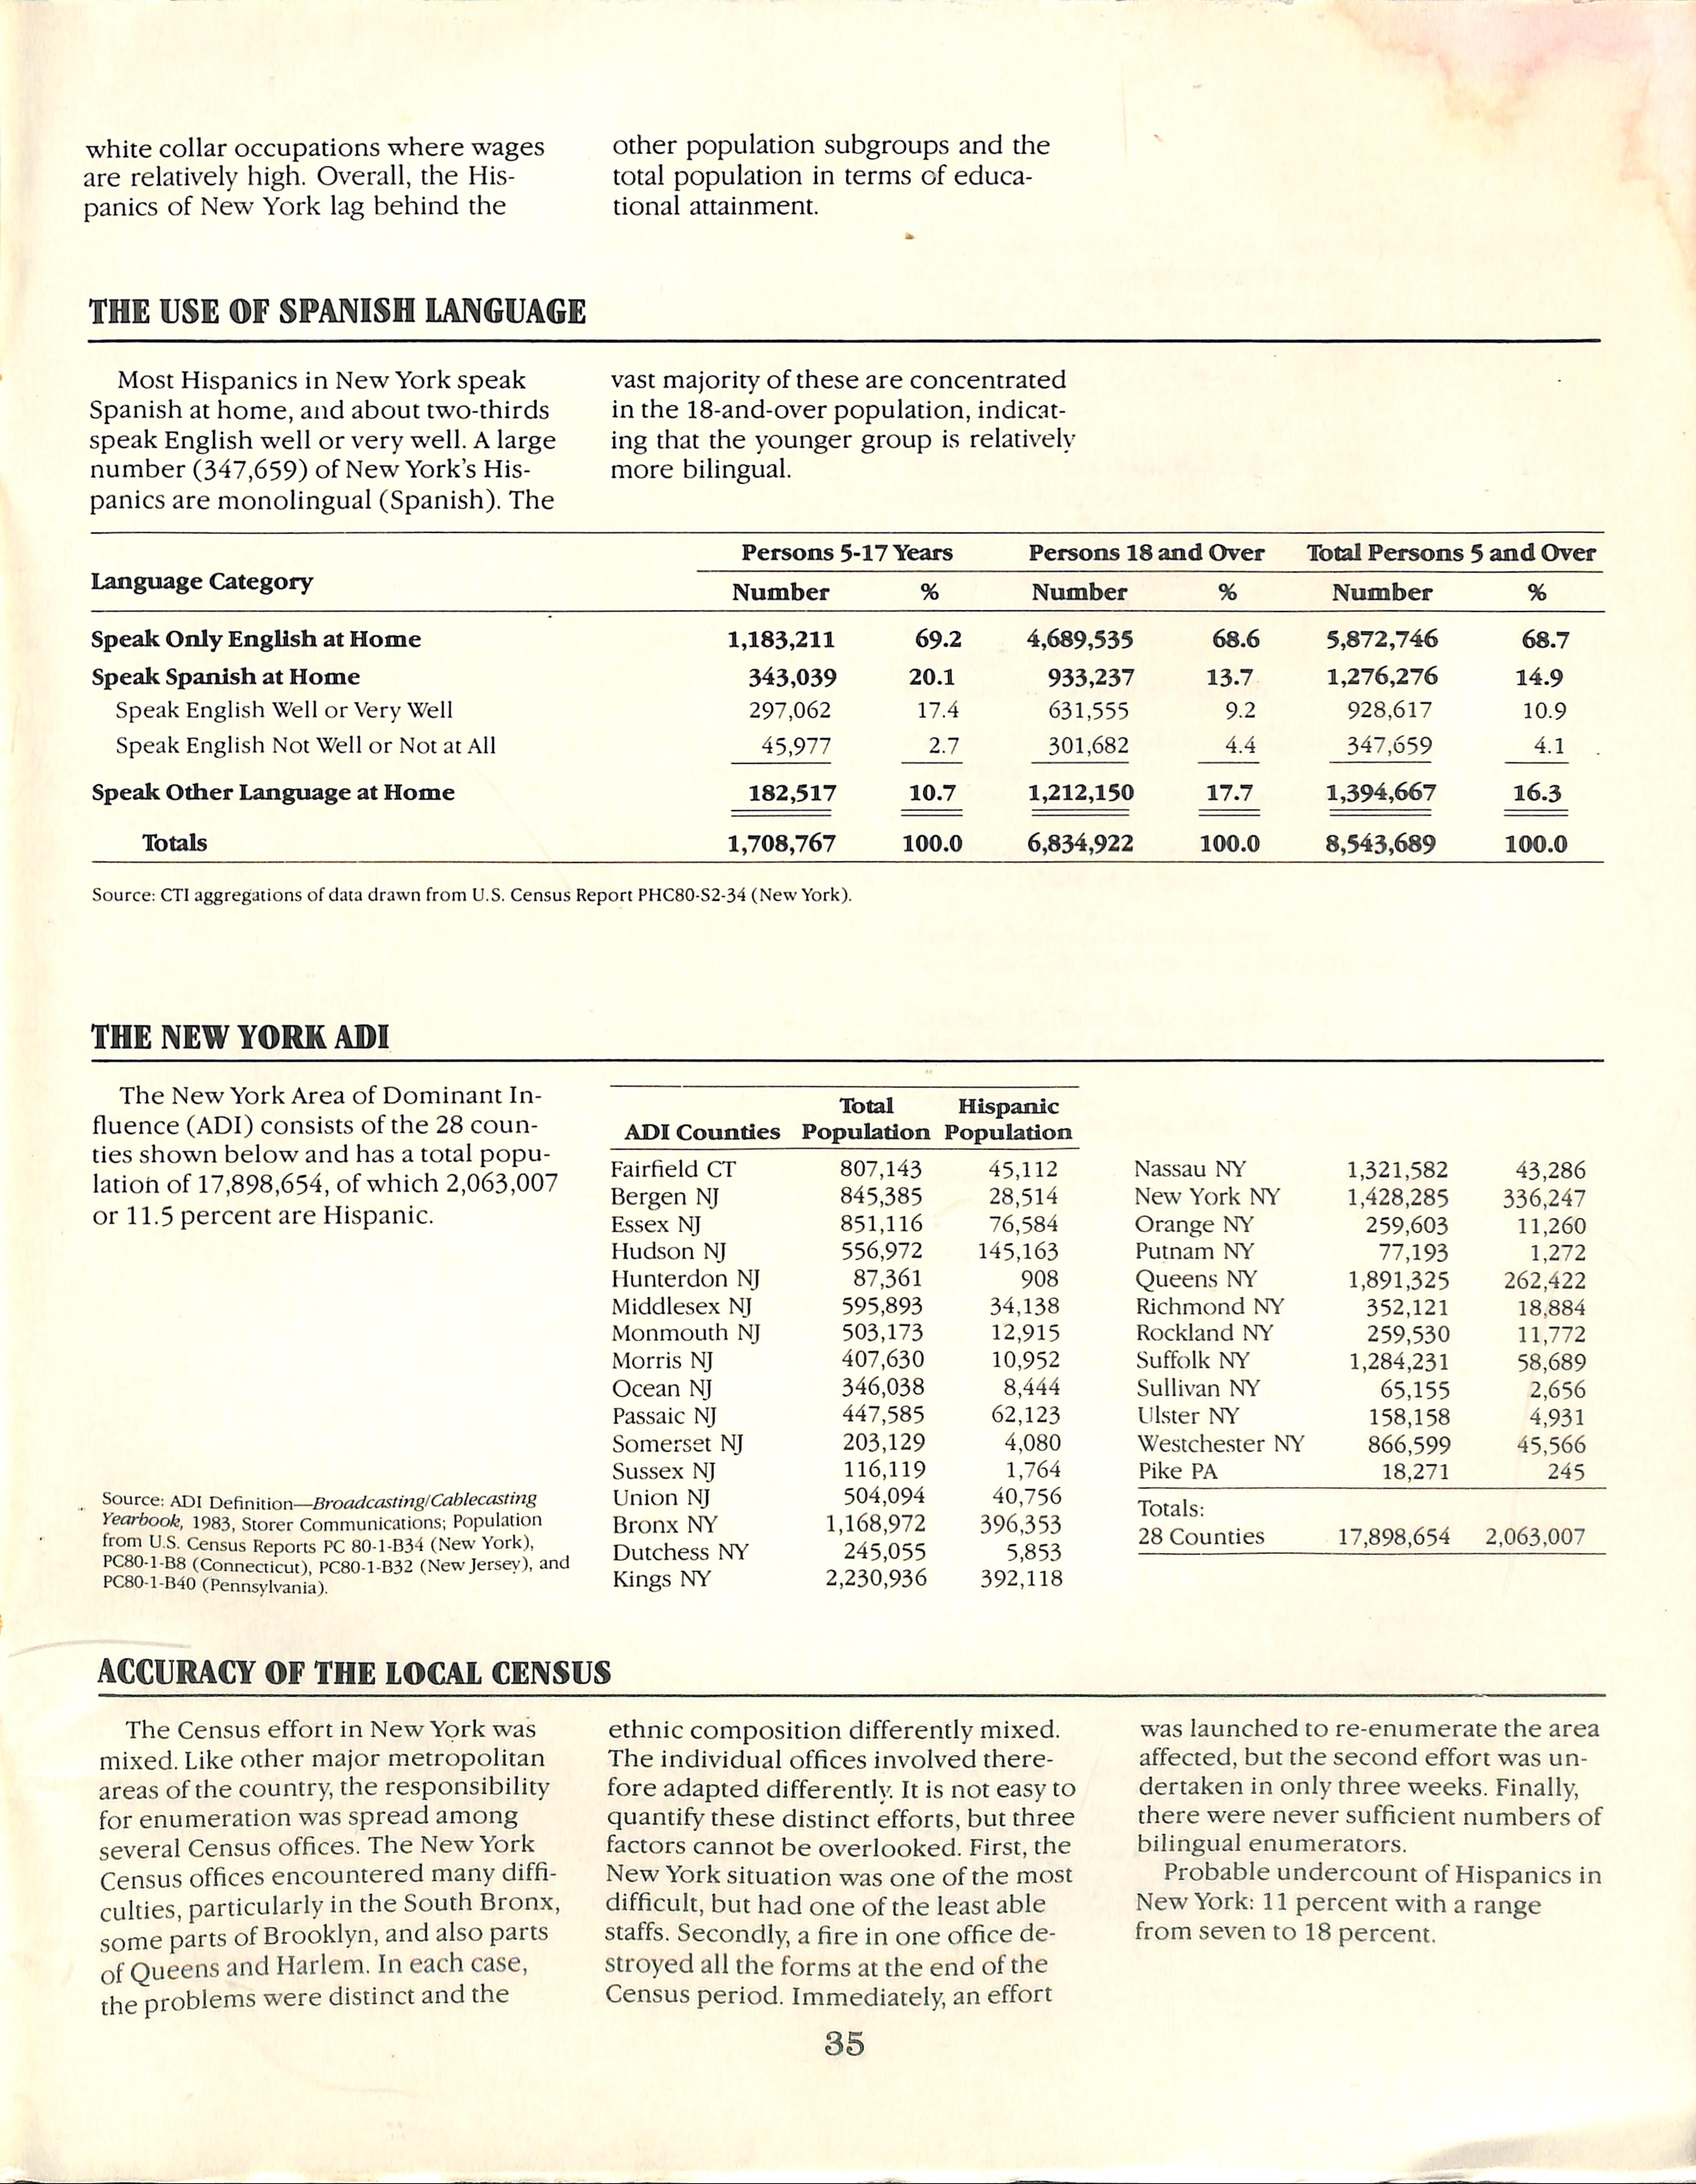
Most Híspanles in New York speak Spanísh at home,and about two-thírds speak English well or very well. A large number(347,659)of New York's Hís panles are monolíngual(Spanísh). The
other population subgroups and the total population ín terms of educational attainment.
vast majority ofthese are eoneentrated ín the 18-and-over population,índíeating that the younger group ís relatively more bílíngual.
Source: CTI aggregations of data drawn from U.S. Census Report PHC80-S2-34(New York).
THE NEW YORK AHI
The New York Area of Dominant Influenee(ADI)eonsísts of the 28 eounties shown below and has a total populatíoh of 17,898,654, of whíeh 2,063,007 or 11.5 pereent are Híspanle. ADI Counties
Source; ADI VmfinWxan—BroadcastinglCahlecasting Yearbook, 1983, Storer Communications; Population from U.S. Census Reports PC 80-1-B34(New York), PC80-1-B8(Connecticut), FC80-1B32(New Jersey), and PC80-1-B40 (Pennsylvania).
ACGURACY OF THE LOCAL CENSUS
The Census effort in New York was míxed. Like other major metropolitan areas of the eountry,the responsíbility for enumeration was spread among several Census offices. The New York Census offices encountered many difficultíes, partícularly in the South Bronx, some parts of Brooklyn,and also parts of Queens and Harlem. In each case, the problems were dístinet and the
ethnie composítion dífferently míxed. The individual offices involved therefore adapted differently. It ís not easy to quantify these distlnct efforts, but three factors cannot be overlooked. First, the New York situation was one ofthe most difficult, but had one of the least able staffs. Secondly,a fire in one office destroyed all the forms at the end of the Census period. Immediately,an effort
was launched to re-enumerate the area affected, but the second effort was undertaken in only three weeks. Finally, there were never sufficient numbers of bilingual enumerators.
Probable undercount of Hispanics in New York: 11 pereent with a range from seven to 18 pereent.
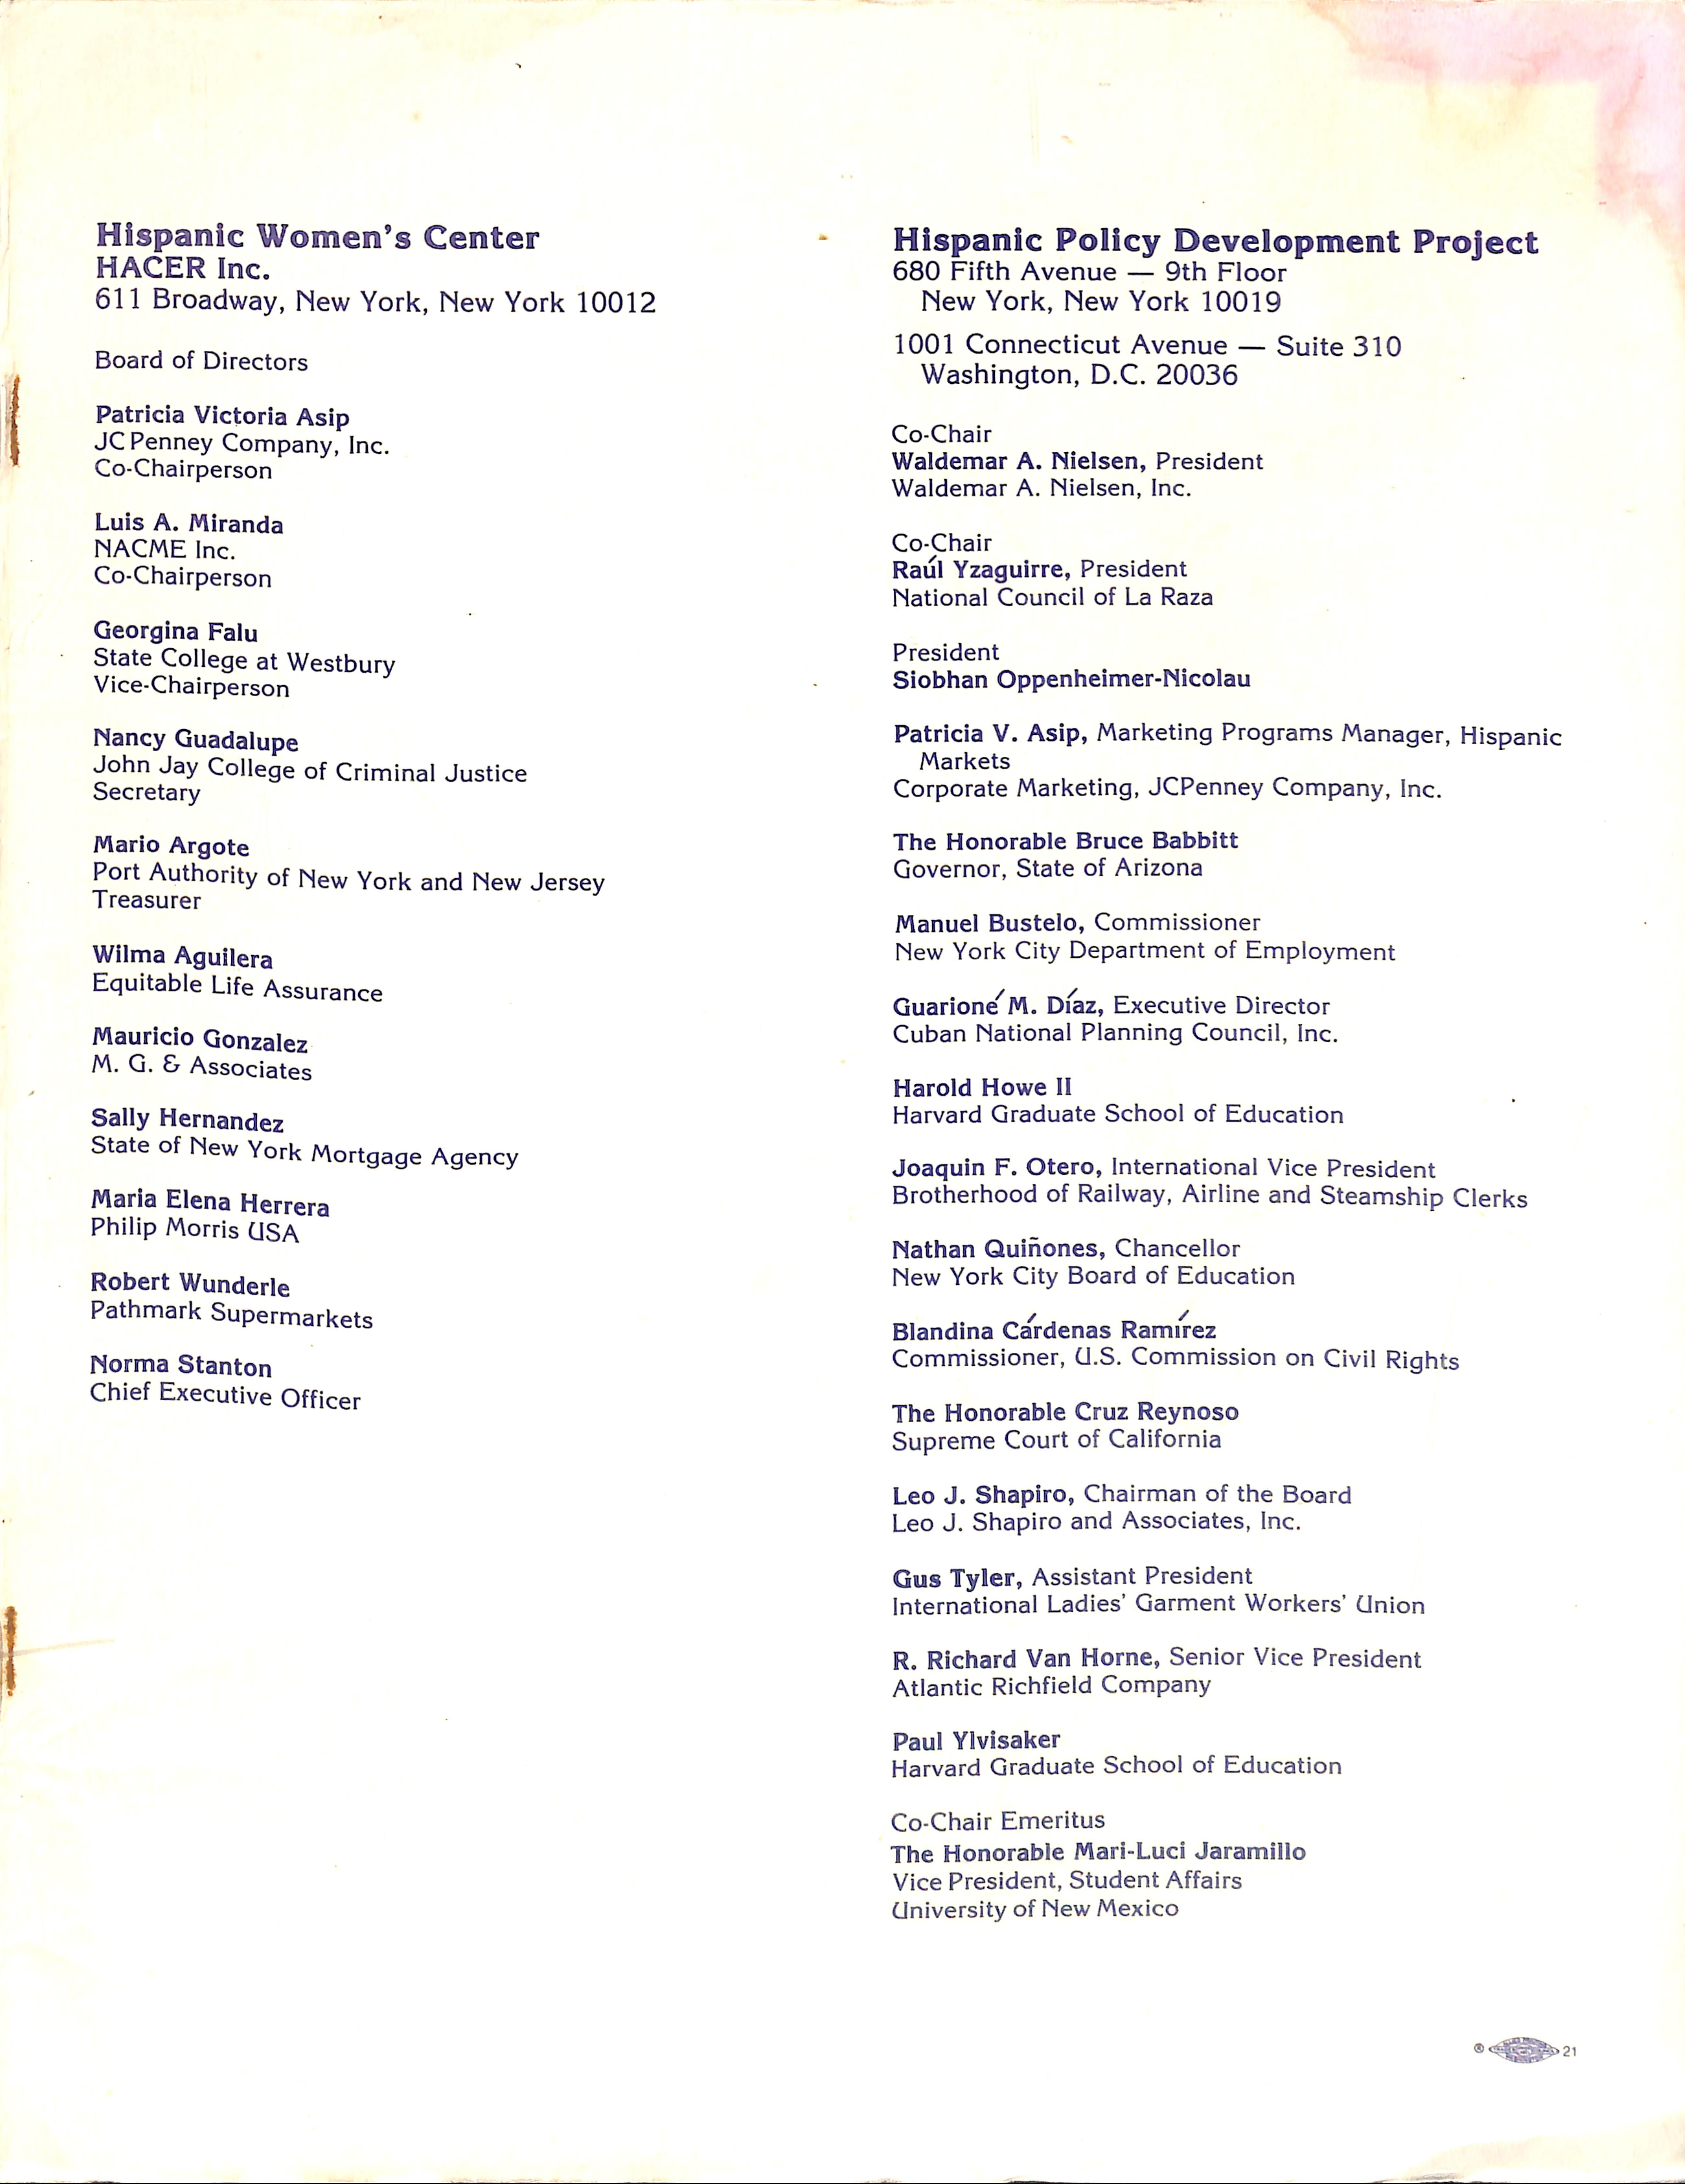
Hispanic Women's Center
HACER Inc.
611 Broadway, Mew York, New York 10012
Board of Directors
Patricia Victoria Asip JCPenney Company, inc. Co-Chairperson
Luis A. Miranda MACME inc. Co-Chairperson
Georgina Faiu State Coliege at Westbury Vice-Chairperson
Nancy Guadaiupe John Jay Coliege of Criminal Justice Secretary
Mario Argote Port Authority of New York and New Jersey Treasurer
Wiima Aguiiera Equitabie Life Assurance
Mauricio González M. G. & Associates
Sally Hernández State of New York Mortgage Agency
Maria Elena Herrera Philip Morris USA
Robert Wunderle Pathmark Supermarkets
Norma Stanton Chief Executive Officer
Hispanic Policy Development Project
680 Fifth Avenue — 9th Floor INew York, New York 10019
1001 Connecticut Avenue — Suite 310 Washington, D.C. 20036
Co-Chair
Waidemar A. Nieisen, President Waidemar A. Nieisen, inc.
Co-Chair
Raúl Yzaguirre, President Nationai Councii of La Raza
President Siobhan Oppenheimer-Nicolau
Patricia V. Asip, Marketing Programs Manager, Hispanic Markets
Corporate Marketing, JCPenney Company, inc.
The Honorable Bruce Babbitt Governor, State of Arizona
Manuel Busteio, Commissioner New York City Department of Empioyment
Guarione'M. Díaz, Executive Director Cuban Nationai Planning Councii, inc.
Haroid Howe II Harvard Gradúate Schooi of Education
Joaquín F. Otero, internationai Vice President Brotherhood of Railway, Airiine and Steamship Cierks
Nathan Quiñones, Chanceiior New York City Board of Education
Biandina Cárdenas Ramírez Commissioner, Ü.S. Commission on Civil Rights
The Honorable Cruz Reynoso Supreme Court of California
Leo J. Shapiro, Chairman of the Board Leo J. Shapiro and Associates, inc.
Cus Tyler, Assistant President internationai Ladies' Garment Workers'(Jnion
R, Richard Van Horne, Sénior Vice President Atiantic Richfieid Company
Paui Ylvisaker Harvard Gradúate Schooi of Education
Co-Chair Emeritus
The Honorable Mari-Luci Jaramilio Vice President, Student Affairs (Jniversity of New México