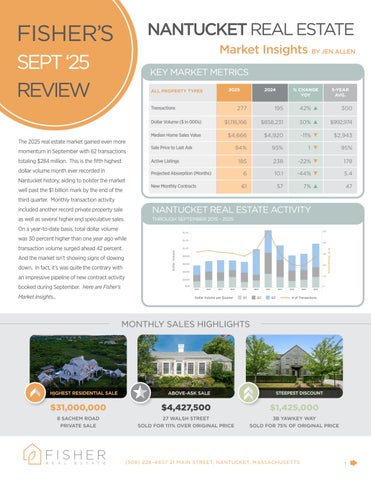
The 2025 real estate market gained even more momentum in September with 62 transactions totaling $284 million. This is the fifth highest dollar volume month ever recorded in Nantucket history, aiding to bolster the market well past the $1 billion mark by the end of the third quarter. Monthly transaction activity included another record private property sale as well as several higher end speculative sales. On a year-to-date basis, total dollar volume was 30 percent higher than one year ago while transaction volume surged ahead 42 percent. And the market isn’t showing signs of slowing down. In fact, it’s was quite the contrary with an impressive pipeline of new contract activity booked during September. Here are Fisher’s Market Insights...
KEY MARKET METRICS
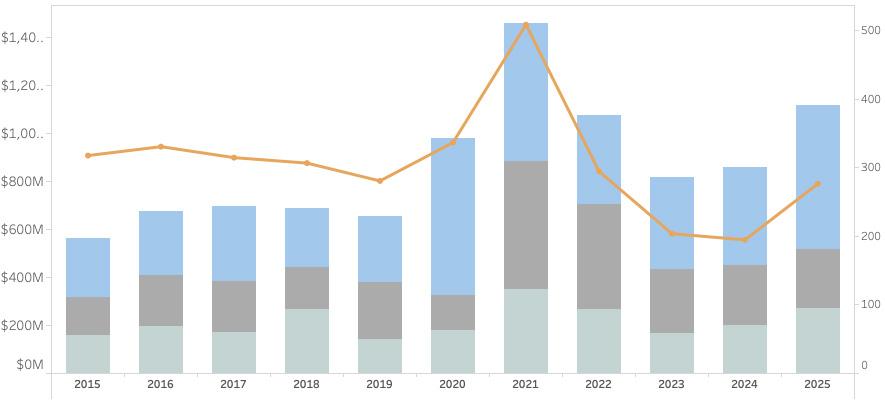
NANTUCKET REAL ESTATE ACTIVITY THROUGH SEPTEMBER 2015 - 2025
Market Insights BY
JEN ALLEN
SINGLE-FAMILY SALES ACTIVITY
HIGHER END SPECULATIVE TRADES BOOST SALES
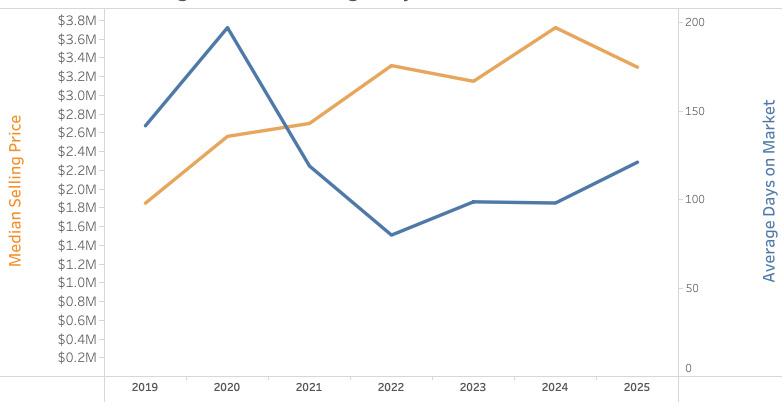
• The median single-family home value was $4.67 million as of September 30, 2025. This is five percent lower than in 2024 but 17 percent higher than the five-year average. The year-over-year decline in the median sale value narrowed from the seventeen-percentage point gap earlier this year as higher end sales have counterbalanced the impact of more numerous $1 million to $2 million transactions as compared to 2024.
• After plummeting to 80 days on the market in 2022, the average days on the market for single-family home was 121 days as of September 30, 2025. In recent months we’ve seen the average marketing time decline so it will be interesting to see if we see this average metric decline further as we head into the fourth quarter.
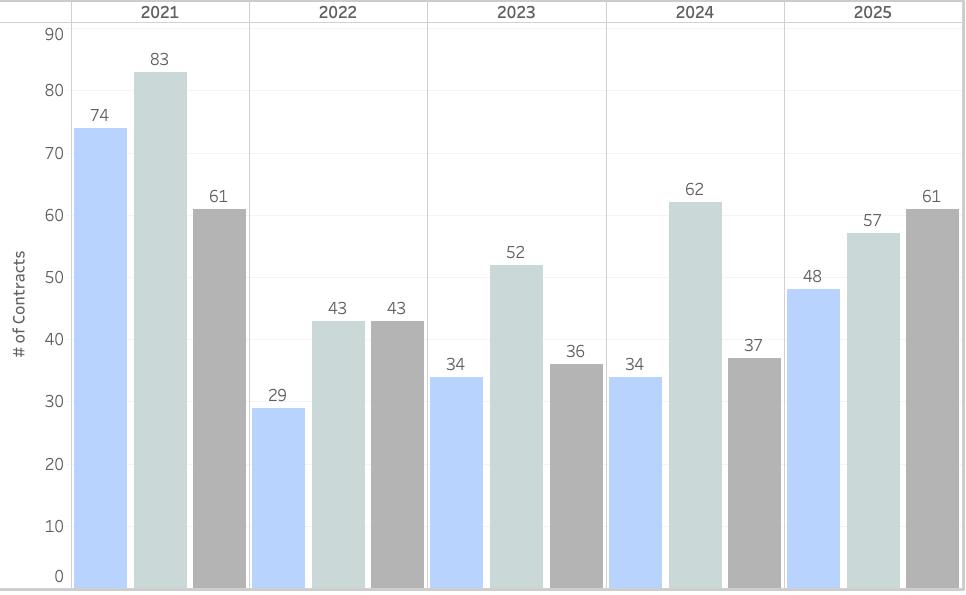
CONTRACT ACTIVITY
• Single-family home sales (excluding condos, co-ops & 40B or covenant properties) totaled 48 transactions in September, an increase of 37 percent from one year ago but on par with the five-year average. Cumulative dollar volume rose by 37 percent and measuring just shy of $250 million. This brought year-to-date sales activity to 190 single-family home sales totaling $887 million, a respective rise of 25 percent and 19 percent from the same period in 2024.
• September not only included the highest sale of the year thus far (until October) with the $31 million transfer of 8 Sachem Road, but it also included a handful of higher end speculative sales. These developer transactions included the $14.5 million sale of 126 Main Street, the $14.35 million sale of 20B Bishops Rise, the $7.6 million sale of 2 White Elephant Way and the pre-construction sale of 17 Pilgrim Road for $6.8 million (originally listed for $14.5 million complete). Through September, there have been 14 speculative sales compared to 22 last year but the average selling price has been nearly $1 million higher in 2025.
MEDIAN SELLING PRICE & DAYS ON MARKET MARKETING TIMES TRENDING DOWNWARD AGAIN
• Of the 62 September transactions, 17 properties went to contract very quickly, registering less than 30 days of marketing time. Another eight transactions took place in less than 45 days, illustrating that there is still a sense of urgency for certain property types and price points.
• While the number of new purchase contracts showed a moderate gain from August, it was notably higher than the previous three September totals. Of the contracts that were publicly recorded during September, the majority (25%) were for properties last priced between $2 million and $3 million. The next highest segment was for properties last listed between $3 million and $4 million. There were also seven contracts for the ultra-high-end ($10M+) suggesting we should have a robust fourth quarter.