A Critical Analysis of Climate Action Plans in Indian Cities
A Critical Analysis of Climate Action Plans in
Indian Cities
Towards Balancing Adaptation and Mitigation
October 2025
Abstract
1. Introduction
2. Mitigation over Adaptation- A Frequent Choice
2.1 India’s Climate Protocol
2.2 Methodology
3. Cities and the City Climate Action Plans (CAPs)
4. Evaluating the CAPs
4.1 Stage One Evaluation: Applying UNDP’s Adaptation Policy Framework (APF)
4.2 Stage Two Evaluation: Applying Biagini et al.’s (2014) Typology of Adaptation
5. Discussion: Towards Decentralized Adaptation Planning
6. Conclusion
Annexure
Bibliography
List of Tables and Figures
Fig 1. Timeline of Major Global Climate Adaptation Efforts
Fig 2. Timeline of India’s Climate Protocol
Fig 3. Biagini et al.’s Adaptation Activities’ Typologies subsumed into six categories
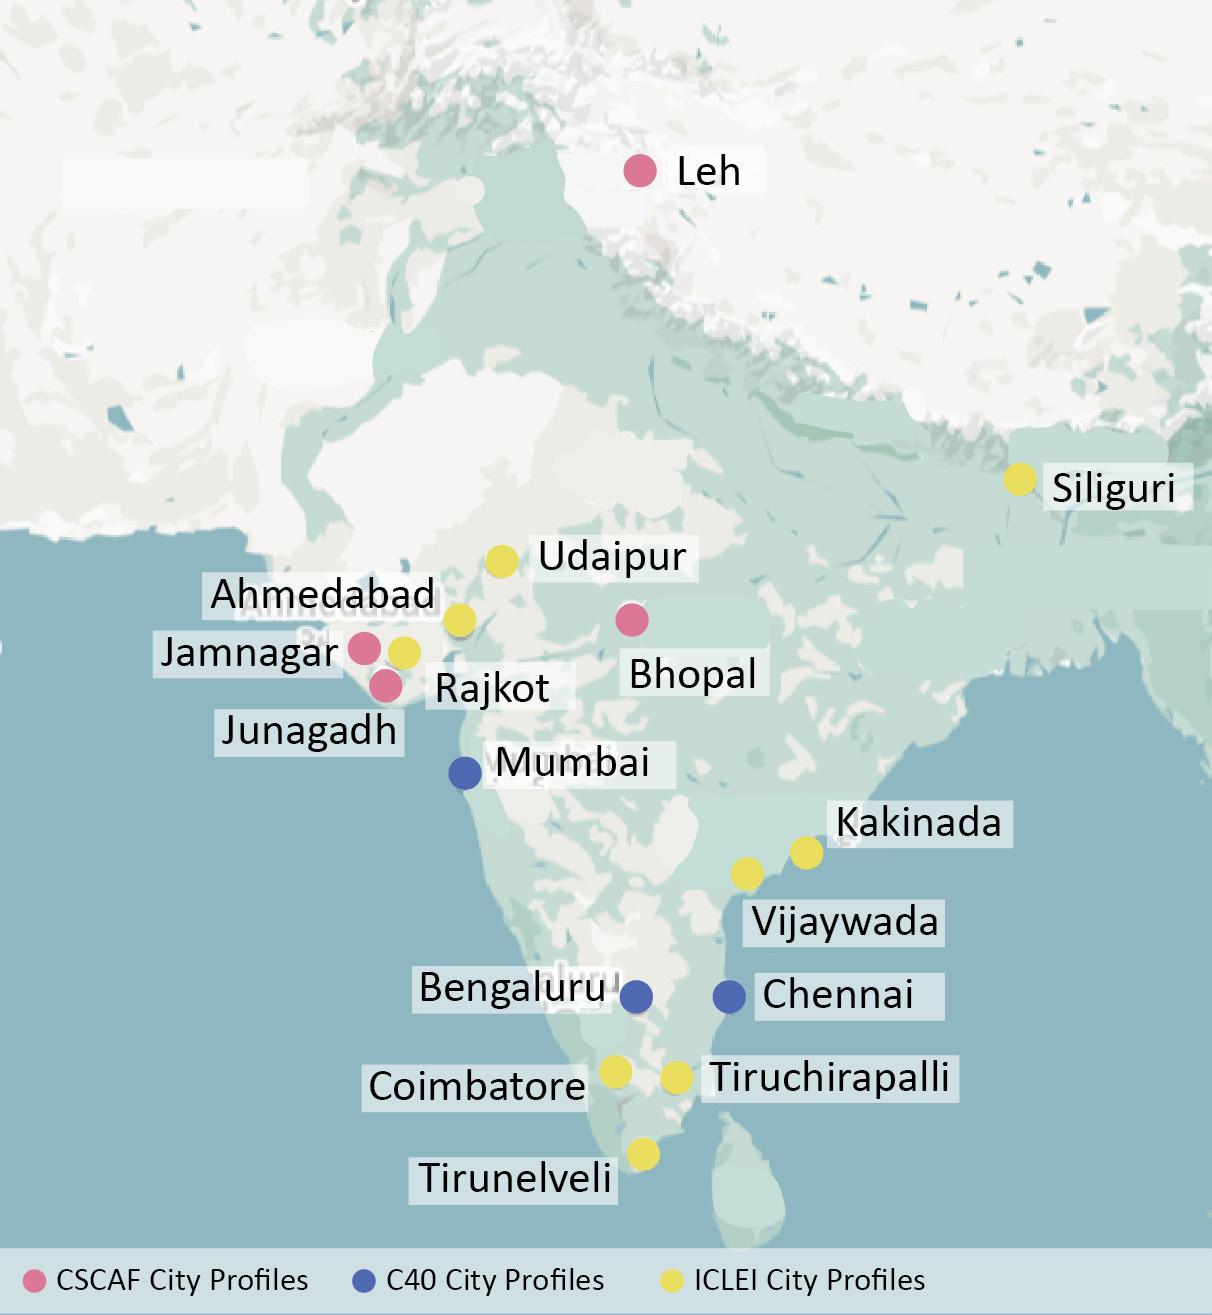
Fig 4. Location within India of the 16 cities
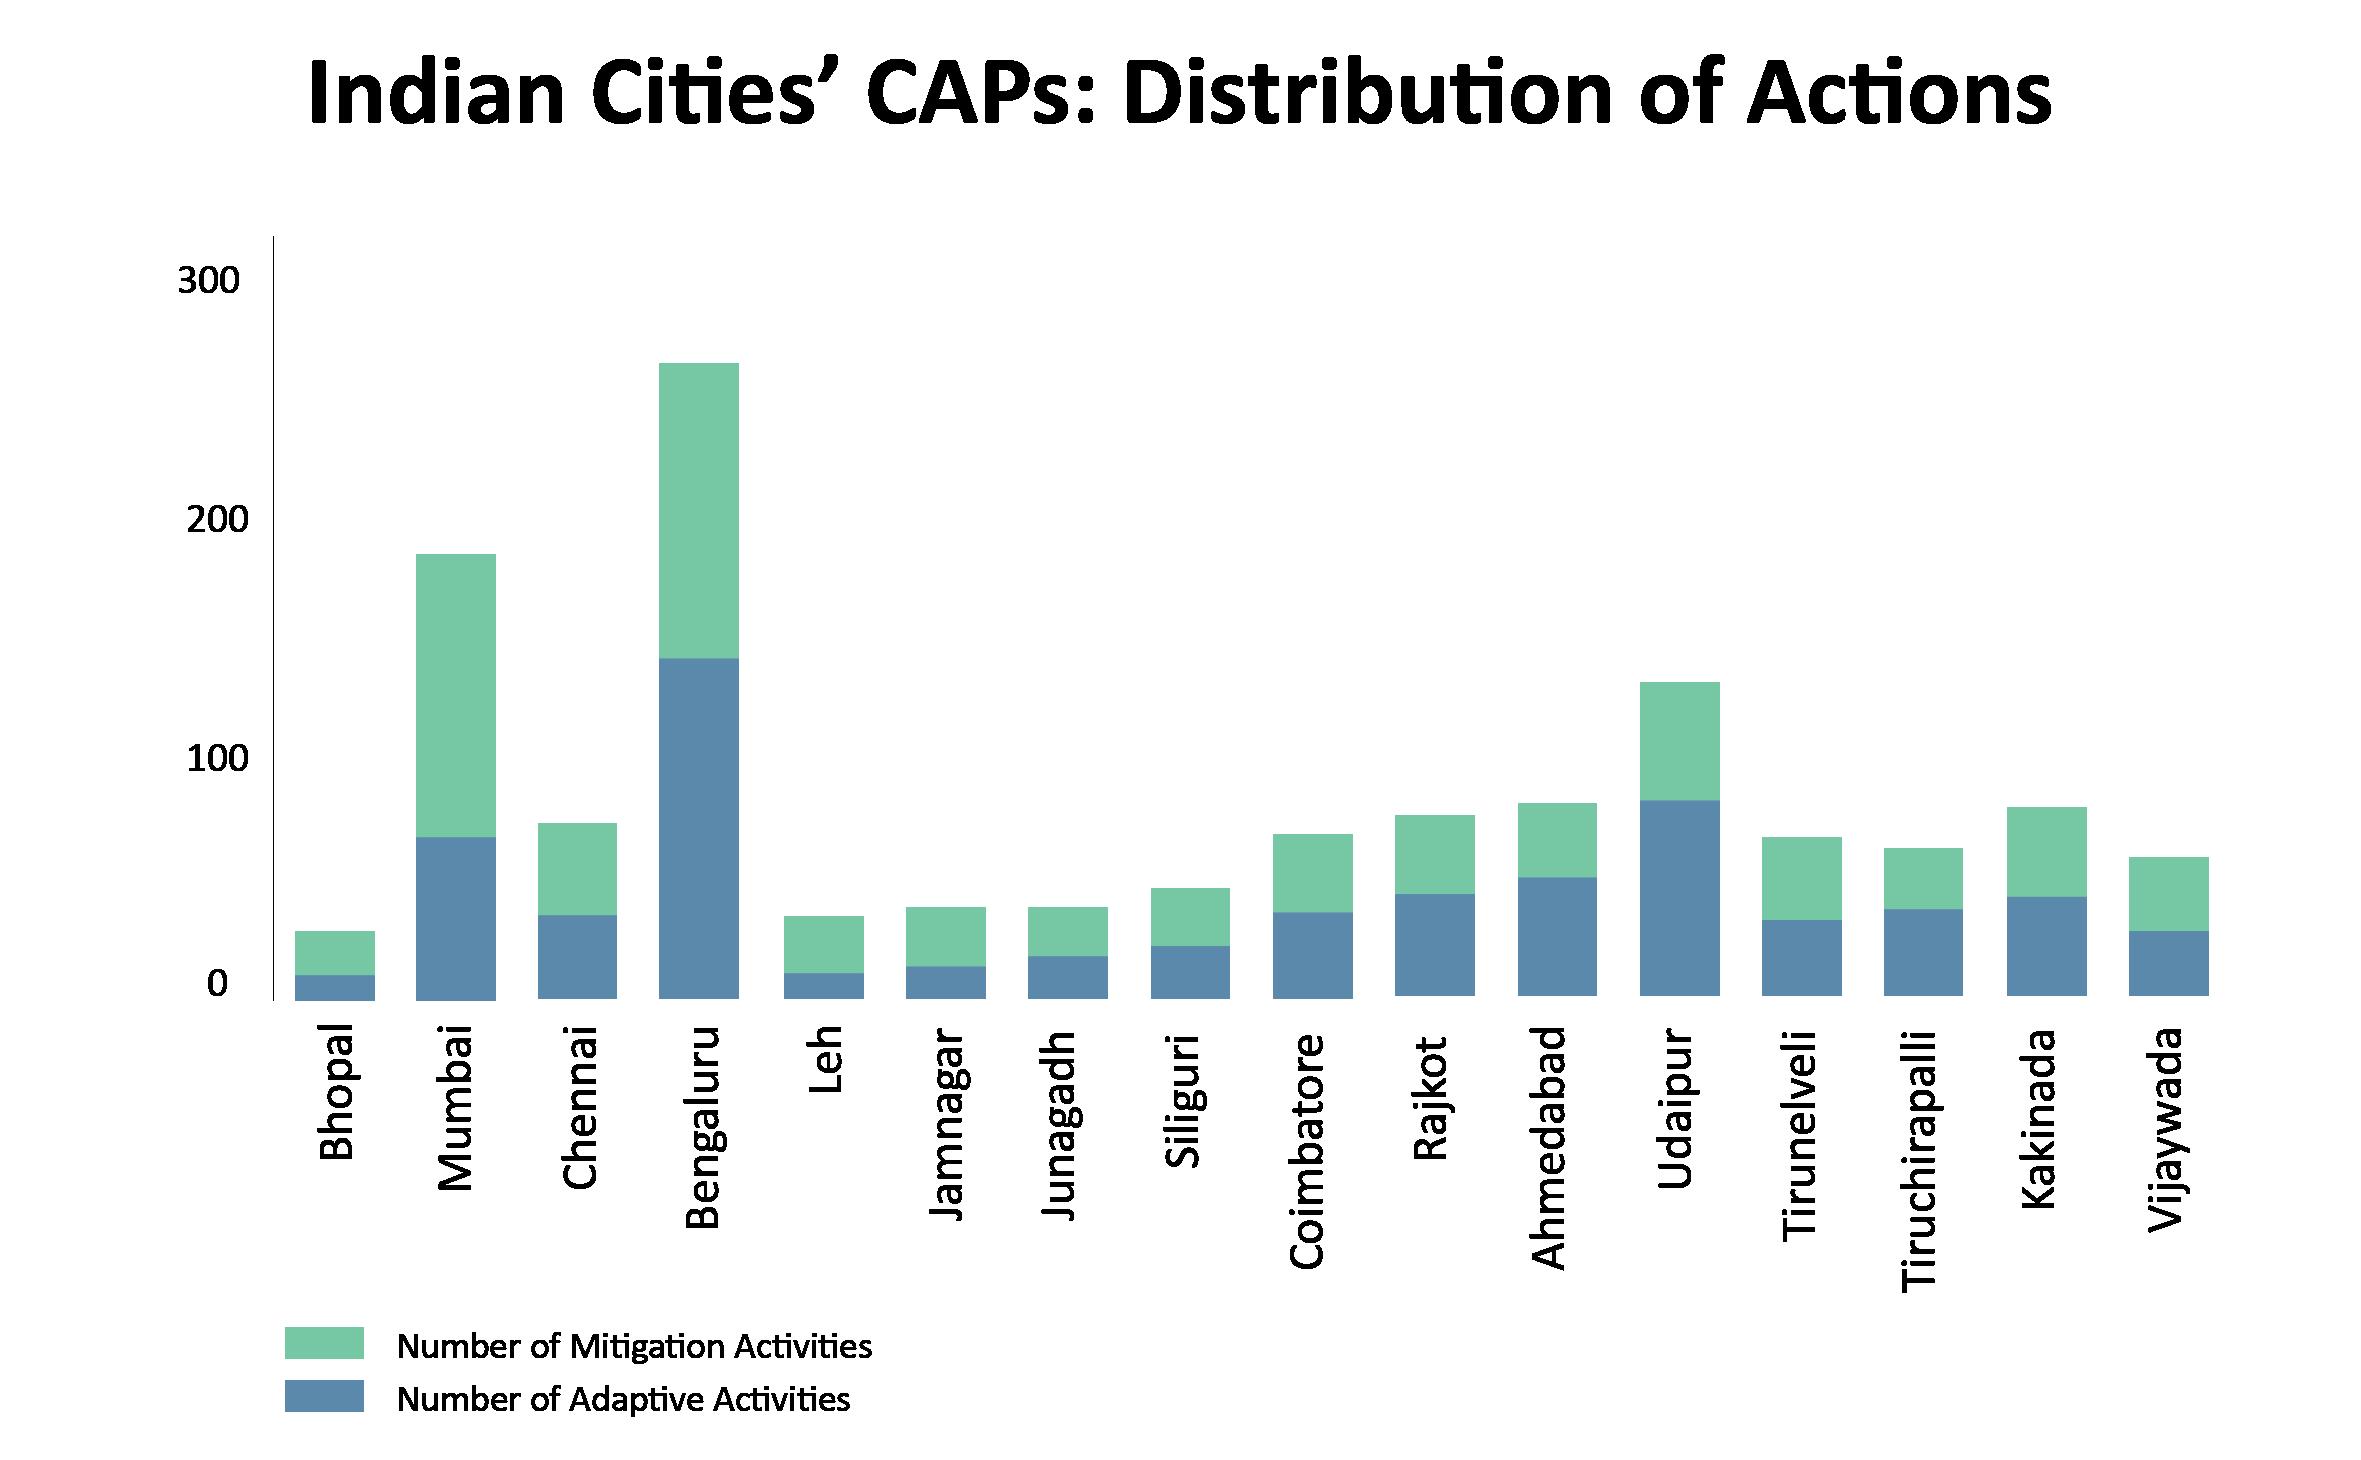
Fig 5. Distribution of mitigation and adaptation actions in the selected cities’ CAPs
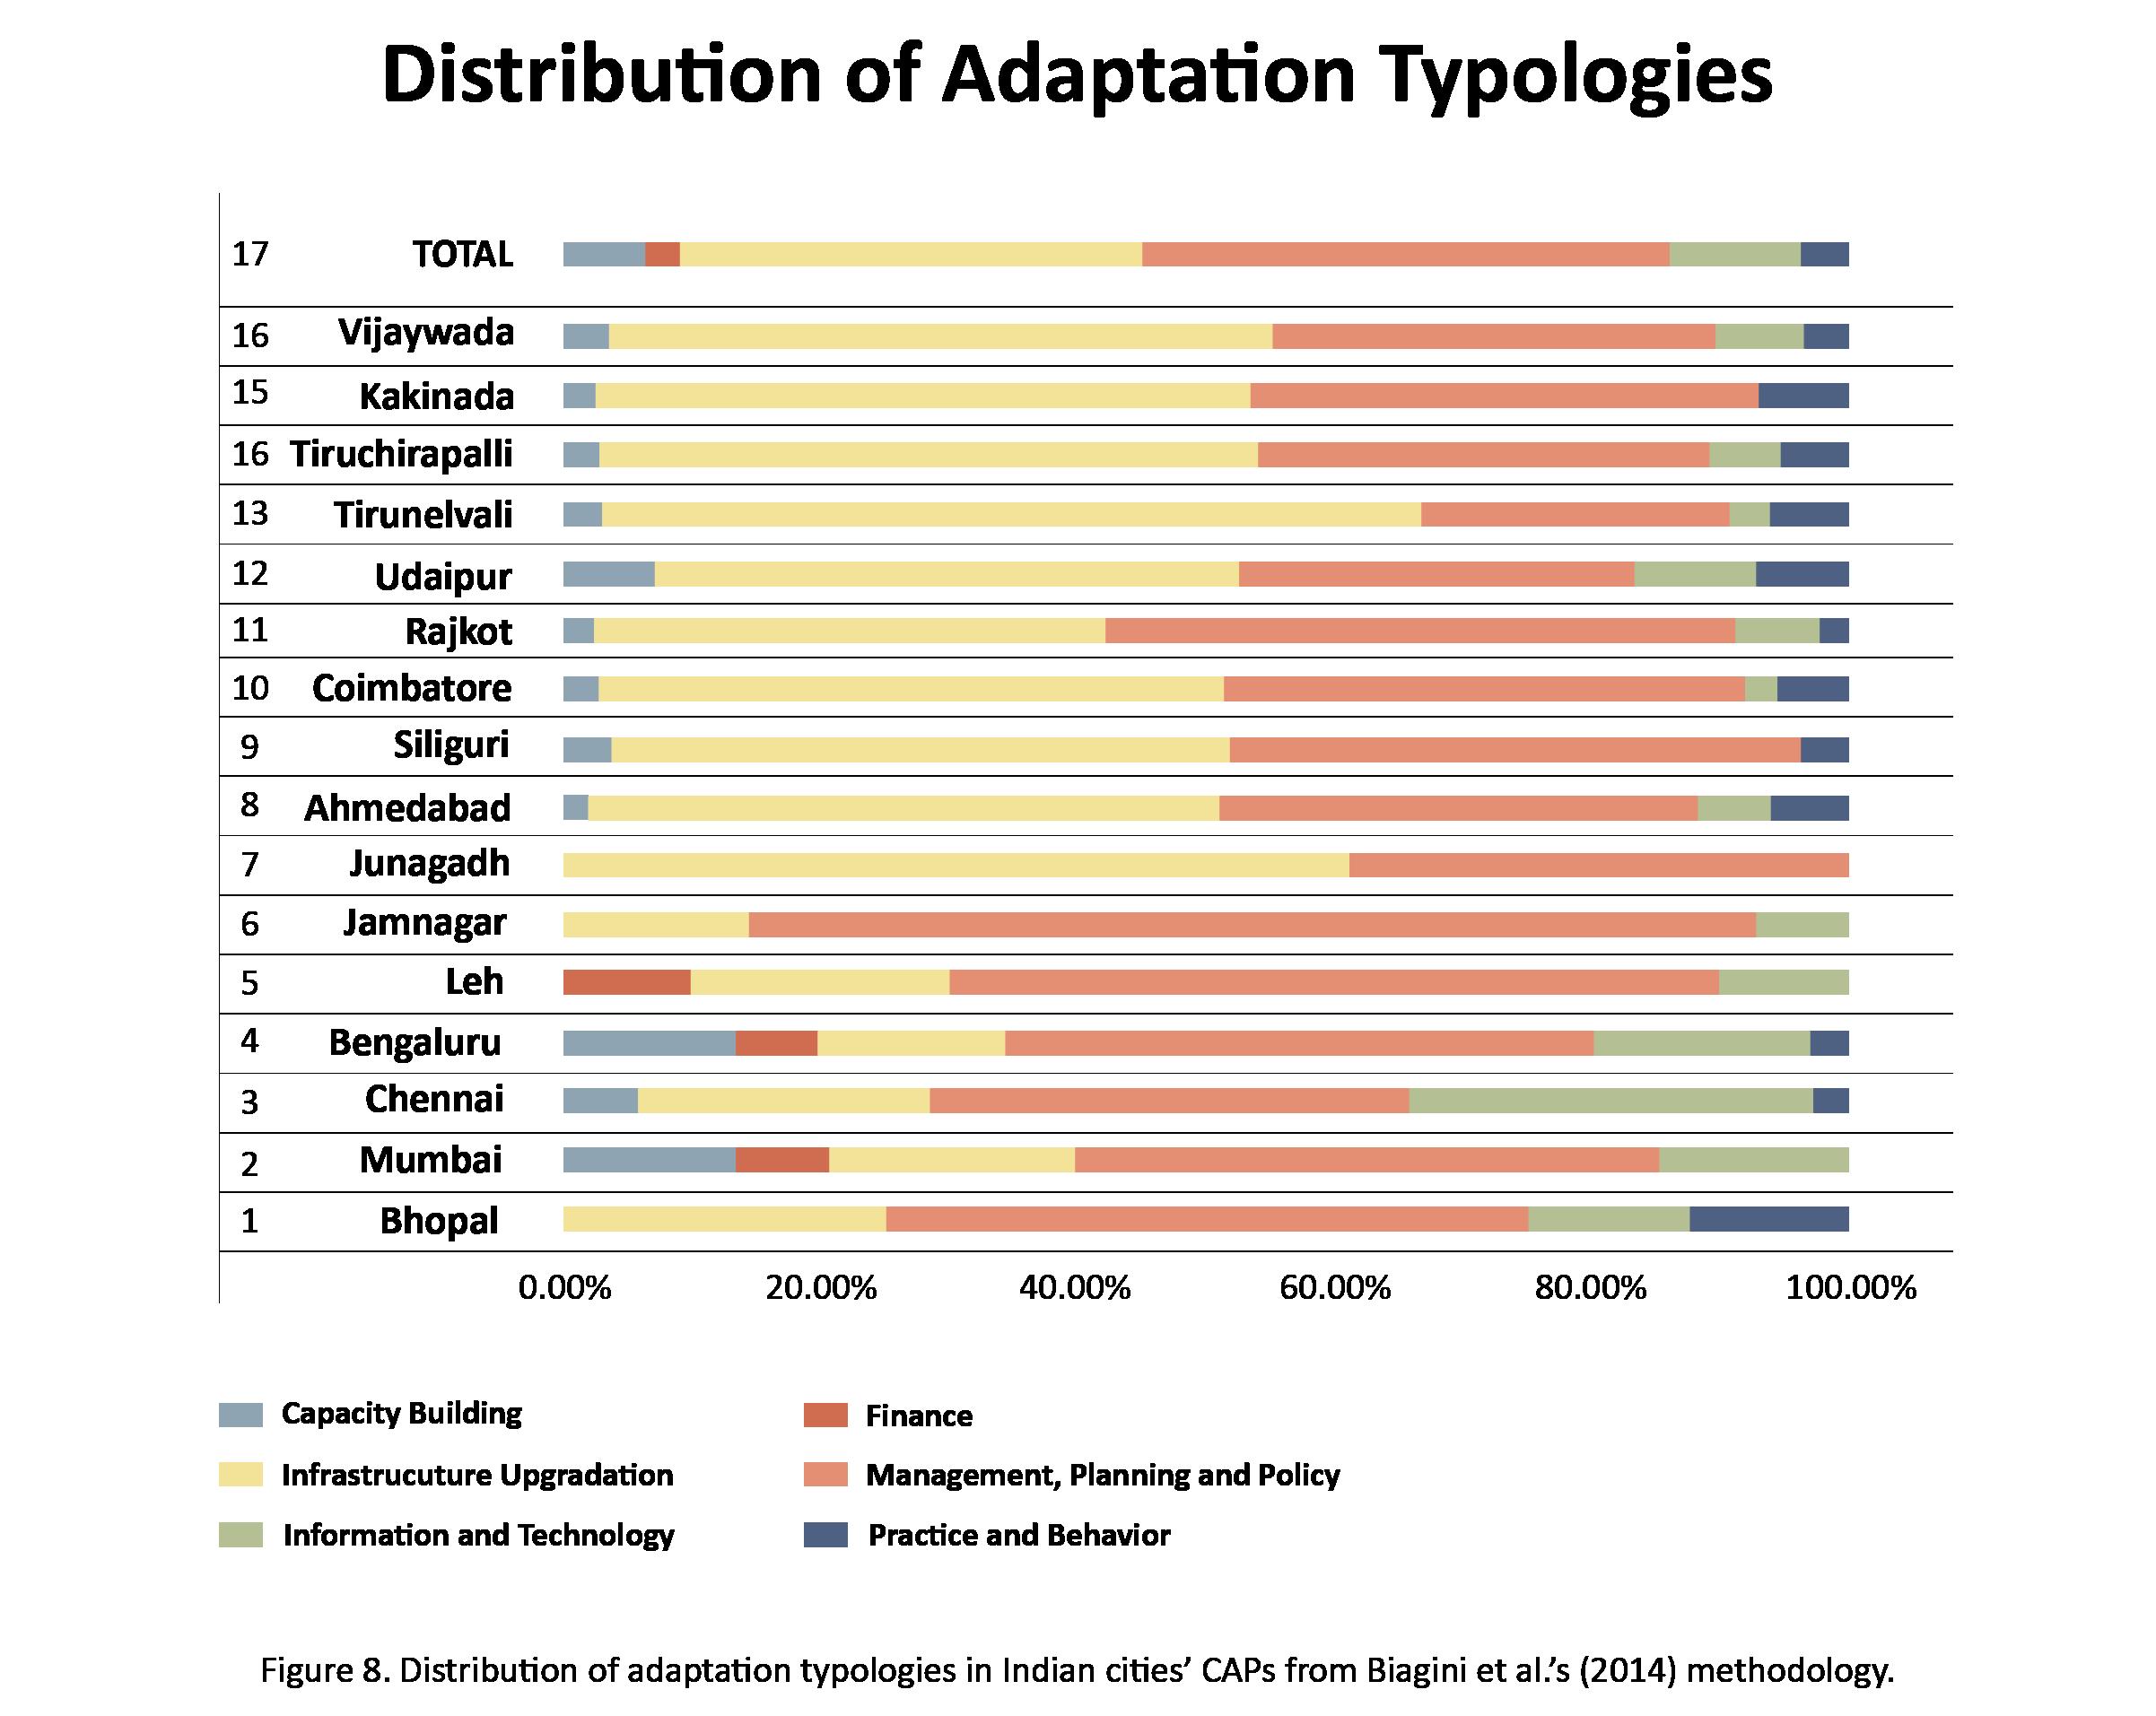
Figure 6. Distribution of adaptation typologies in Indian cities’ CAPs from Biagini et al.’s (2014) methodology
Fig 7. Distribution of all adaptation actions in Indian cities’ CAPs
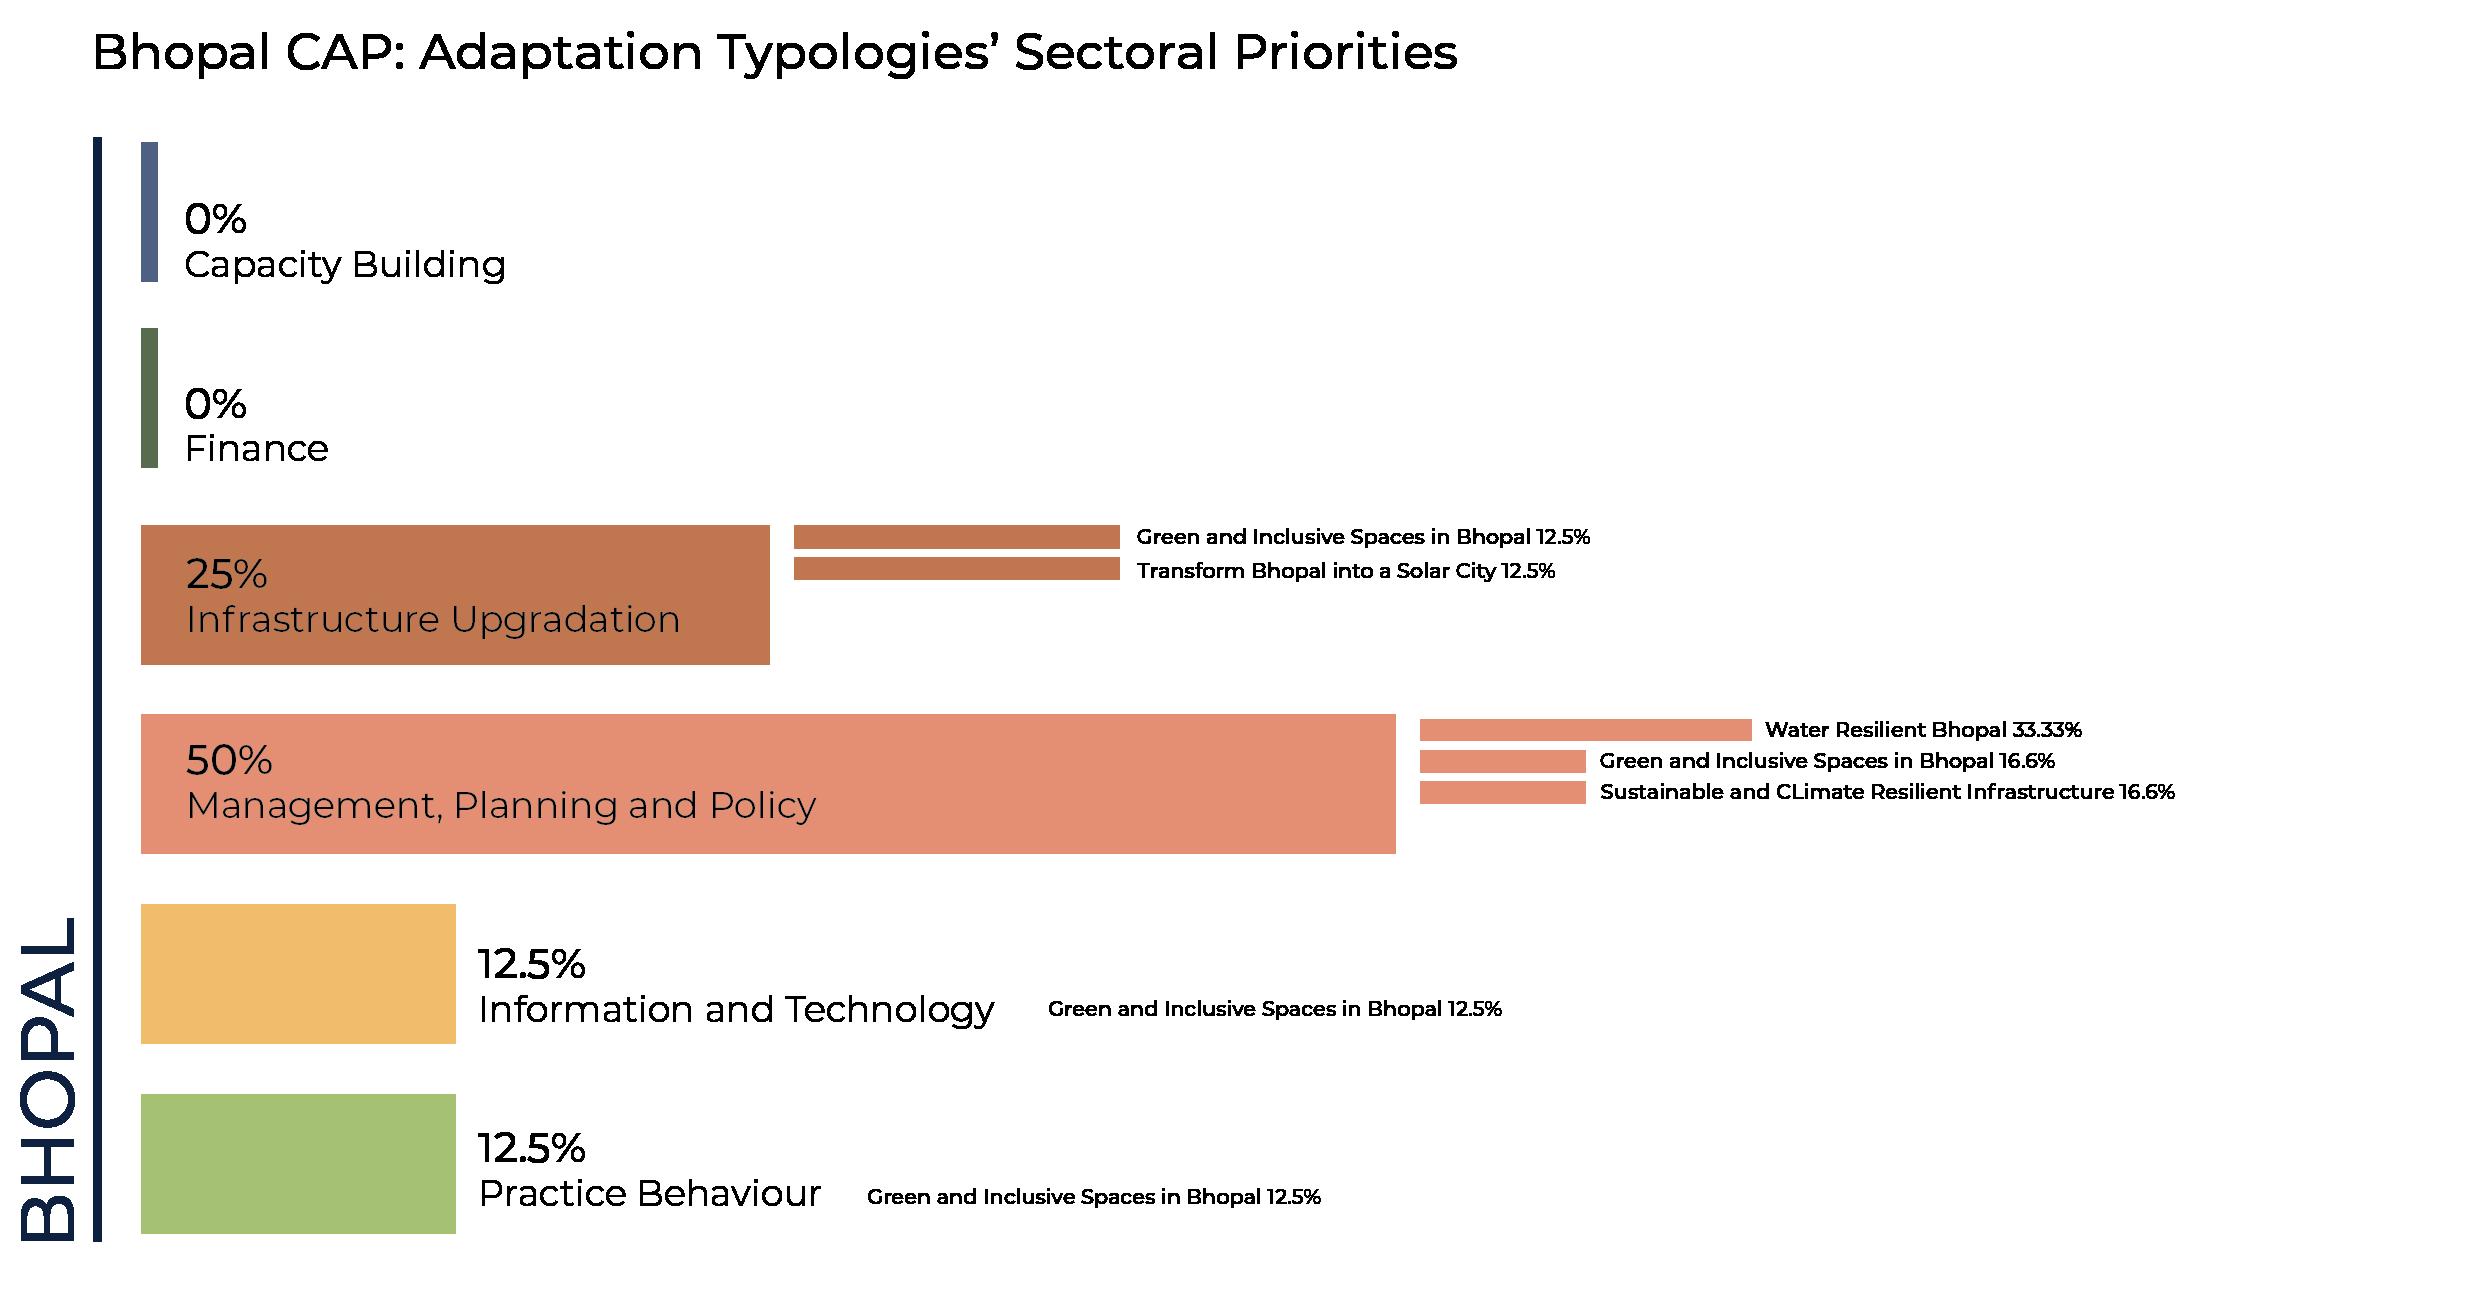
Fig 8. Distribution and sectoral priorities within Bhopal’s adaptation typologies
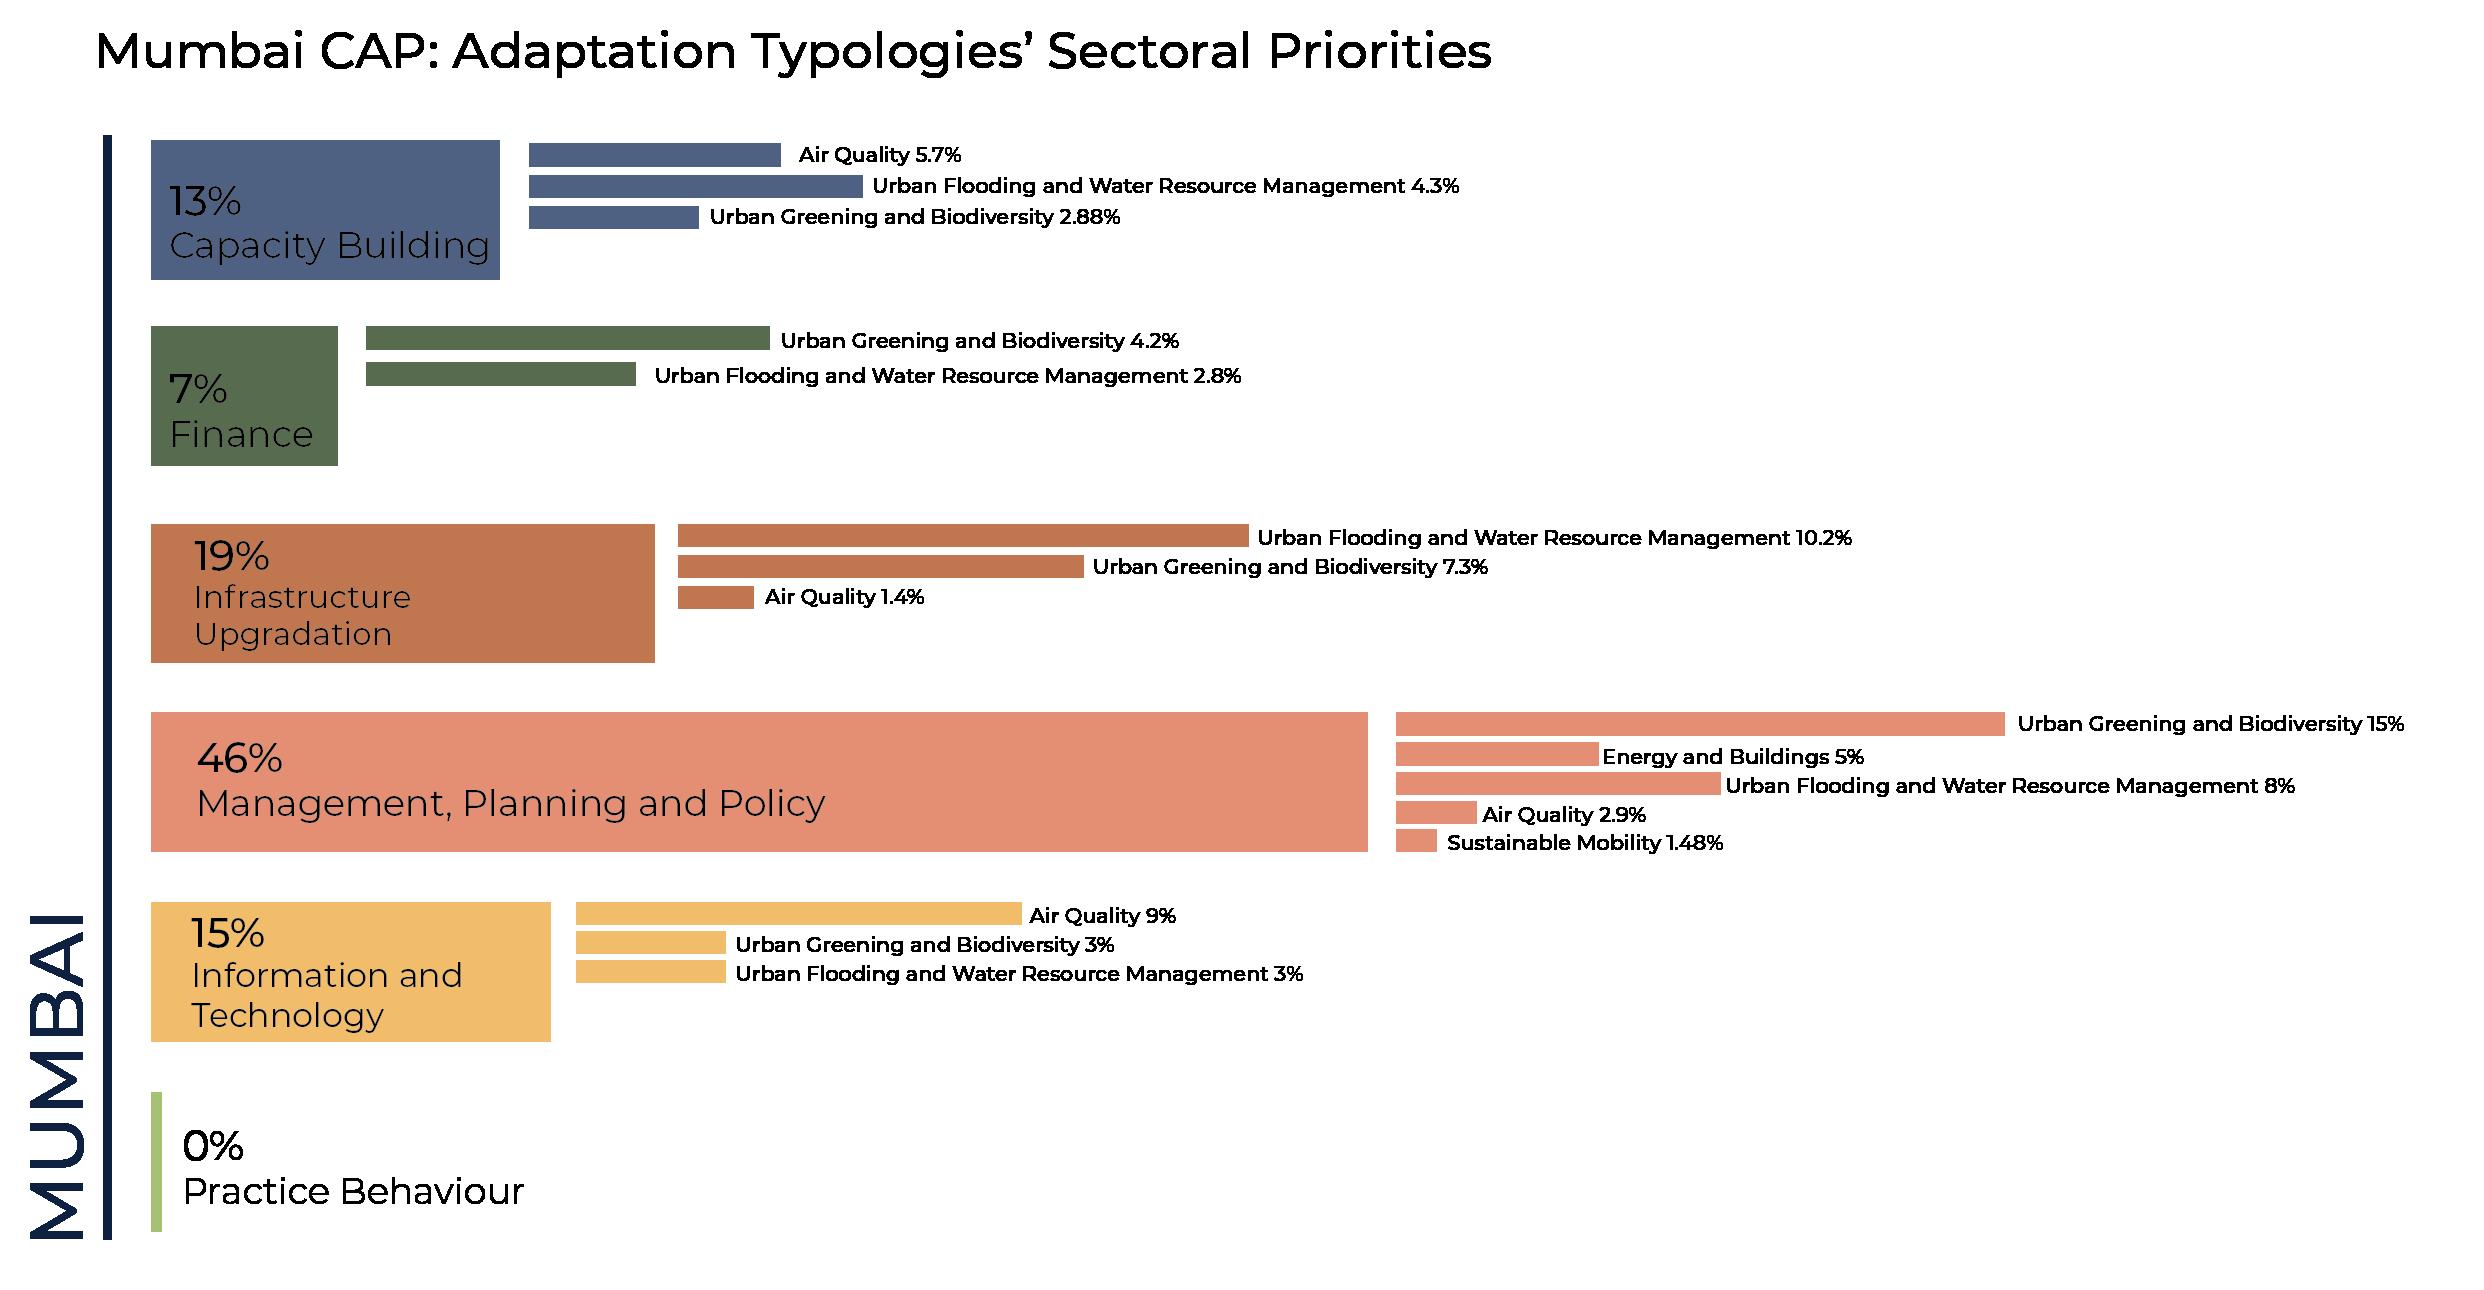
Fig 9. Distribution and sectoral priorities within Mumabi’s adaptation typologies
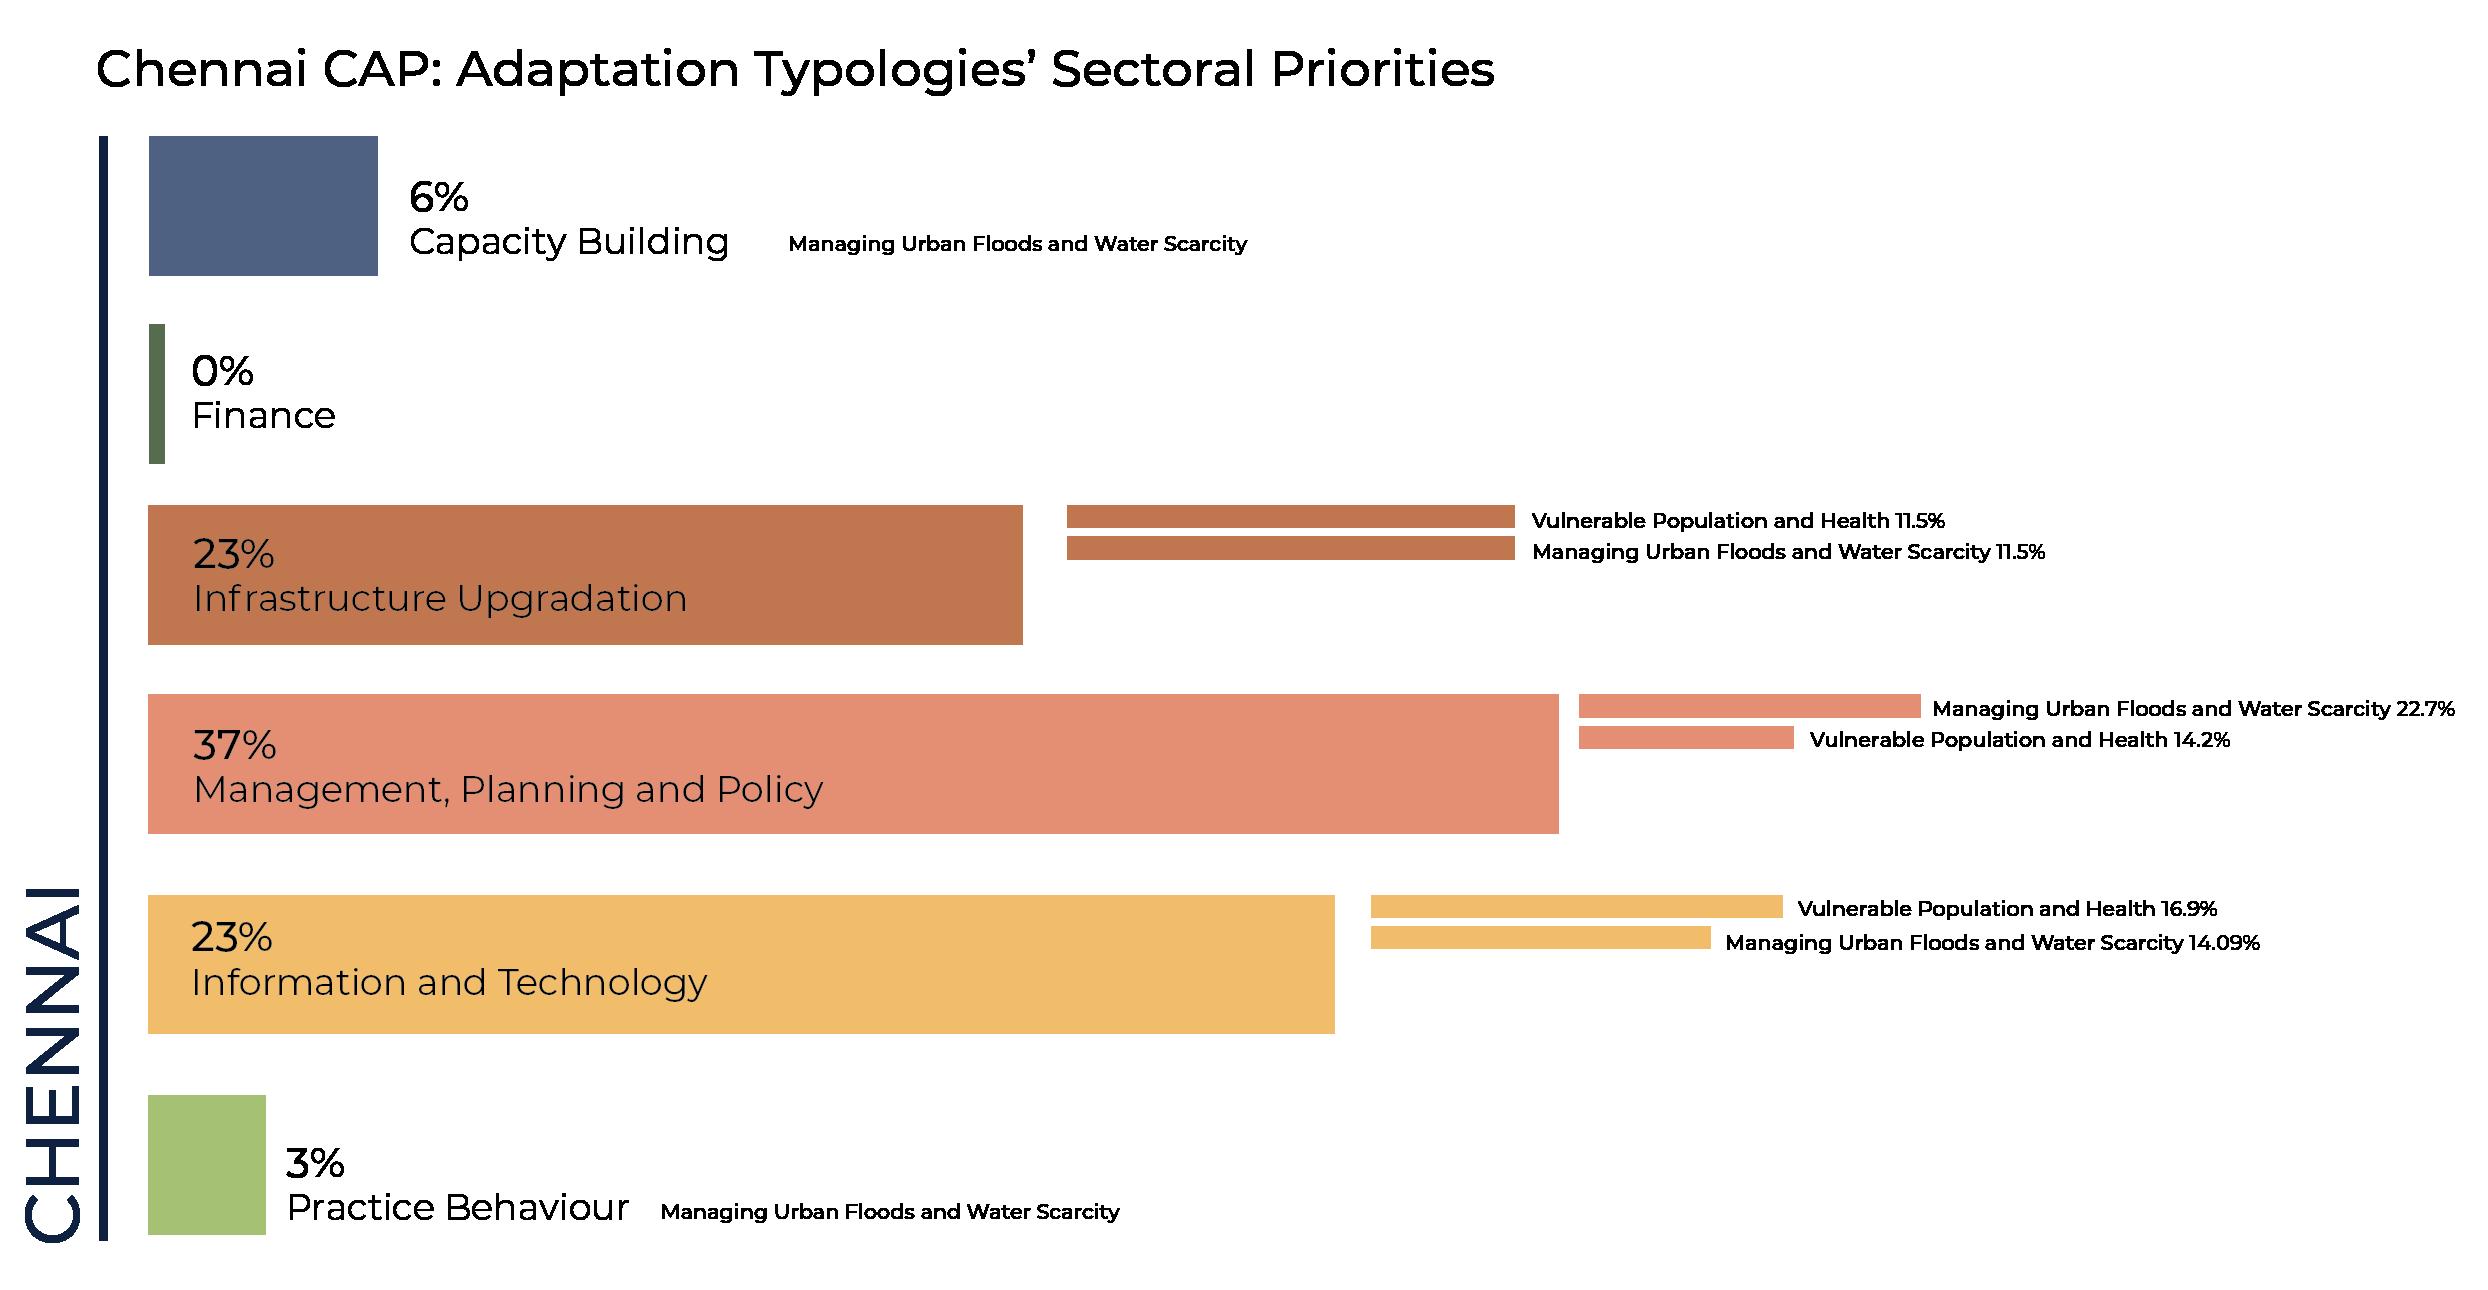
Fig 10. Distribution and sectoral priorities within Chennai’s adaptation typologies
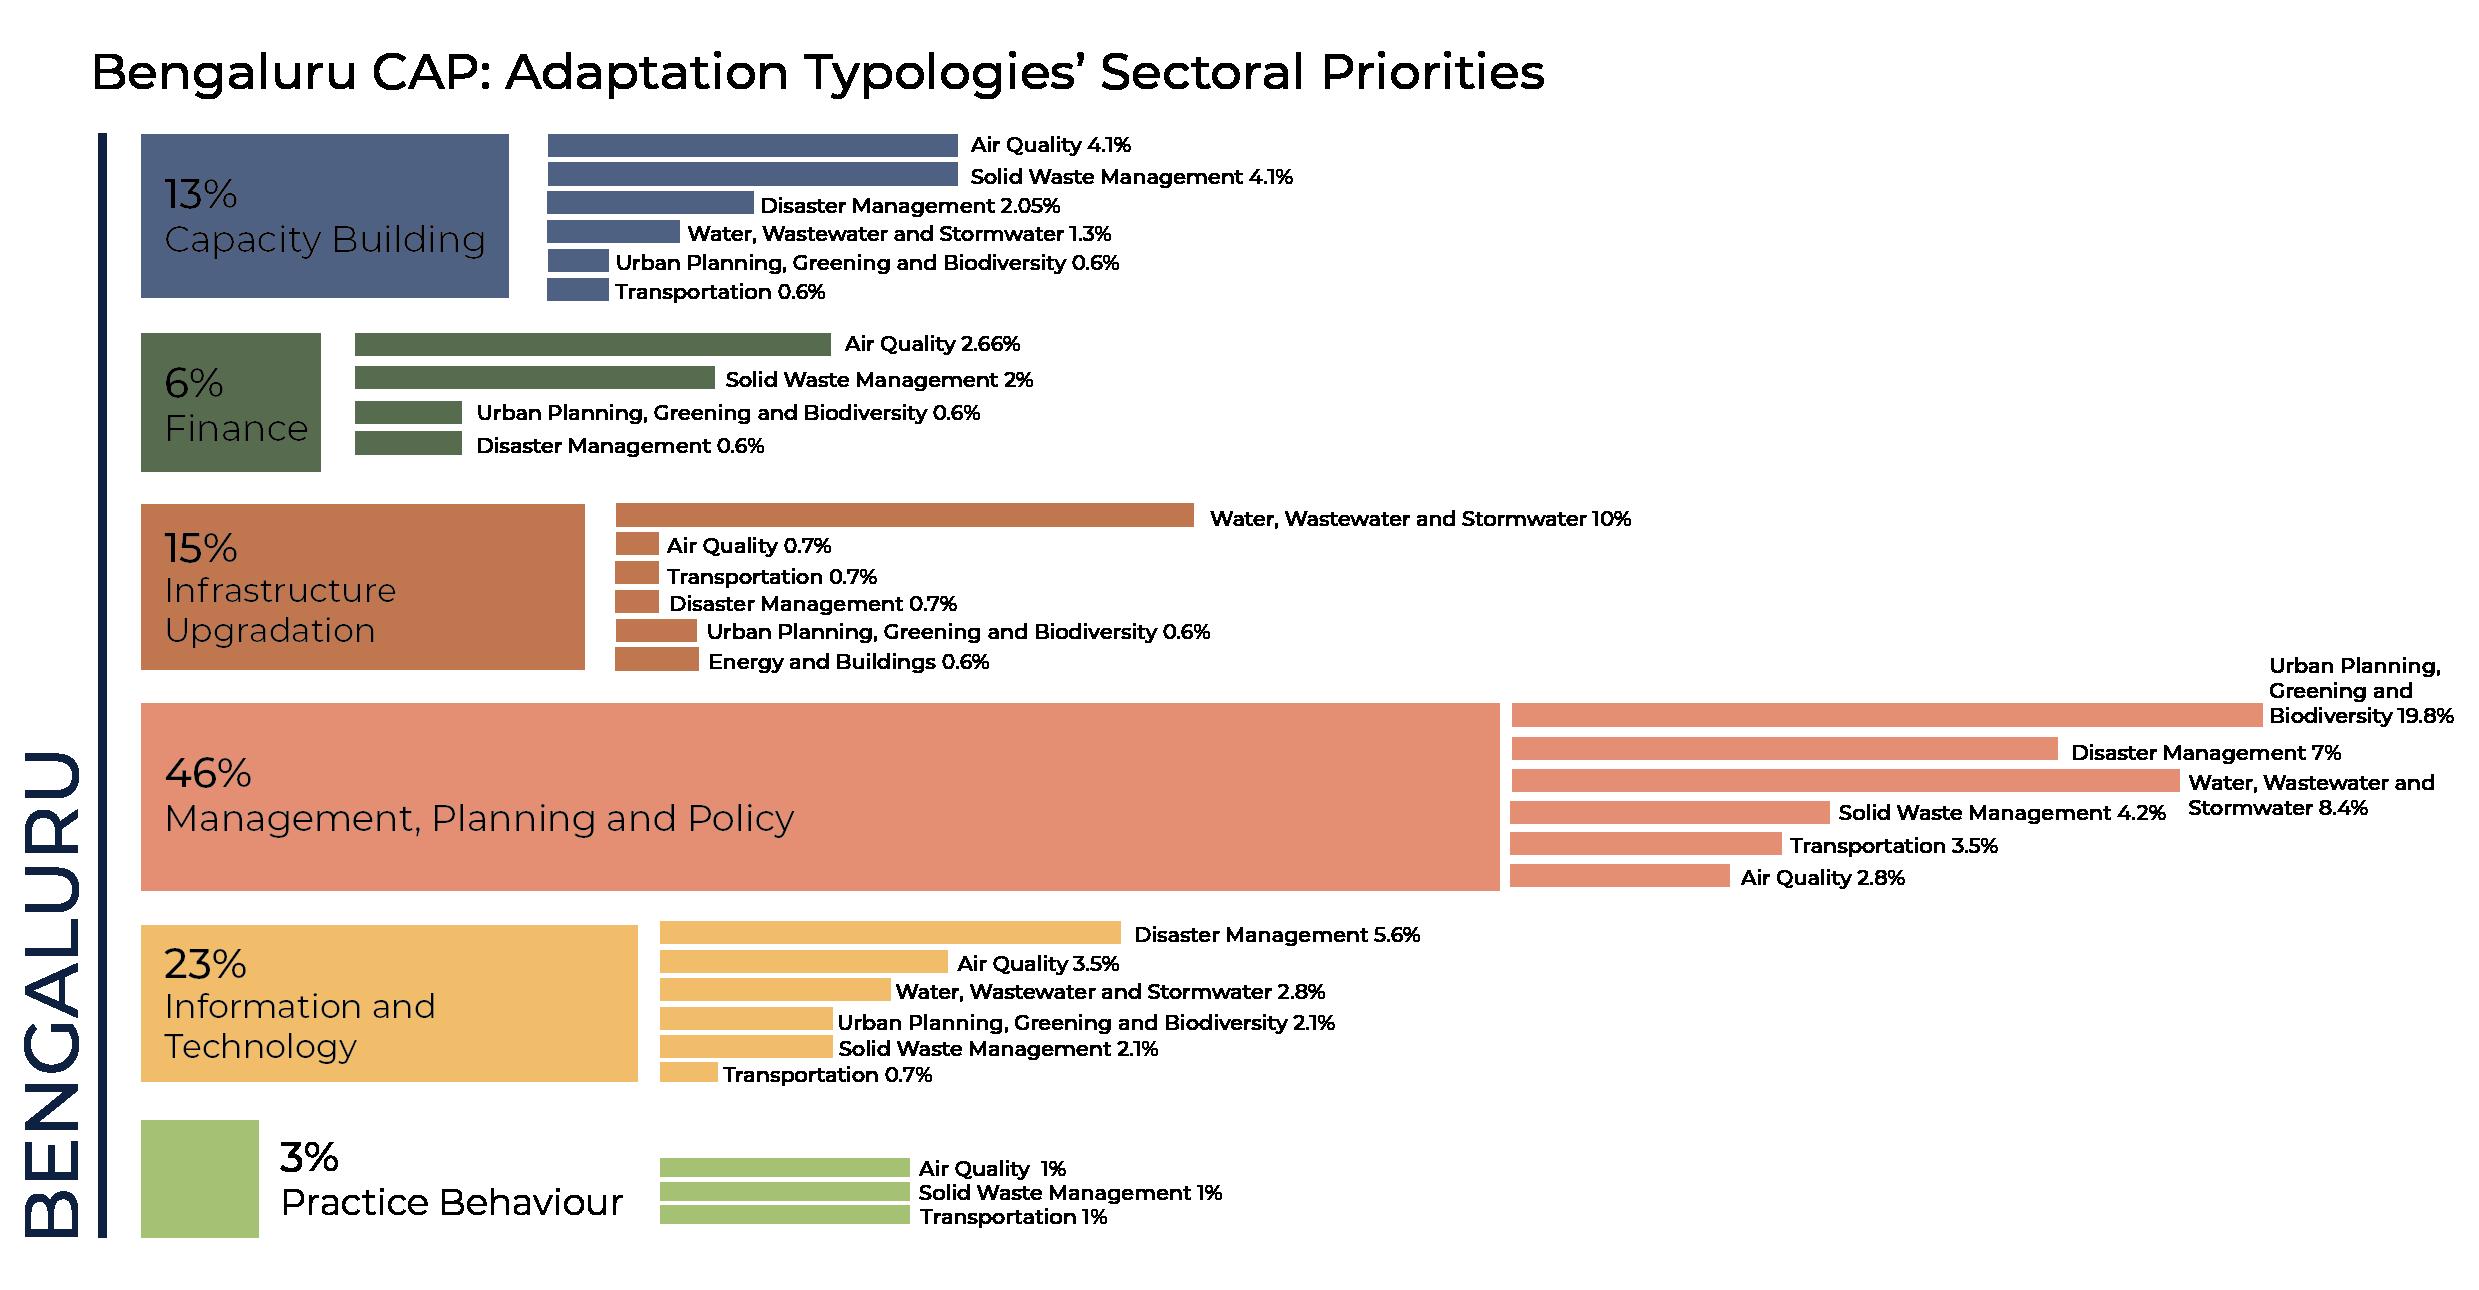
Fig 11. Distribution and sectoral priorities within Bengaluru’s adaptation typologies
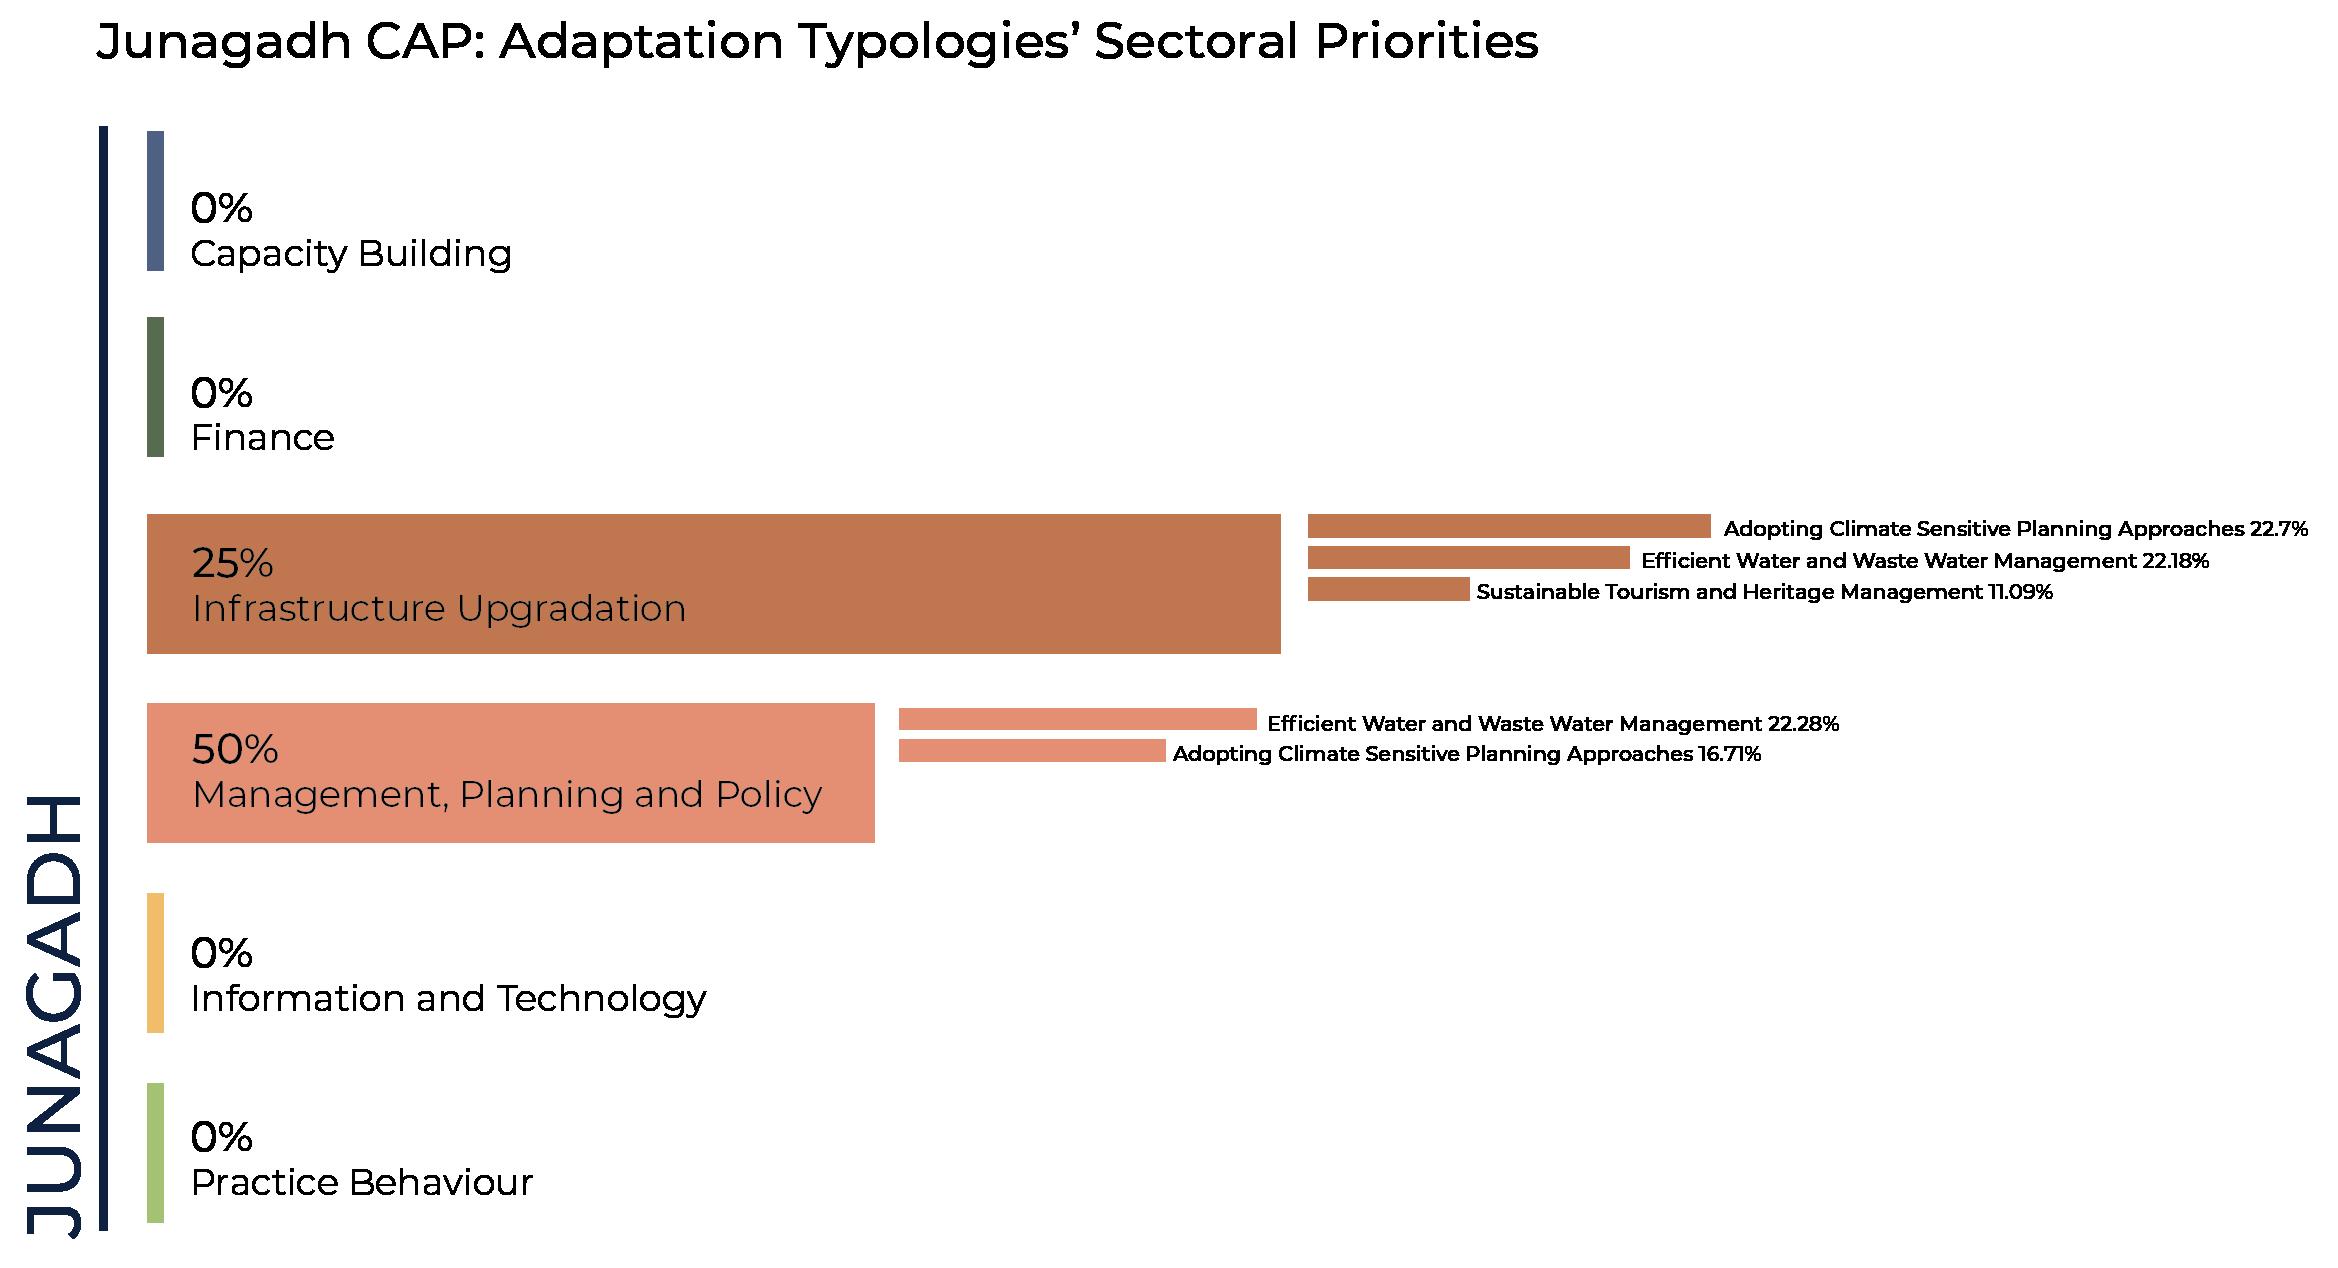
Fig 12. Distribution and sectoral priorities within Junagadh’s adaptation typologies
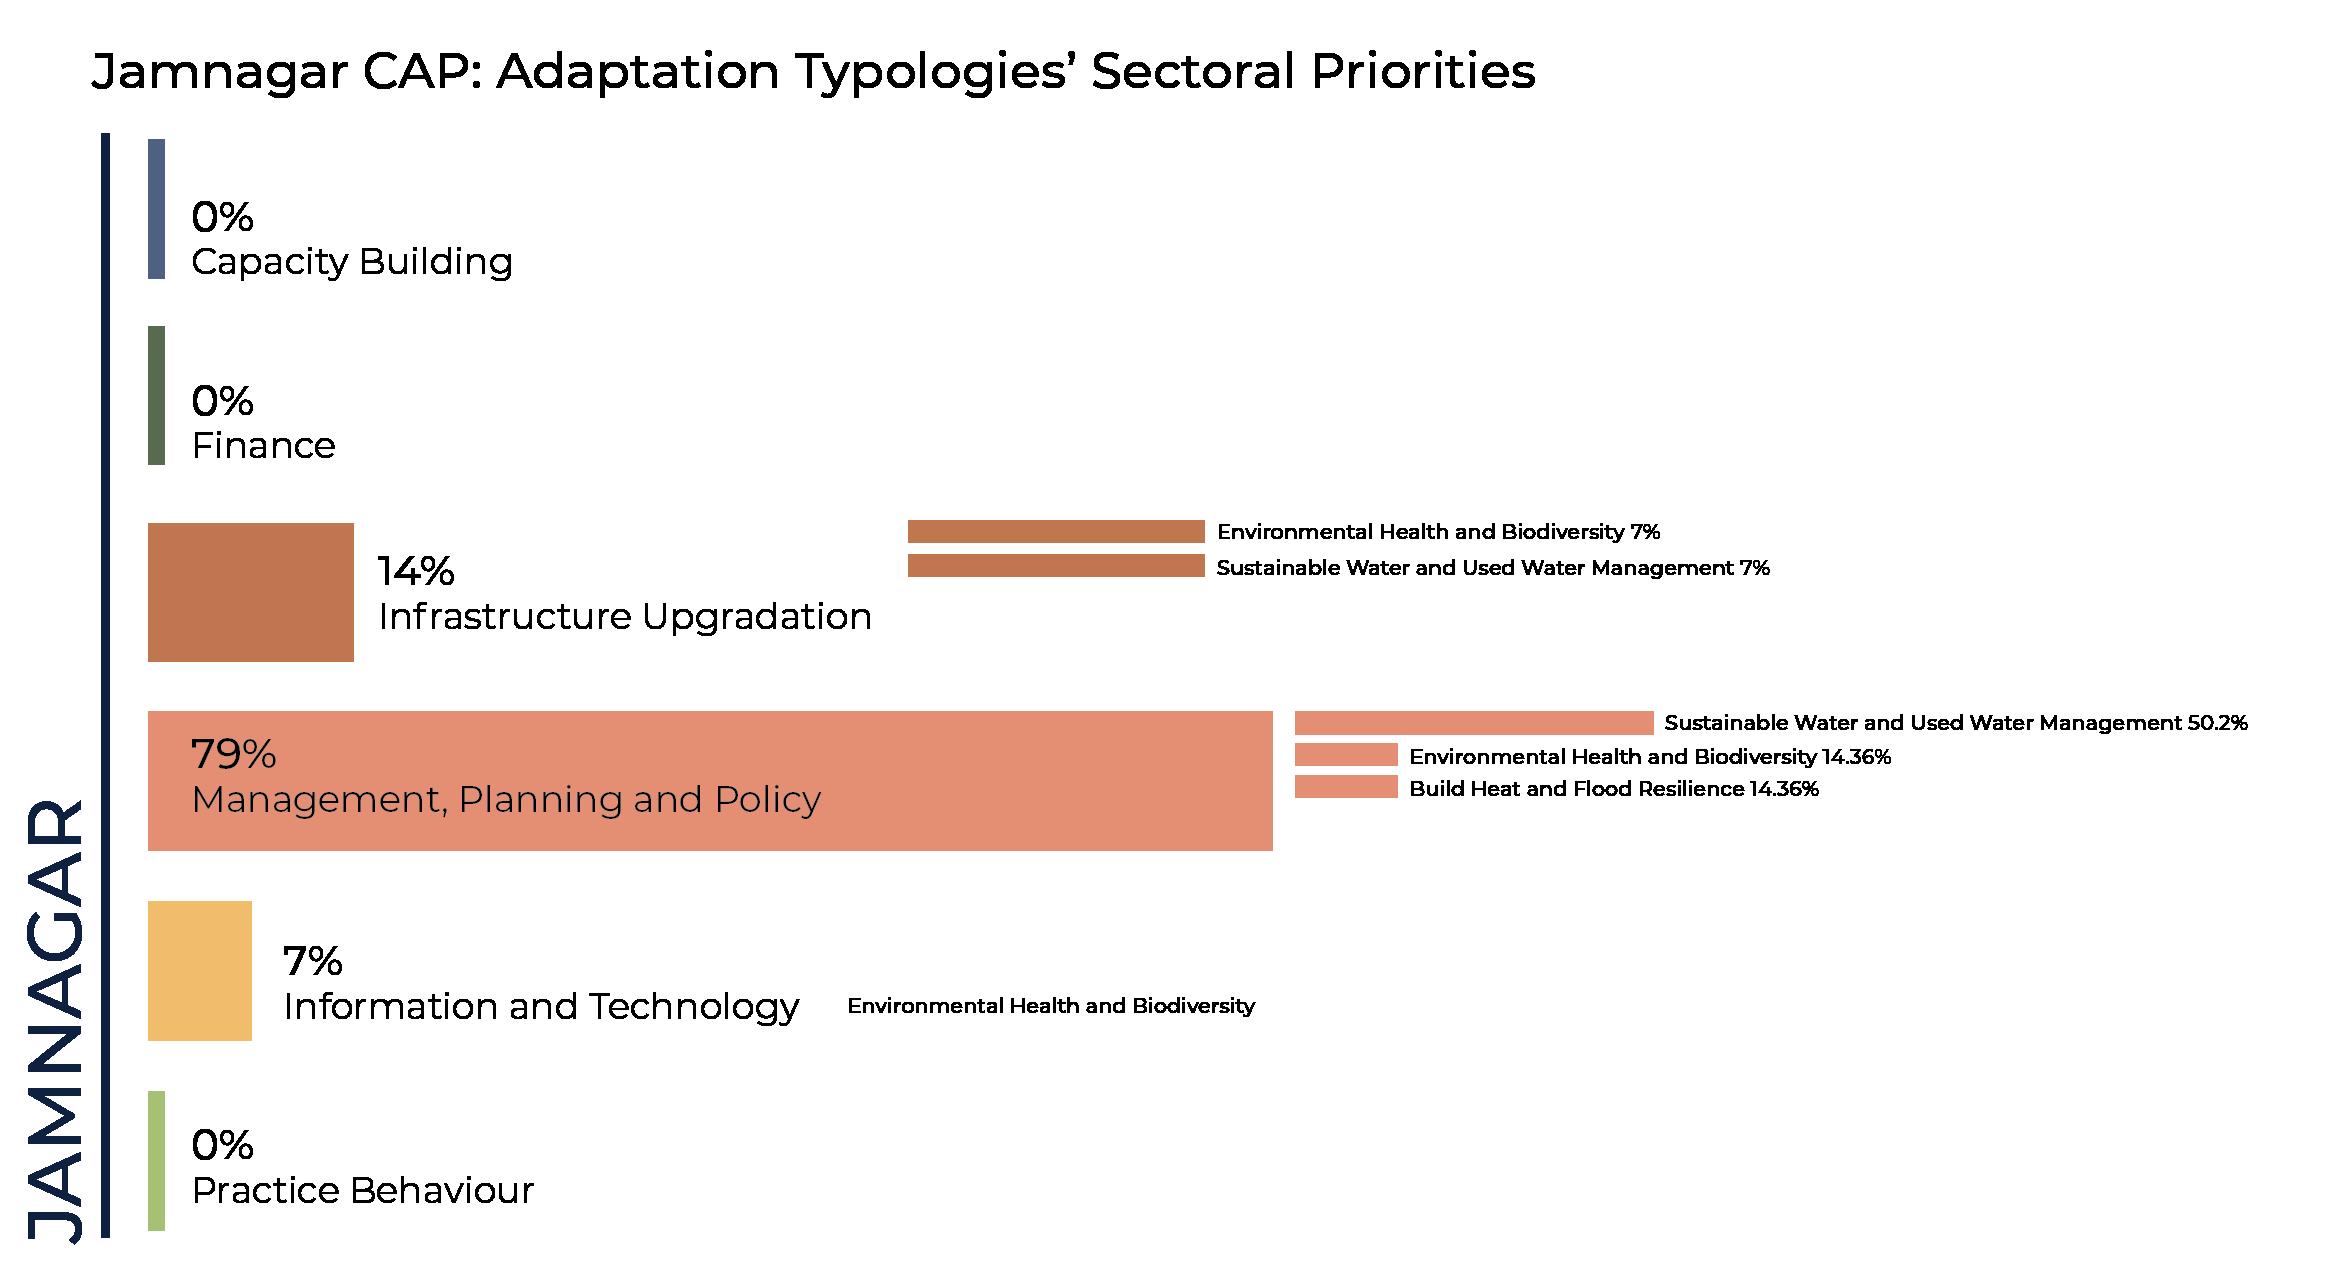
Fig 13. Distribution and sectoral priorities within Jamnagar’s adaptation typologies
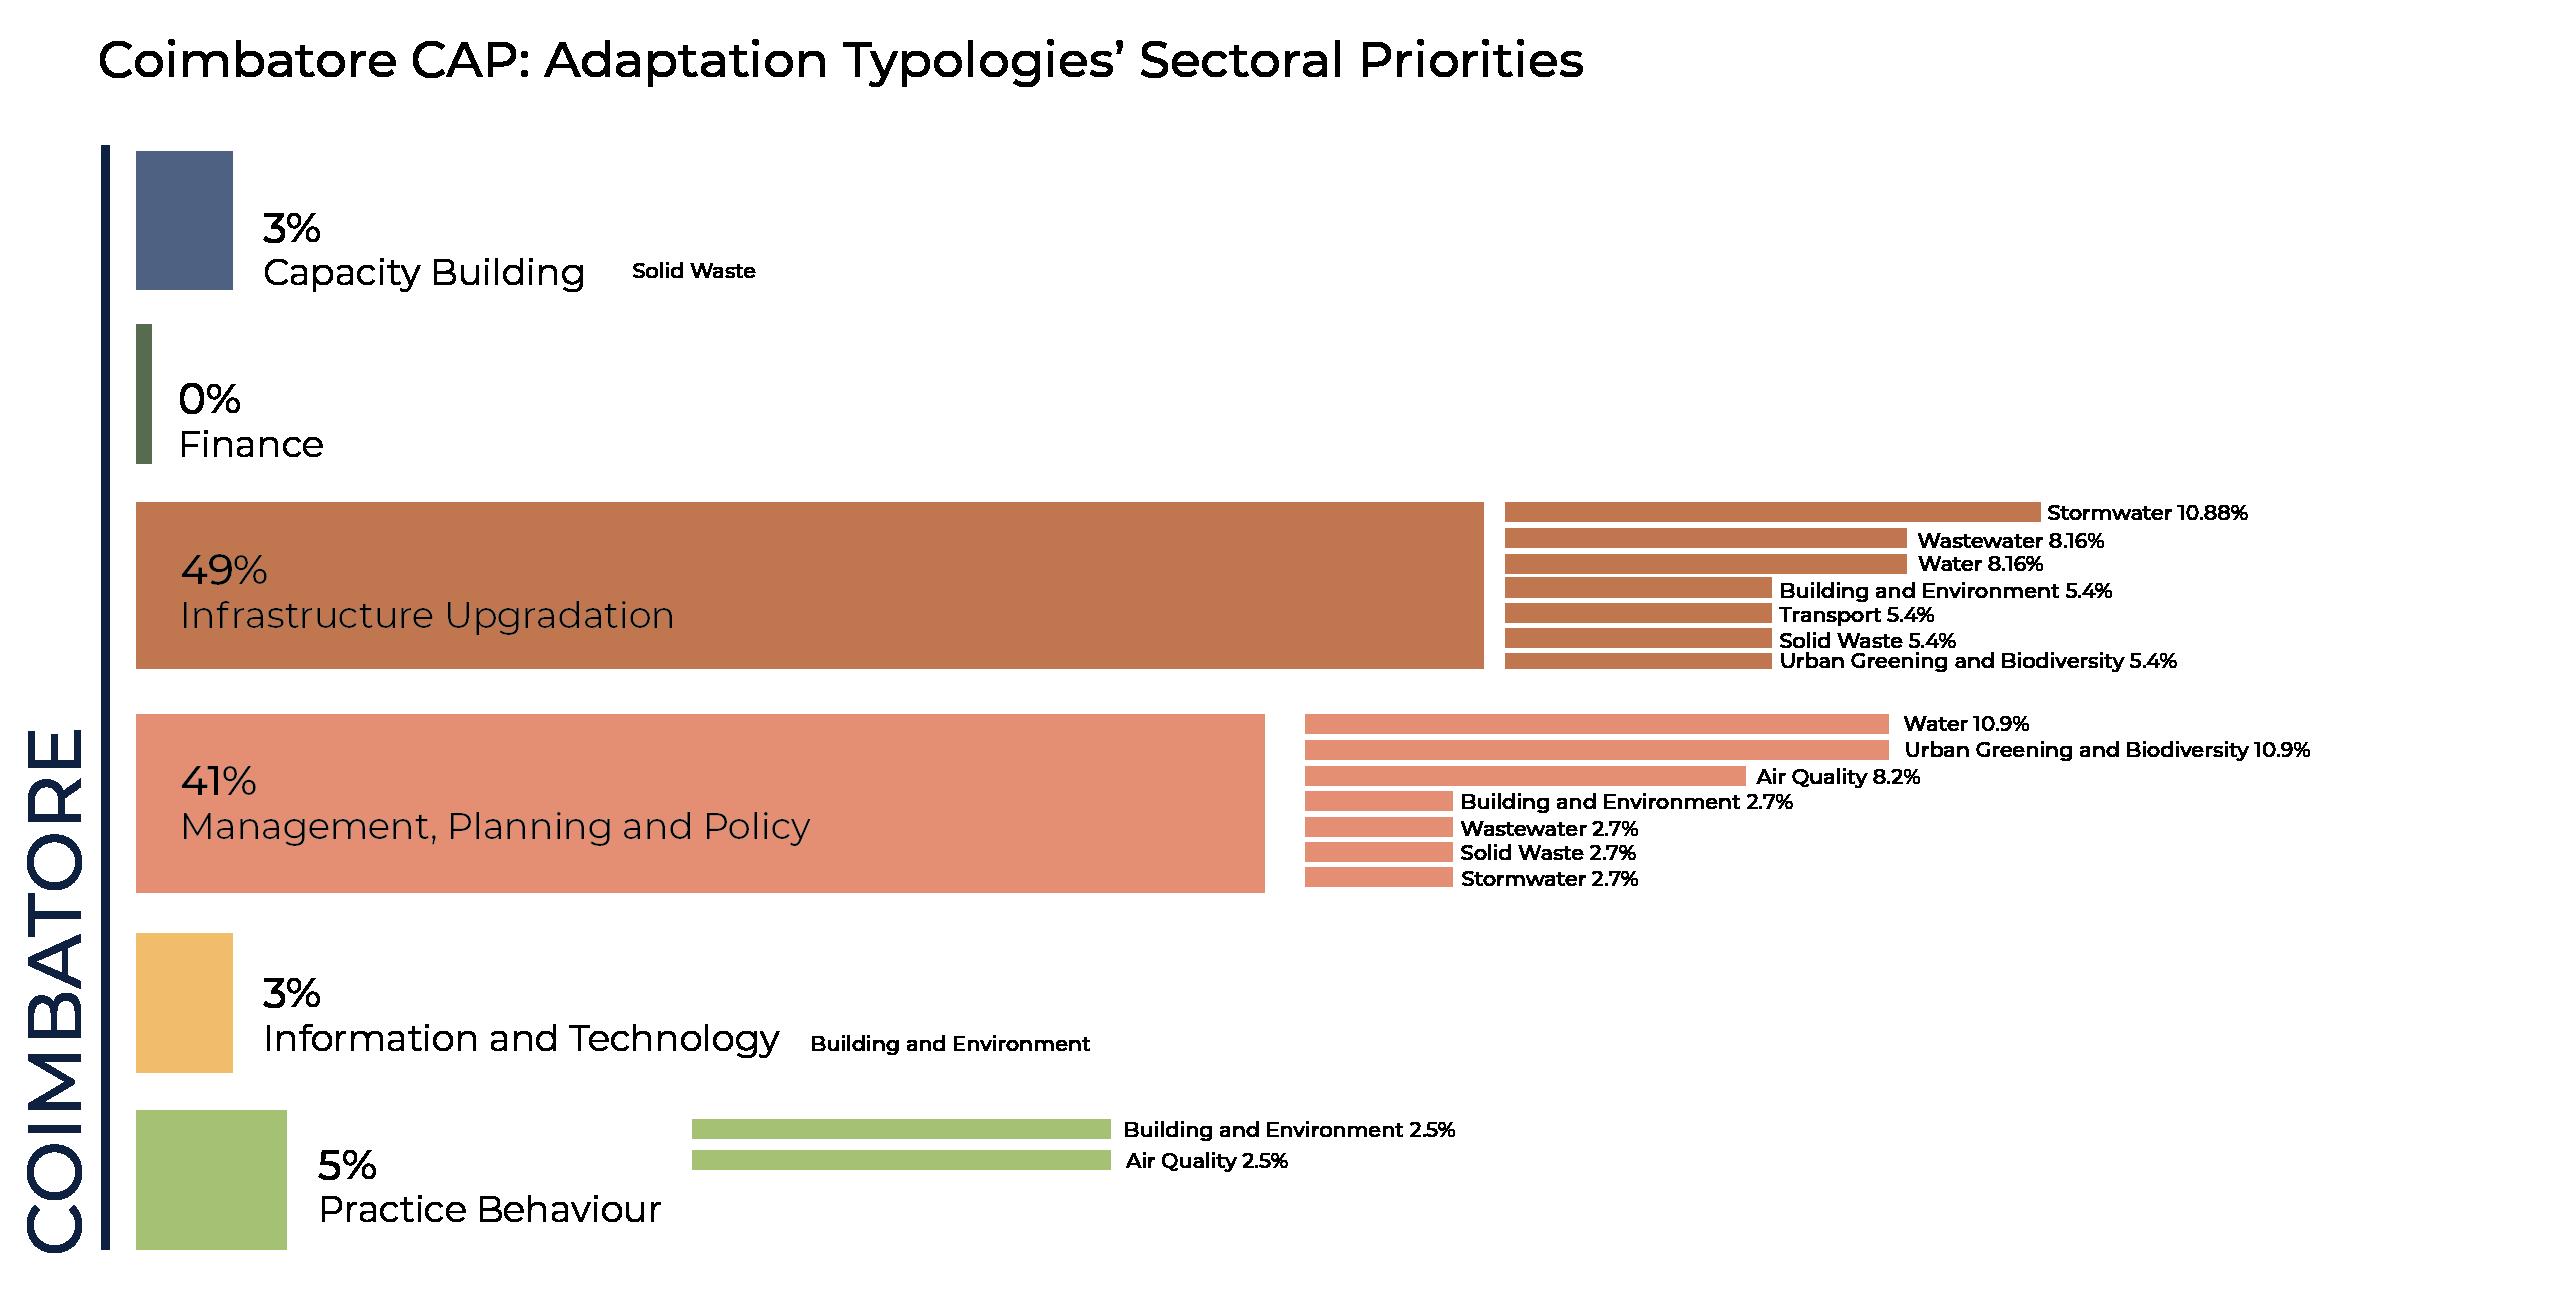
Fig 14. Distribution and sectoral priorities within Coimbatore’s adaptation typologies
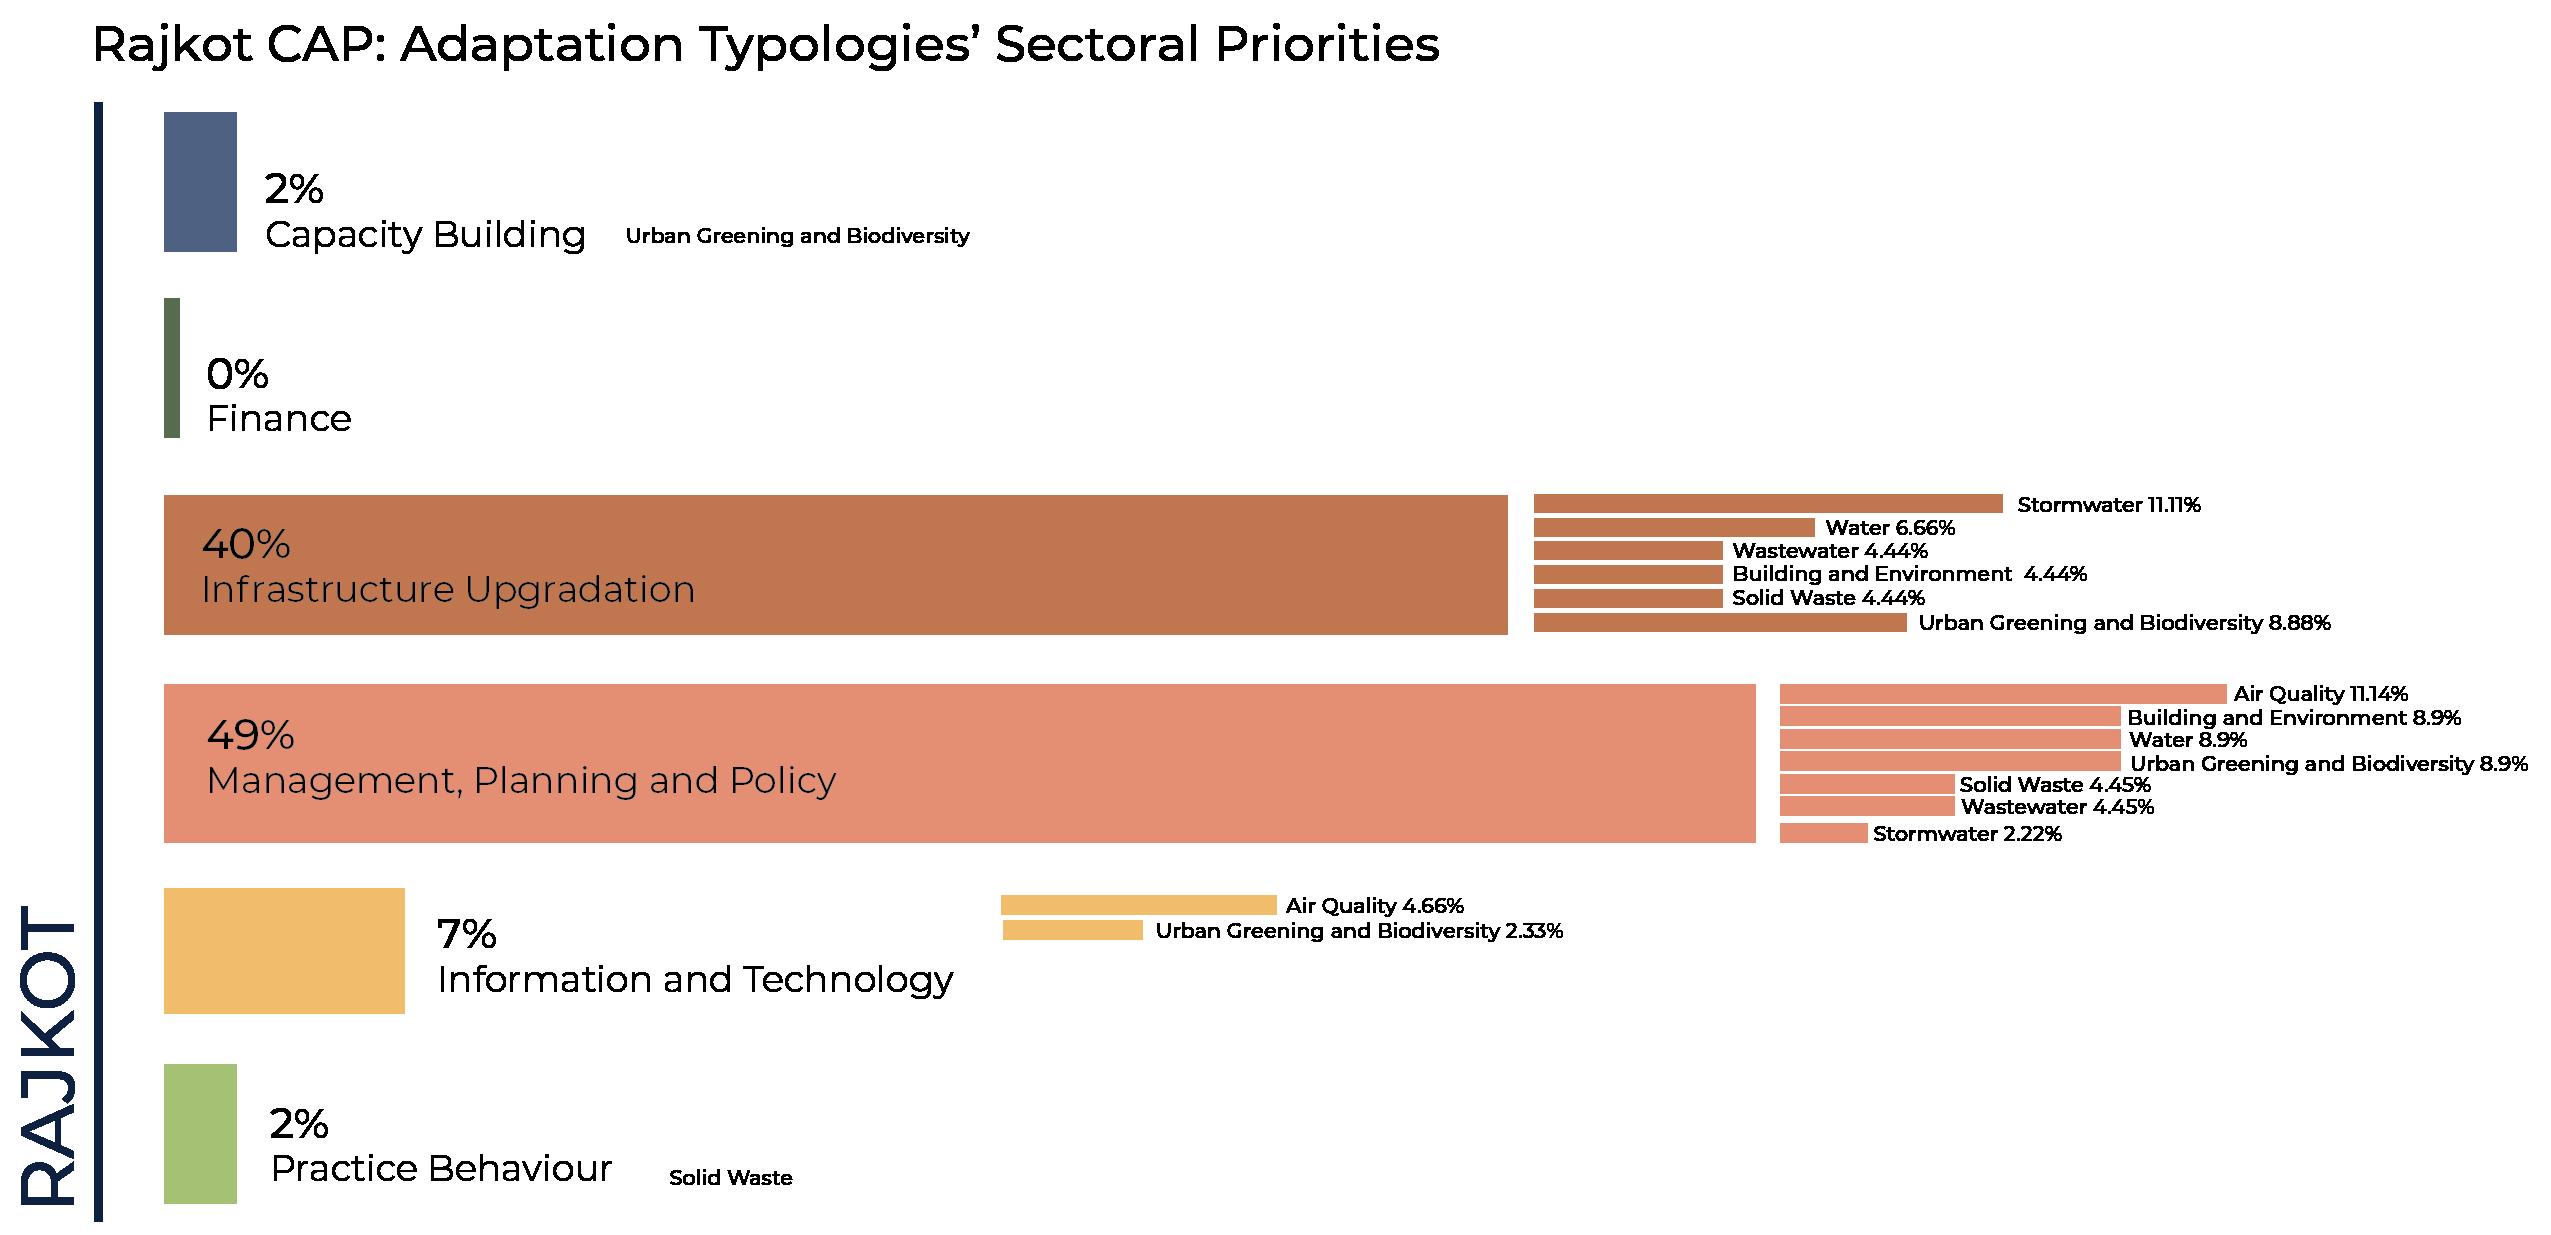
Fig 15. Distribution and sectoral priorities within Rajkot’s adaptation typologies
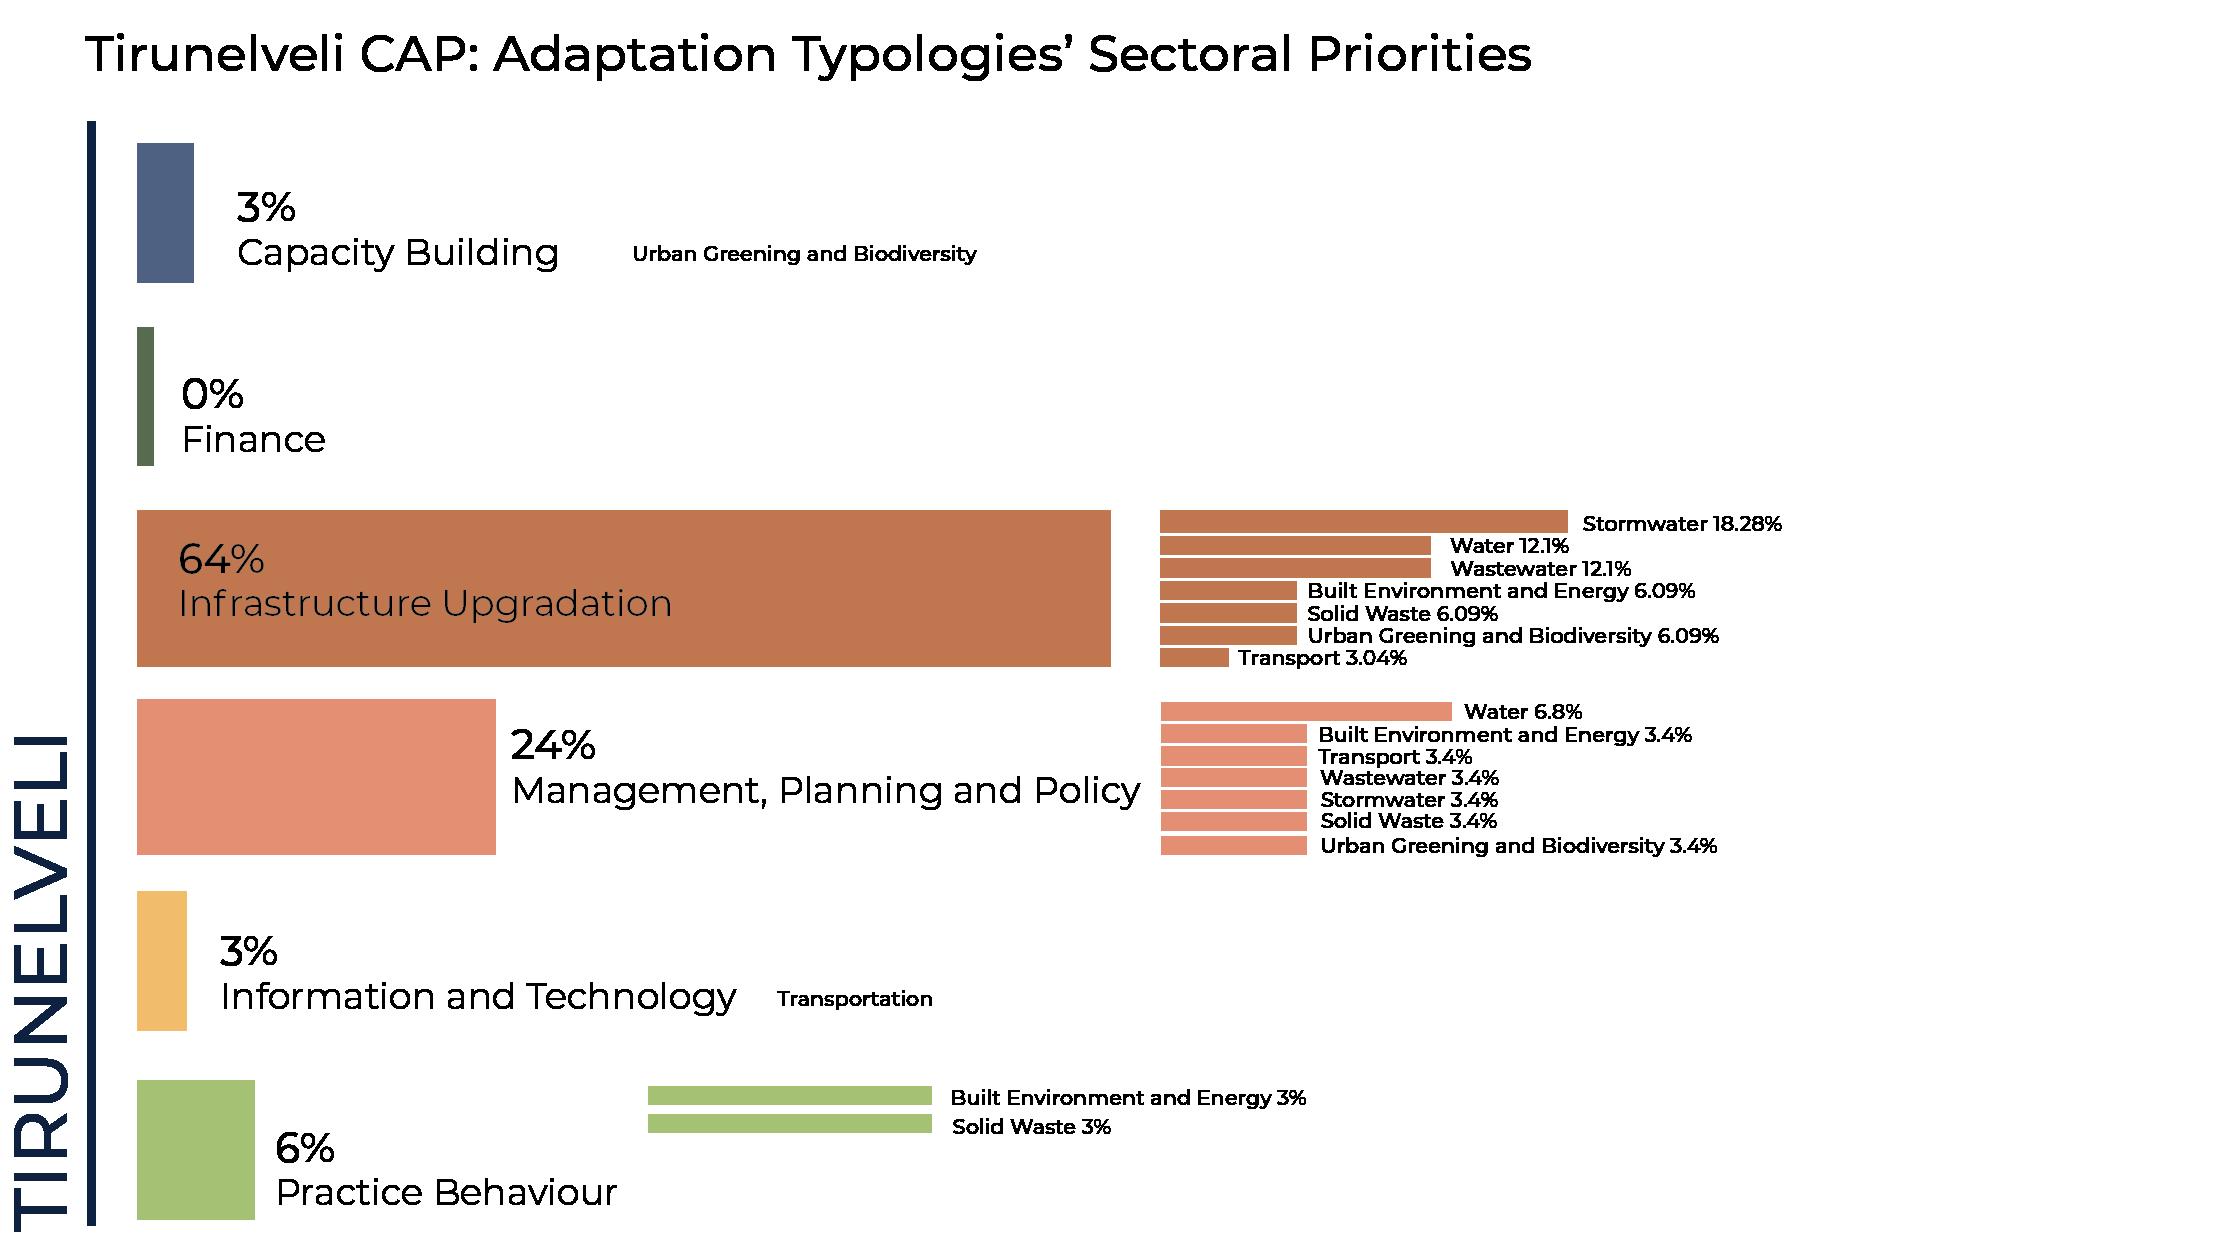
Fig 16. Distribution and sectoral priorities within Tirunelveli’s adaptation typologies
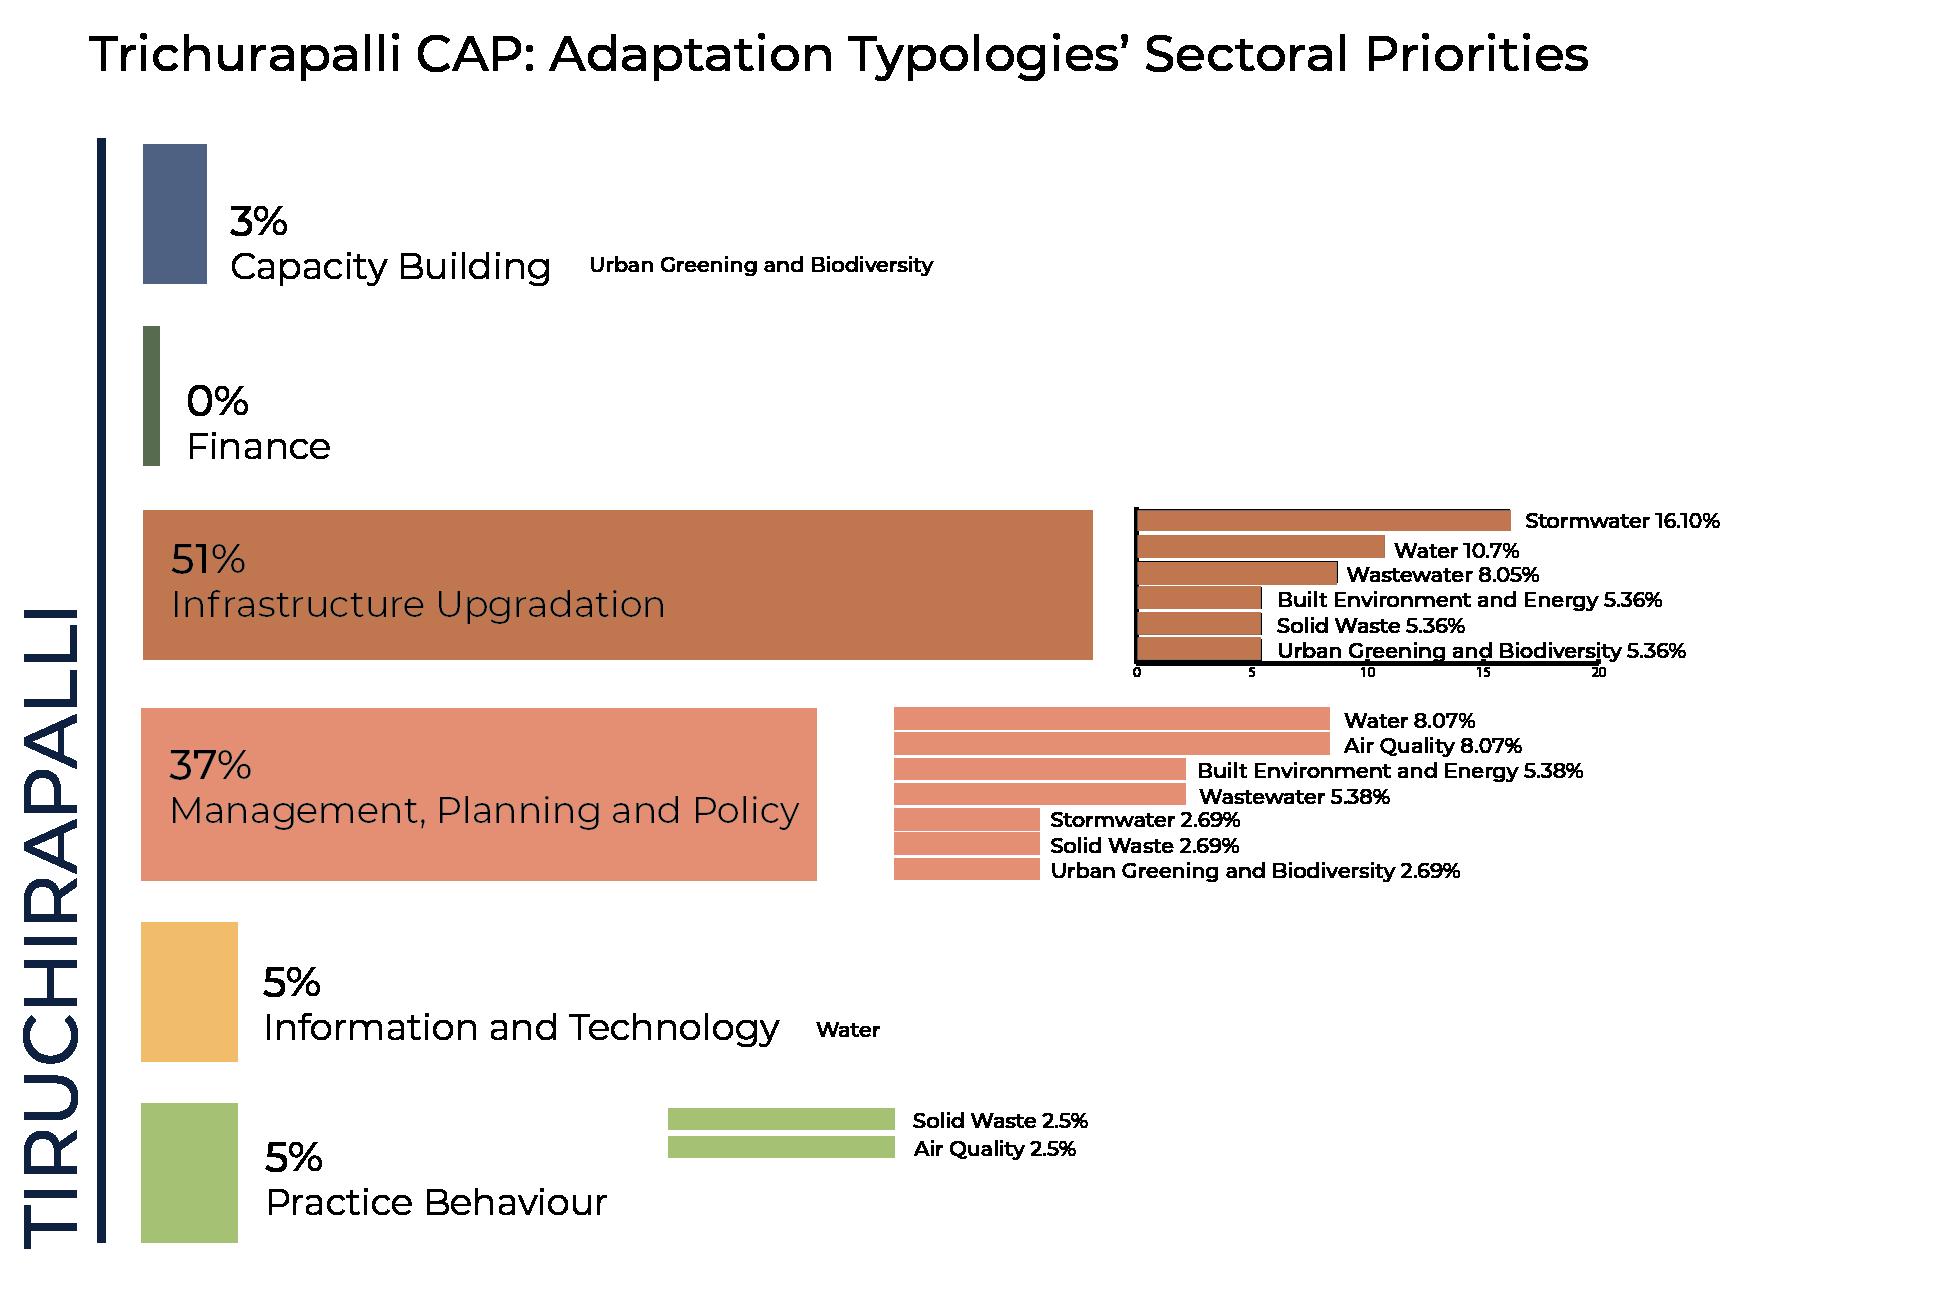
Fig 17. Distribution and sectoral priorities within Tiruchirapalli’s adaptation typologies
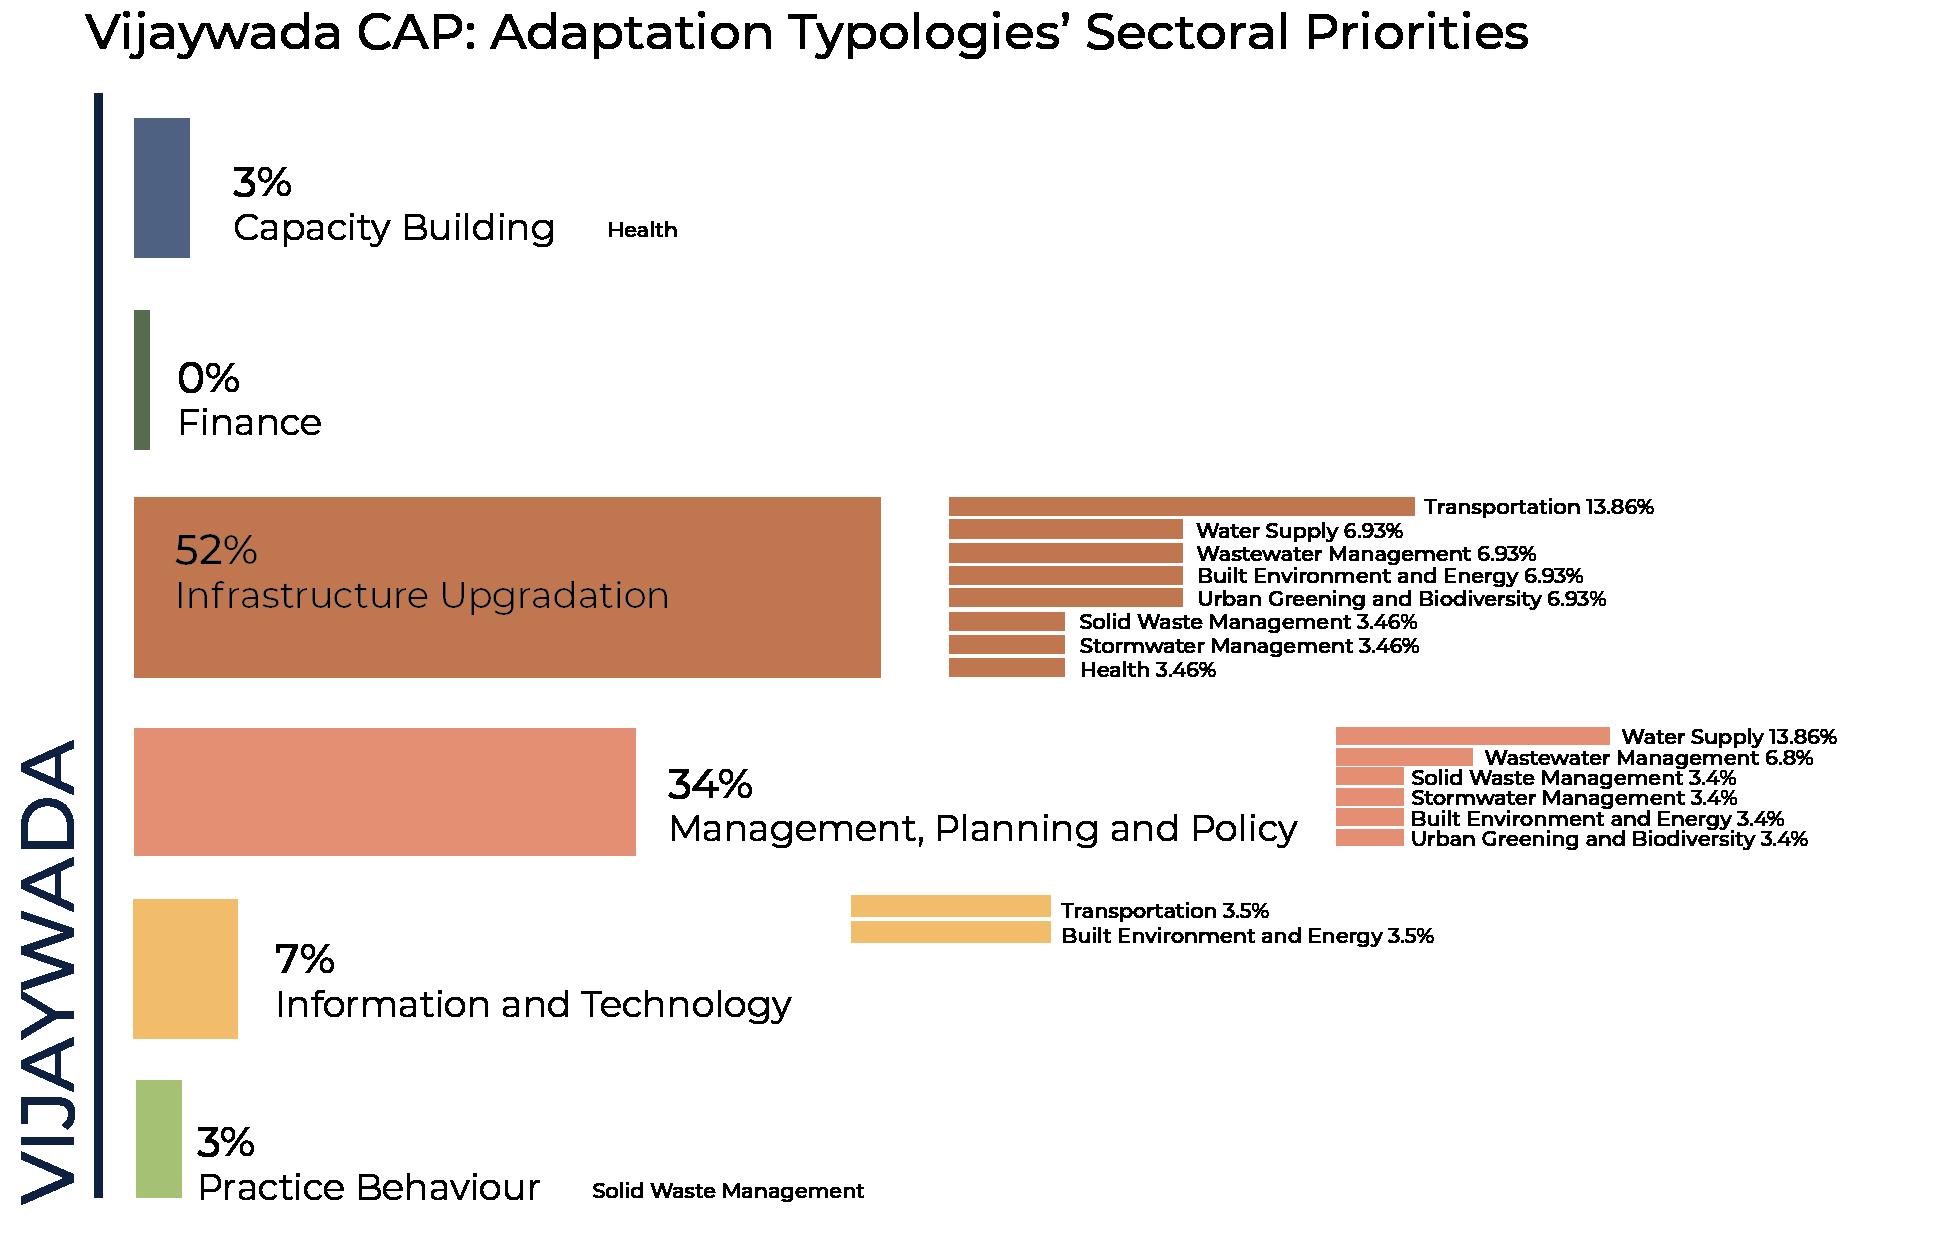
Fig 18. Distribution and sectoral priorities within Vijaywada’s adaptation typologies
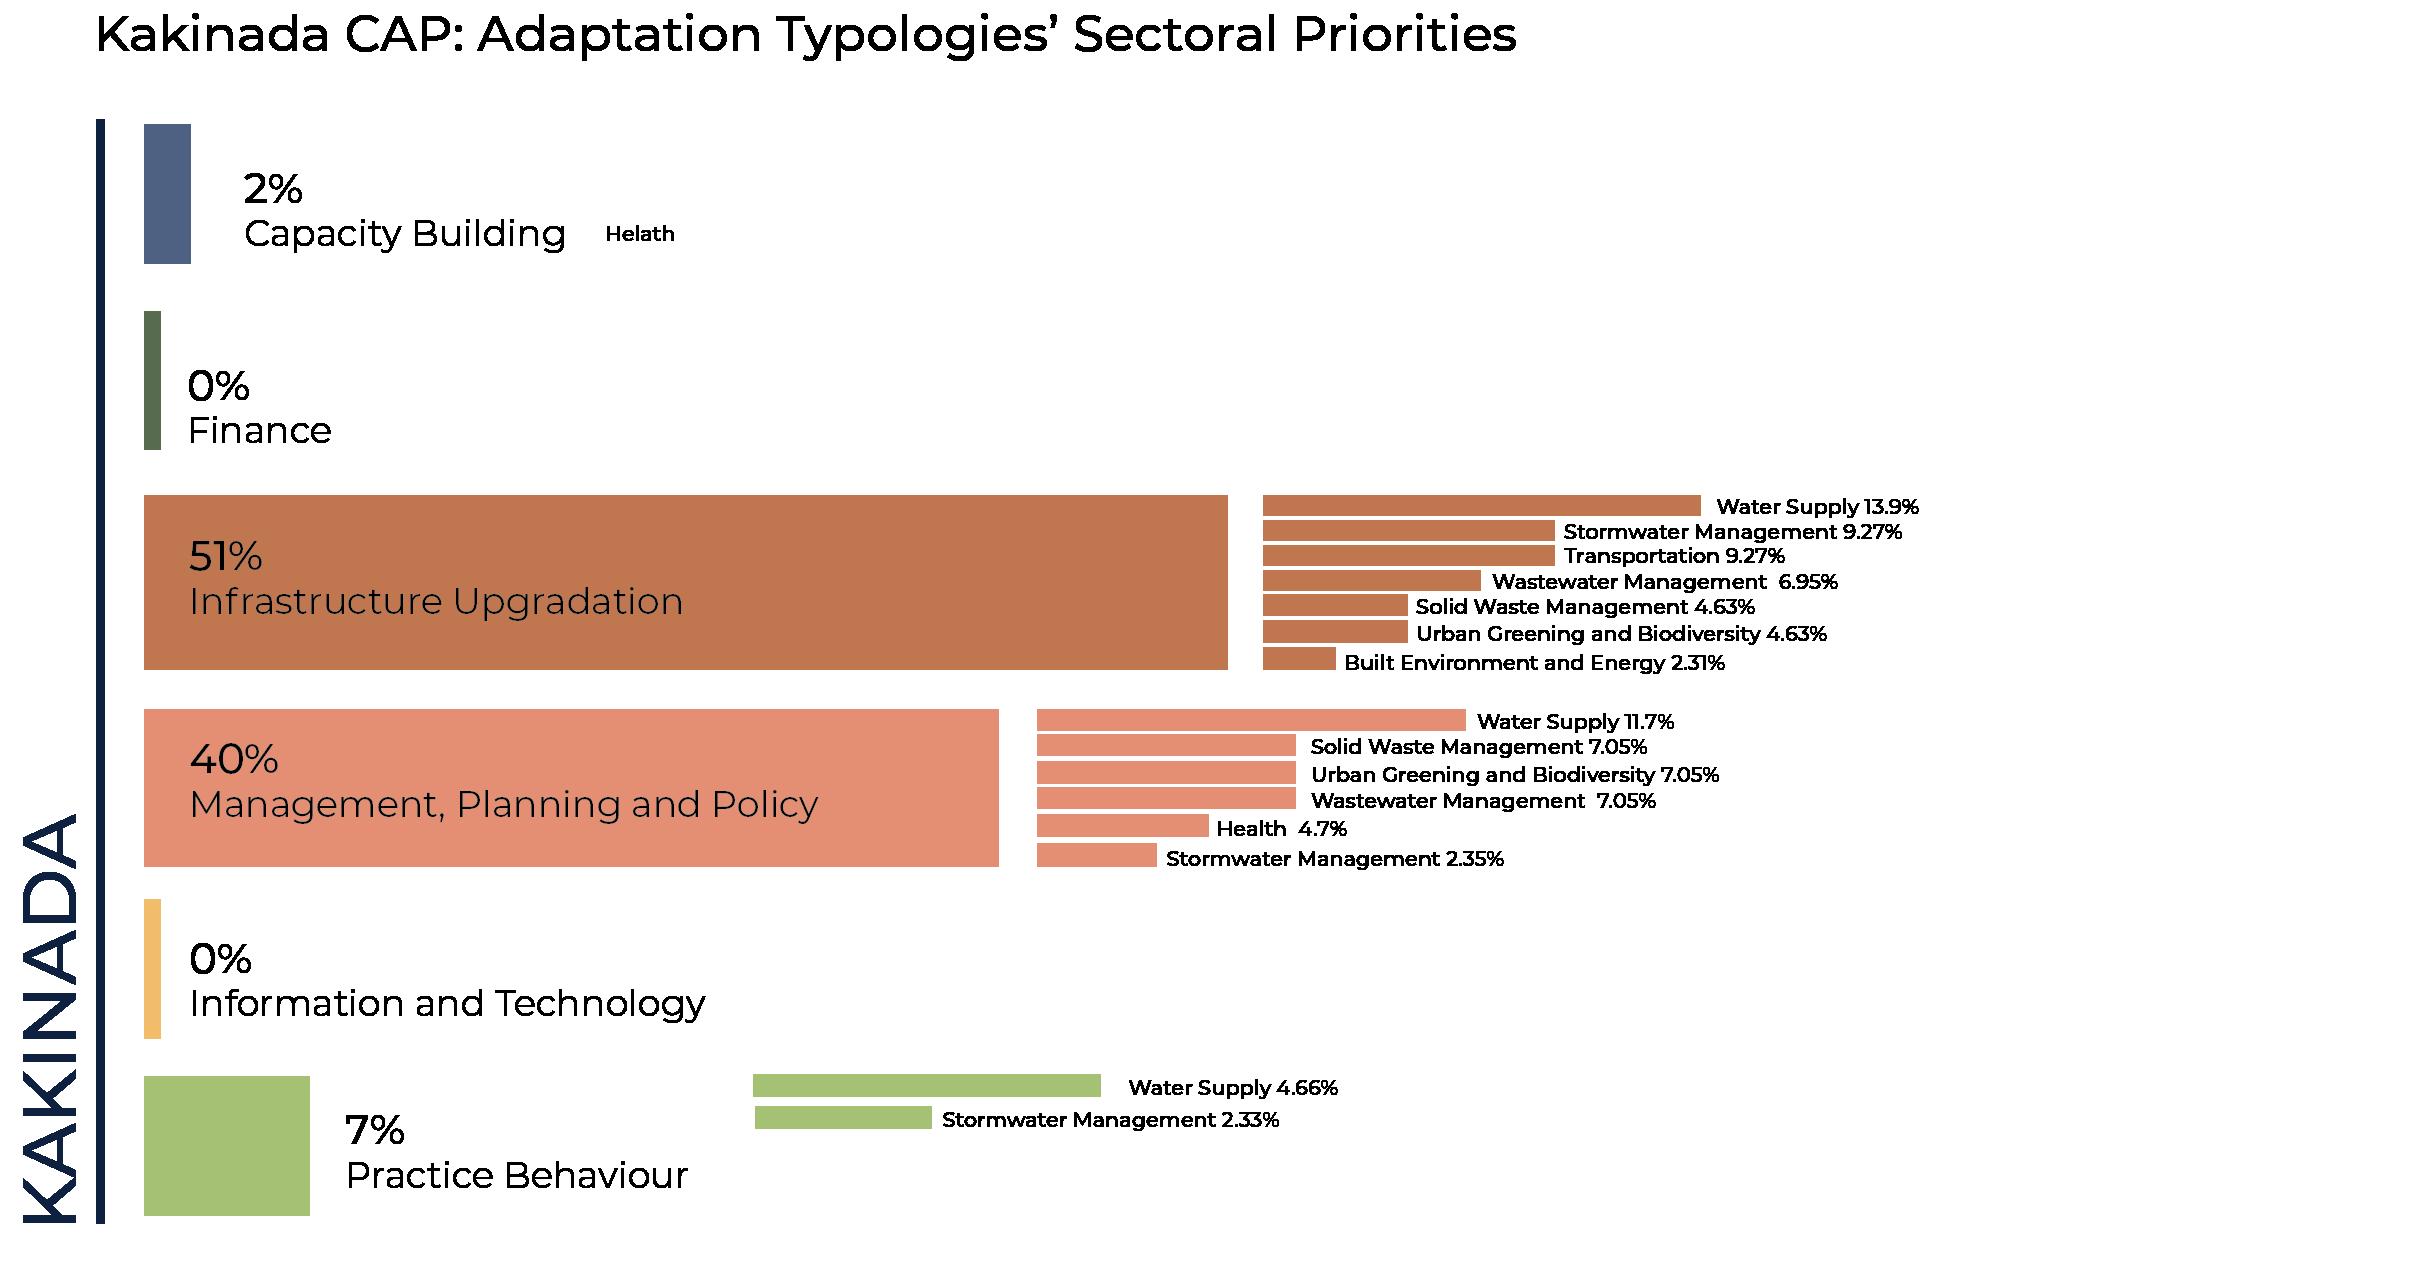
Fig 19. Distribution and sectoral priorities within Kakinada’s adaptation typologies
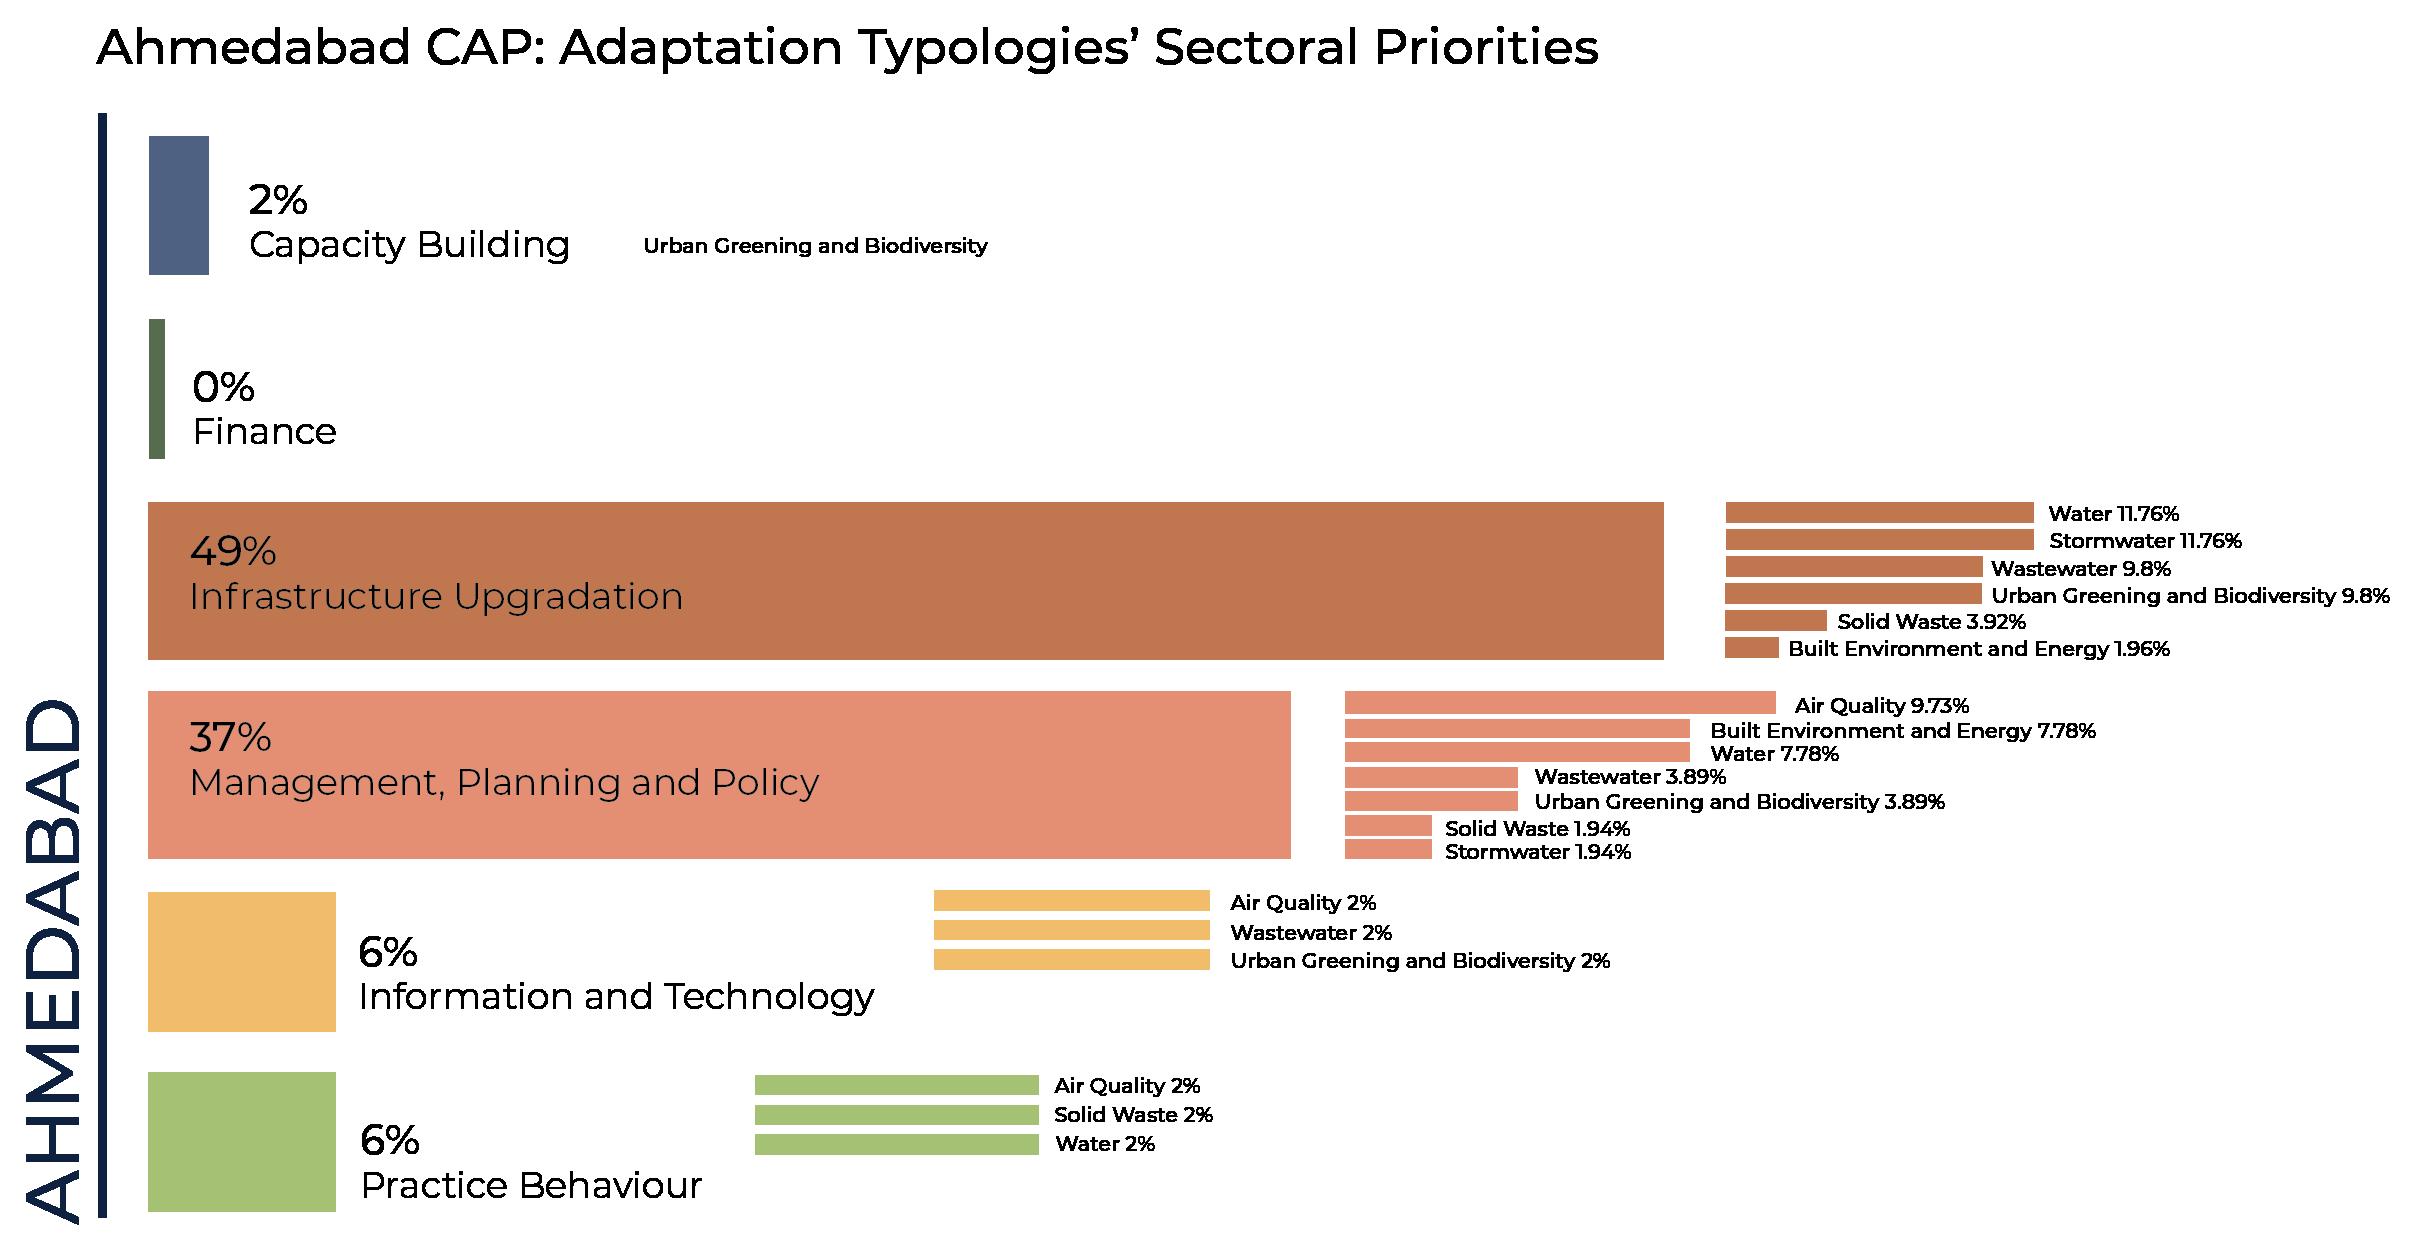
Fig 20. Distribution and sectoral priorities within Ahmedabad’s adaptation typologies
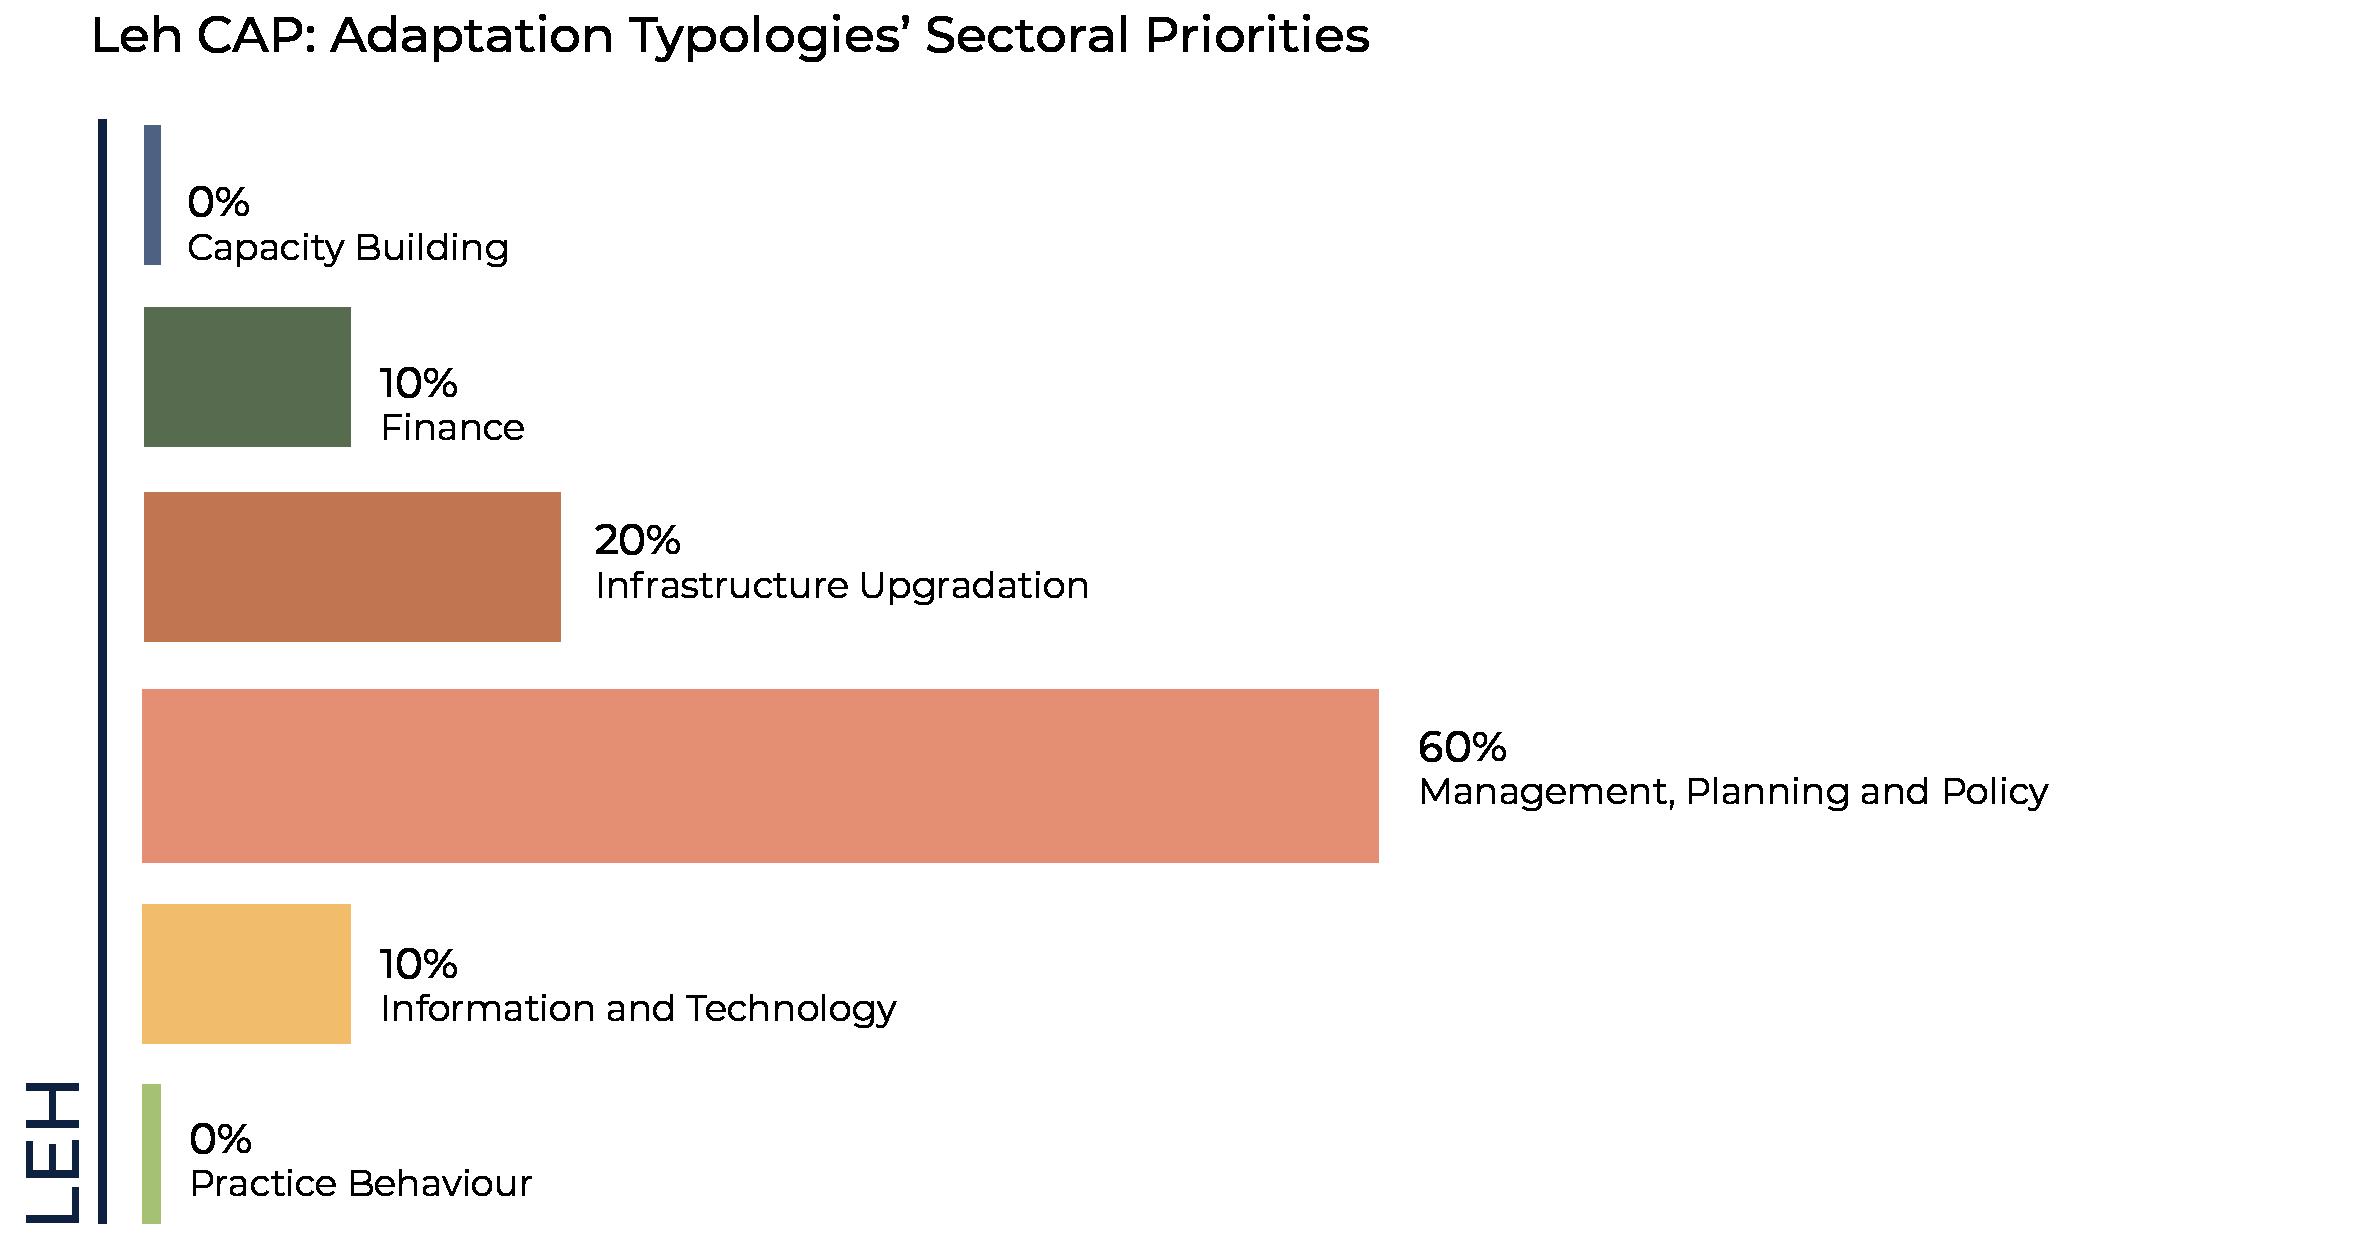
Fig 21. Distribution and sectoral priorities within Leh’s adaptation typologies
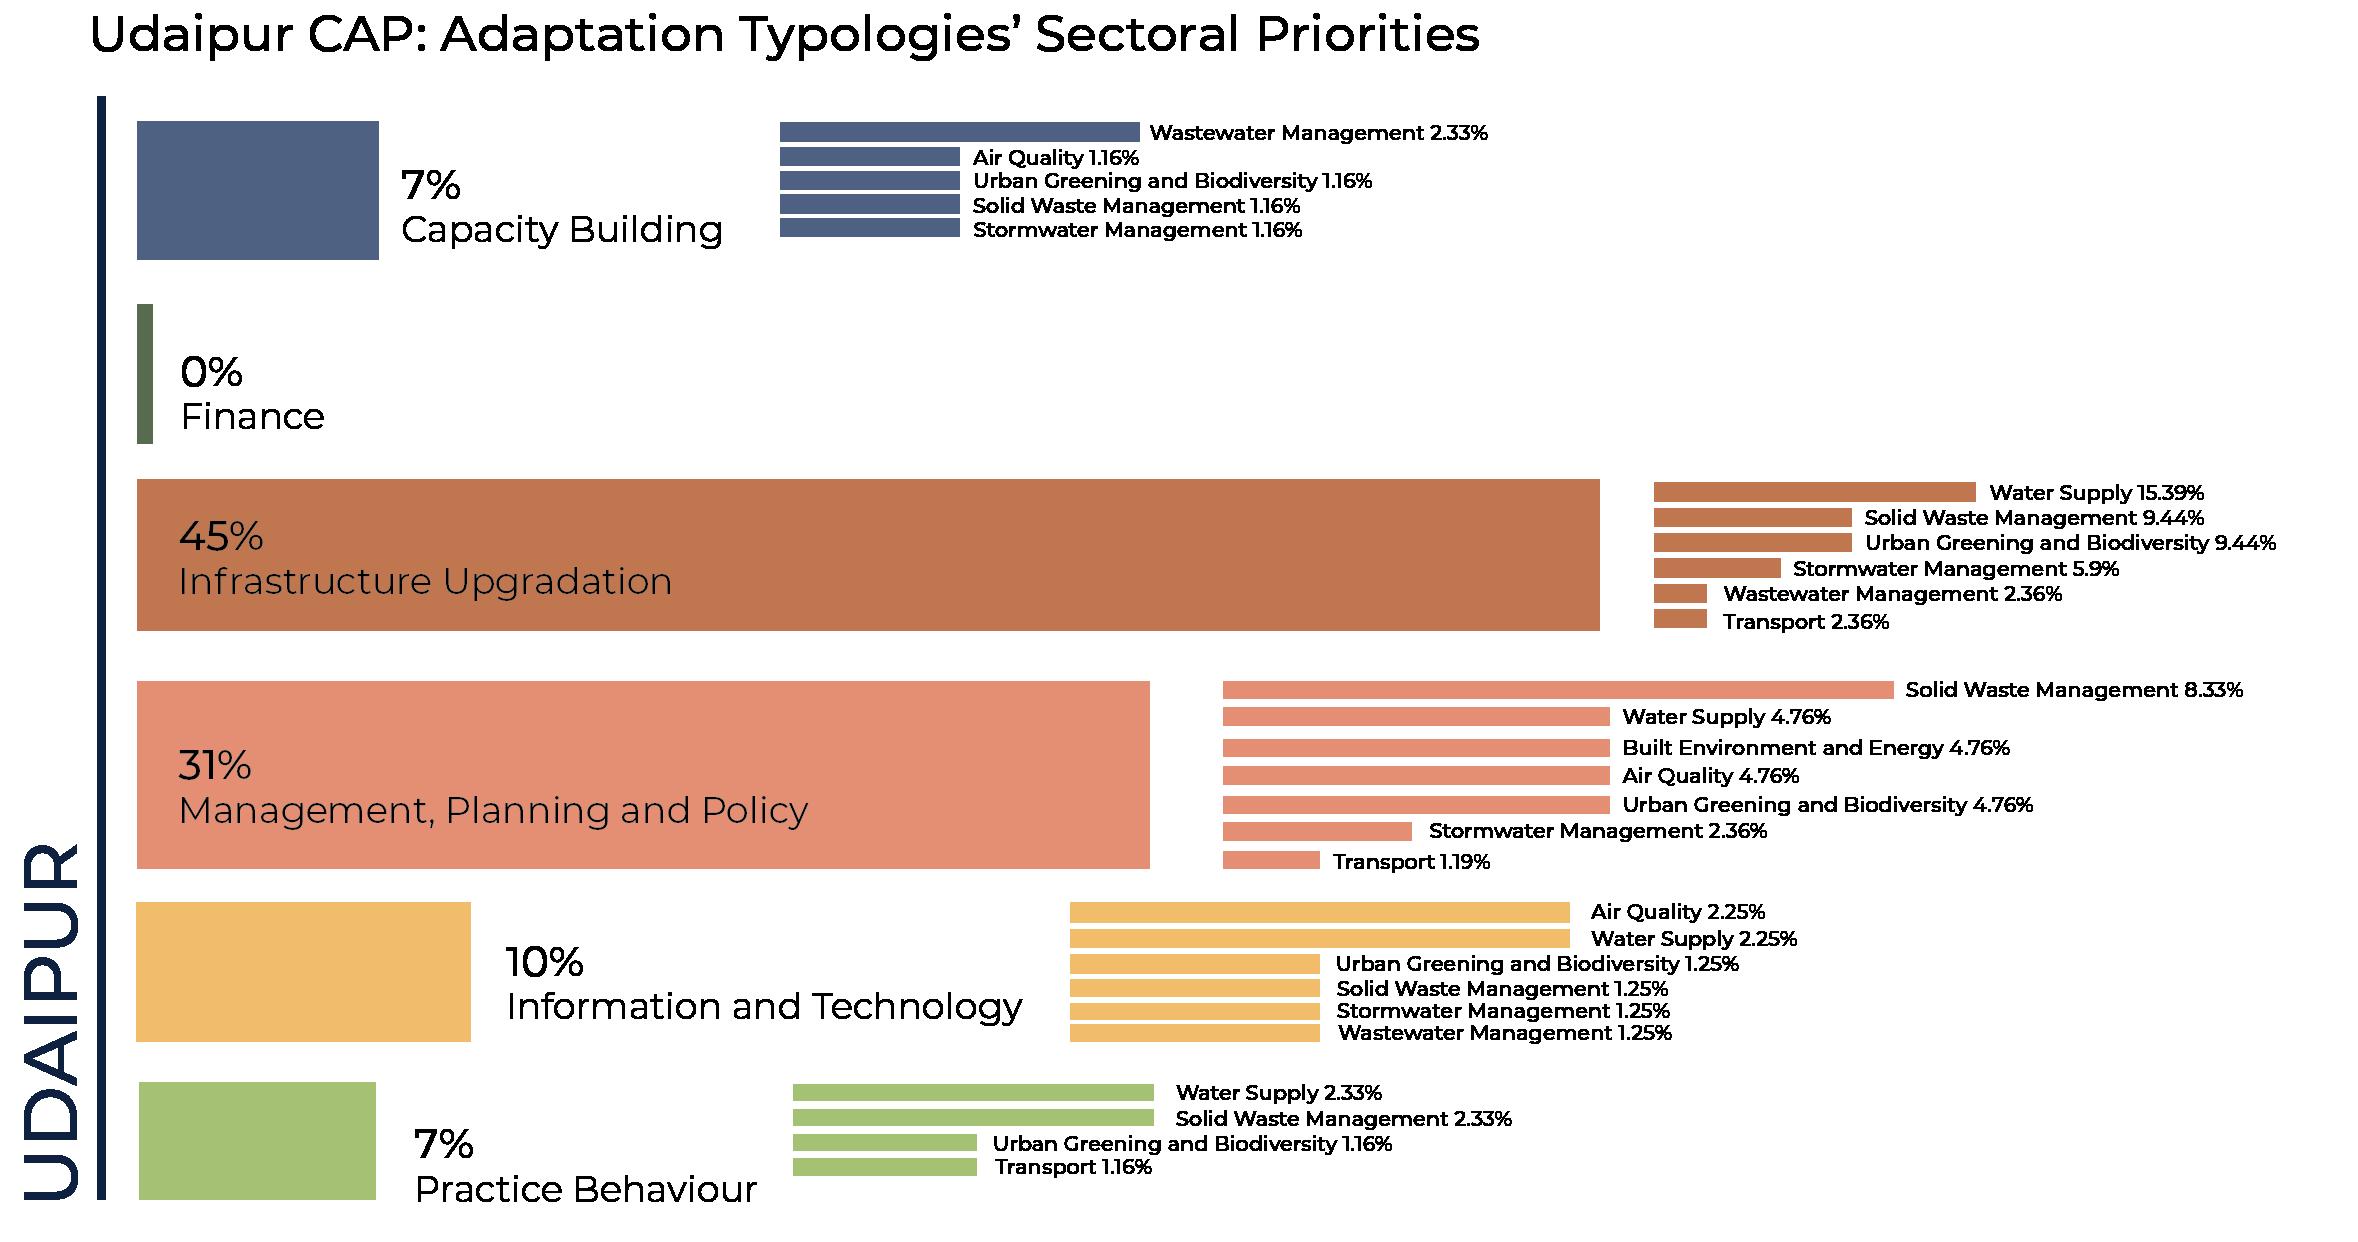
Fig 22. Distribution and sectoral priorities within Udaipur’s adaptation typologies
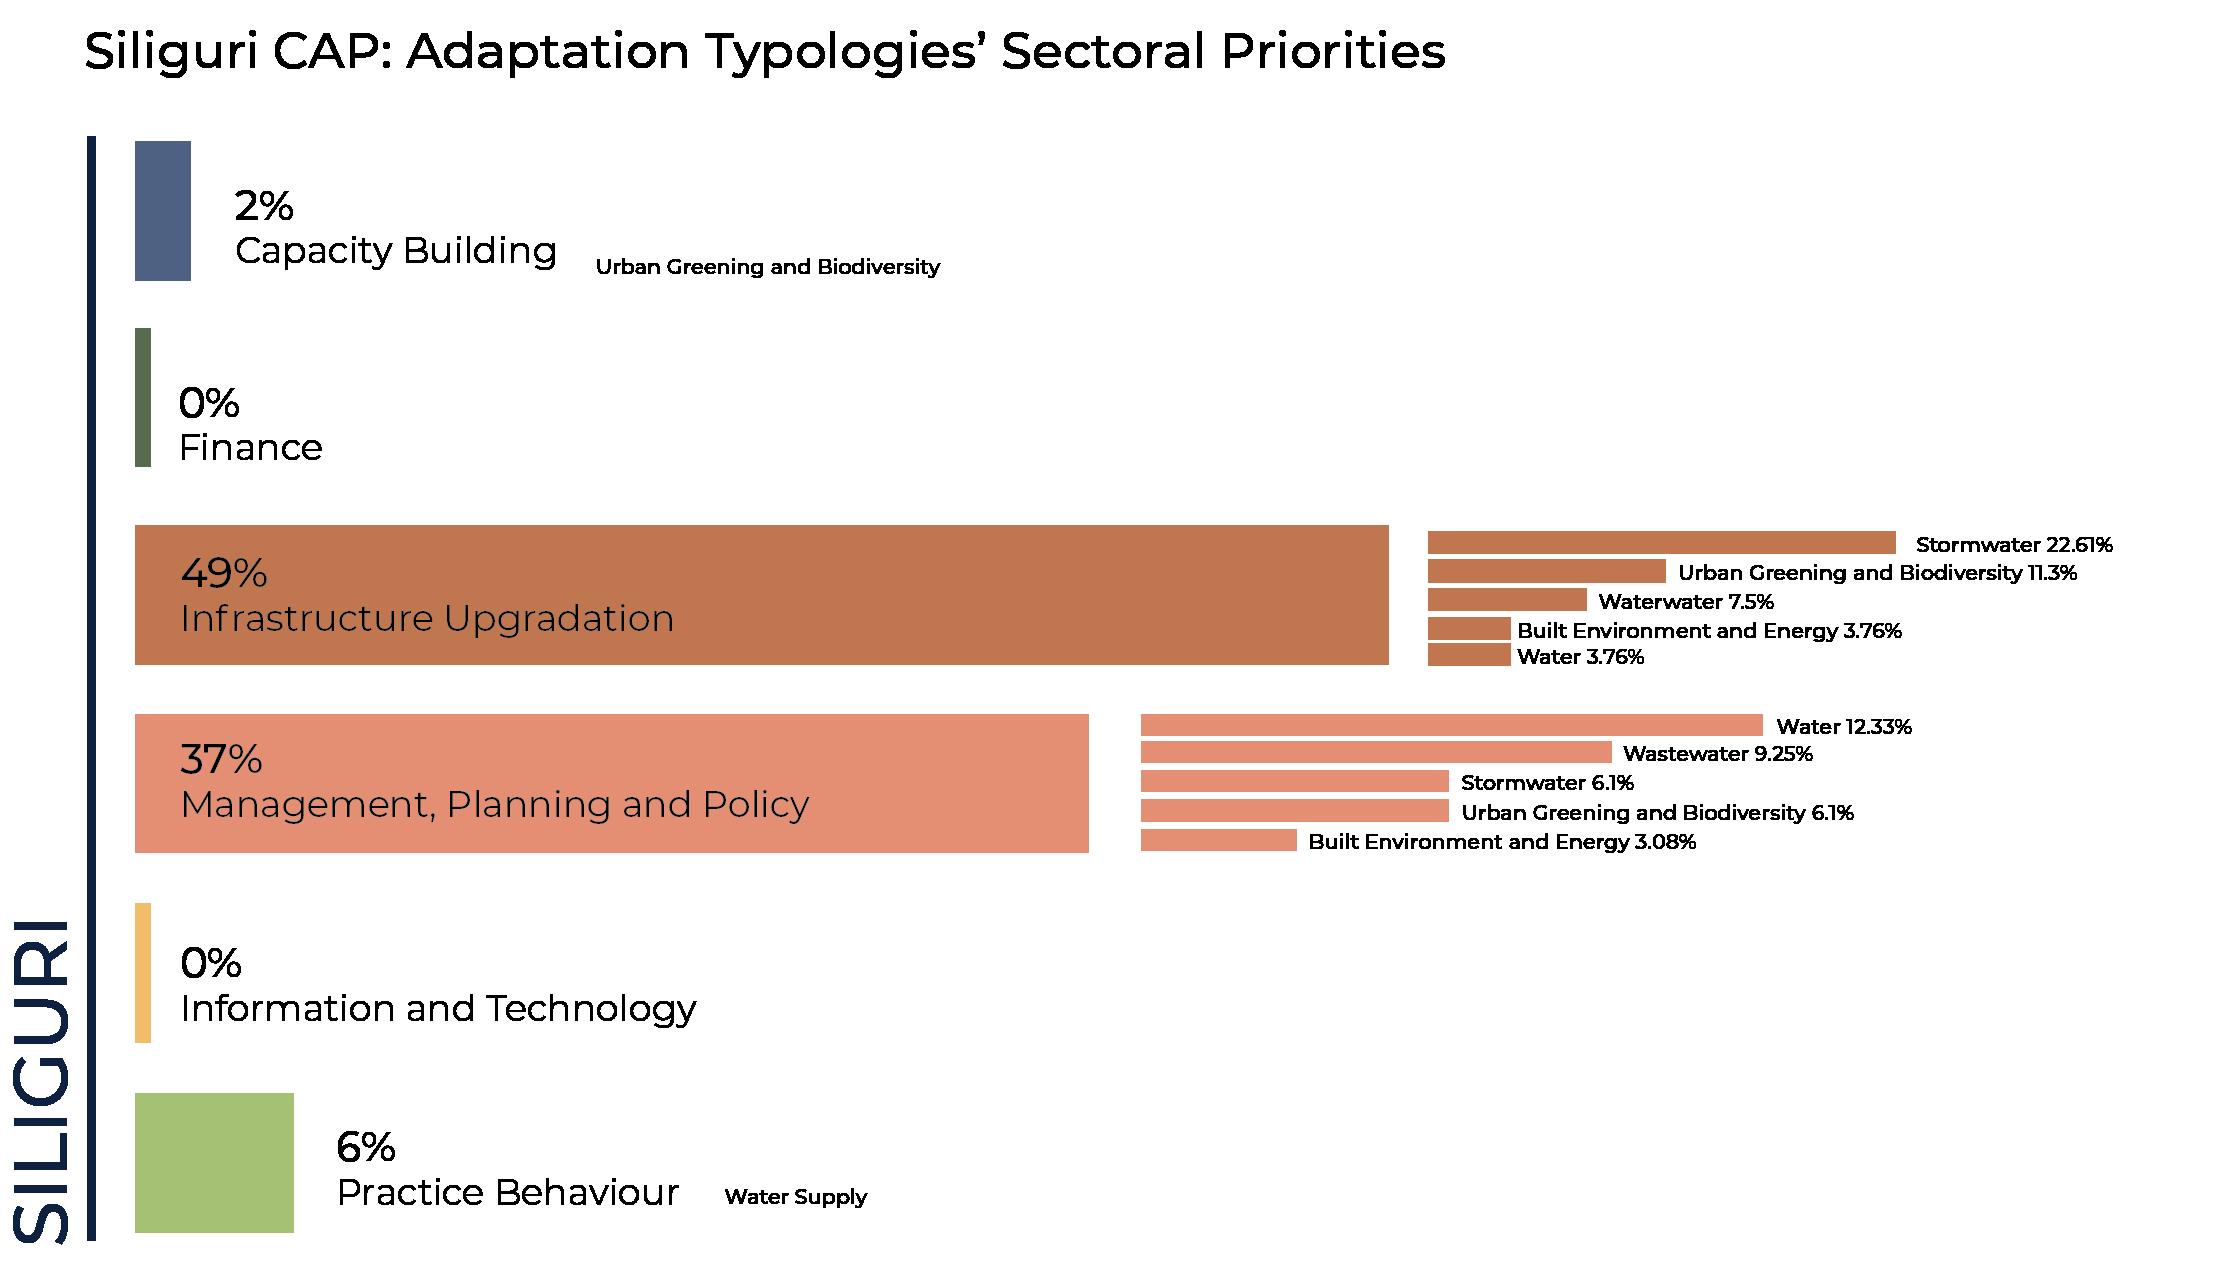
Fig 23. Distribution and sectoral priorities within Siliguri’s adaptation typologies
Table 1. Summary of Selected Cities’ Climate Action Plans
Table 2. Analyses the distribution of adaptation typologies in Indian cities’ CAPs as per Biagini et al. 2014’s Classification
Abstract
The climate policy discourse has long established mitigation and adaptation as the twin pillars of climate action. Mitigation, viewed as a long-term strategy, aims to reduce greenhouse gas emissions, although its impact is not immediate. Adaptation focuses on building resilience against climate hazards and can potentially provide immediate and affordable relief, particularly for vulnerable populations. Thus, adaptation assumes significance in the global South city especially in context of achieving climate justice. Yet, globally mitigation has dominated the climate action discourse. India is no exception.
While adaptation did receive worldwide attention around 2001- with the signing of the Marrakesh Accords under UNFCCC - mitigation, continues to dominate in national, state and more recently the city climate action plans. This research focuses on the city Climate Action Plans (CAPs) to comprehend the balance between mitigation and adaptation. It evaluates the climate the CAPs of sixteen cities as a two stage process: in the first stage, it uses the UNDP’s Adaptation Policy Framework (2005) to understand the process of preparing CAPs along four parameters - approach, stakeholder consultation and participation, coverage, and socio-economic mapping. Basis this, the research highlights a key methodological gap in planning for climate action, one that relies primarily on top-down approaches that fail to capture and respond to the nuanced reality of those who are disproportionately impacted by climate change. While there is an effort towards framing adaptation strategies these suffer from a contextually grounded approach. As a second stage, the research uses the adaptation typology framework of Biagini et al. (2014) to comprehend the nature of adaptation strategies. Consistent across the sixteen cities, the proposed adaptation strategies are predominantly confined to high-level management, policy and infrastructure. This, we argue is a result of a dominant use of the top-down approach.
The CAPs have been instrumental in foregrounding the impacts of changing climates at the city scale. In several cities, the CAPs underpin the need for dedicated institutional arrangements, notably the climate action cells. Climate action is gaining traction. Yet, the dominant top-down and centralized approach, coupled with pursuit for rational efficiency has effectively negated the on-ground complexity. Thus, the limited ability to frame the impacts of changing climates. These rely on consultations with key stakeholders as against participation of the many. Participation, especially of the most vulnerable is conspicuous by its absence. In failing to capture the needs and challenges of the climate-vulnerable, the proposed adaptation strategies fall short of planning for those worst affected by climate events. In other words, while these plans have successfully spotlighted the impacts of the changing climates, these are limited in framing and by extension steering adaptation strategies – crucial for the most vulnerable.
Most CAPs emphasize the need to account for vulnerable demographics. Infact, several cities such as Mumbai and Chennai have mapped socio-economic details emphasizing the need for decentralized (bottom-up) planning. However, these stop at emphasizing. On the contrary, most plans treat slums and vulnerable populations as homogeneous entities. Various slums exhibit distinct levels of vulnerability and employ diverse coping mechanisms. Factors such as tenure security, vulnerable demographics, challenges of access to basic services while significant, are not sufficiently accounted for in the plans.
This research advances this conversation. It advocates for a decentralized (to the sub-city scale) and integrated (with the urban development strategies, programs and projects) approach, one that is contextually grounded. It elucidates a ground-up lens that seeks to co-create adaptation strategies for the vulnerable communities and landscapes. The process is likely to be slow and perhaps messy – yet one that will deliver agency to those most impacted. As a way forward, evolving ground up and inclusive CAPs requires a complementarity of top-down and bottom-up approaches.
Once known as places for refuge against calamities and environmental hazards, cities have become hotspots for disasters and extreme climate events (Pelling, 2003), attributed to complex urban processes (European Environment Agency, 2012). Climate events such as urban flooding, heat island effect, landslides and sealevel rise, and depleting air quality (Wamsler, 2009) are acknowledged as the defining crisis. Displacement is one of its most devastating consequences impacting low-income countries disproportionately (UNFCCC, 2007). Within countries too, climate change exacerbates existing inequalities as those with fewer resources struggle to adapt and recover. The burden of illness and displacement falls disproportionately on the poor and marginalized, highlighting the inherent injustice of the crisis. In this context, foregrounding climate justice through mitigation and adaptation emerges critical, especially in rapidly urbanizing countries where legacy challenges of basic service provision are increasingly compounded by climate change.
The UNFCCC in the early 1990s recognized mitigation and adaptation as the two pillars to combat climate change. Mitigation is defined as the efforts to reduce greenhouse emissions and the amount of carbon dioxide in the atmosphere by enhancing carbon sinks. Adaptation refers to the ability of a system to adjust or cope with ecological, social or economic variations in response to actual or predicted climate stimuli and their effects (UNFCCC, 2022). While adaptation focuses on the consequences of climate events, mitigation focuses on the root cause. Premised on the argument that as mitigation efforts gain traction the need for adaptation will come down (Schipper, 2006), mitigation strategies have been the dominant focus in the climate policy agenda since the 1990s. Policymakers and the scientific community believed that adaptation would undermine governments’ resolve to control carbon emissions and overrule fossil fuel interests (Schipper and Burton, 2009). The early reports of the IPCC and UNFCCC paid scant attention to adaptation, vulnerability and equity (Schipper, 2006), inadvertently prioritizing mitigation over adaptation.
Notably, mitigation efforts are long term and are not immediately visible. The process is slow and requires major transformations in the way markets and consumers operate. Adaptation strategies, on the other hand, have near-term visibility as they provide immediate and affordable relief, especially for those who are disproportionately impacted (Schipper 2006). Hence, in developing country contexts, adaptation with its ability for immediate respite is an emerging imperative in achieving climate justice. It is this acknowledgment that led to a shift in focus in 2001 when adaptation received worldwide attention with the signing of the Marrakesh Accords under UNFCCC. Despite this shift, most plan and policy dialogues continue to treat the two approaches disjointly (Schipper and Burton, 2009), often prioritizing mitigation over adaptation.
India’s commitment to climate action is evident through multiple-scale Climate Action Plans, outlining mitigation and adaptation targets, regulatory frameworks, and investment strategies. While the national plan is focused on mitigation, the state and the city Climate Action Plans (CAPs) are required to bring in adaptation along with mitigation. These plans outline mitigation and adaptation strategies in various combinations and permutations, although, reportedly, mitigation continues to be the dominant focus (Wagh and Indorewala 2022). In a high-level research of city climate action plans, Unnikrishnan & Nagendra (2021) argue that while the poor and the vulnerable are most impacted by extreme climate events, they are rarely engaged actively. Decision-making around climate action is restricted to a few elite and community leaders with little or no representation of the urban poor in arriving at contextually derived solutions.
In this context the following questions assume significance:
Why does adaptation continue to receive step-motherly treatment; and, How can adaptation strategies (especially for poor and the marginalized) be framed to make climate planning inclusive and just?
Section 2 discusses the global, national and sub-national narratives around mitigation and adaptation to trace the drivers behind prioritizing mitigation.
Section 3 discusses the sixteen cities, focusing on frameworks used prepare the plans.
Section 4 evaluates the CAPs of sixteen cities through a two-step process. In focusing on both the methods and processes deployed in preparing the CAPs this Section highlights the overt reliance on a top-down and centralized processes that do not go deep enough to engage with those who are disproportionately impacted. In turn, the vulnerability assessments are not nuanced enough to arrive at contextual adaptation strategies. While all plans acknowledge the need for consultation and participation, in-effect, the processes hinge on the former as against the latter. Consequently, the mitigation-led goal of carbon neutrality emerges as a priority in all the CAPs. In not focusing on inclusive adaptation planning, the CAPS fall short on outlining adaptation for the vulnerable populations.
Section 5 draws upon the authors’ action research across Indian cities to argues for a decentralized and a distributed process of CAP preparation.
The report concludes in Section 6, which argues for collaborations in co-producing plans that pivot on a combination of top-down and bottom-up processes that are both consultative and participative.
2. Mitigation Over Adaptation – A Frequent Choice
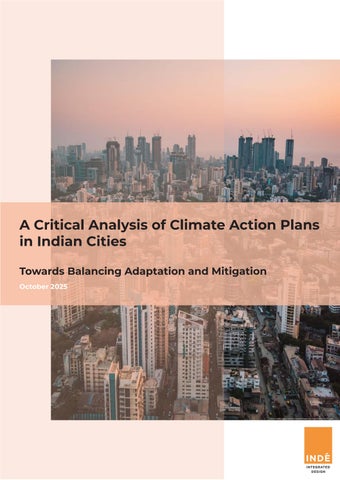
Changing climates and attendant manifestations assumed priority during the first World Climate Conference held in Geneva in 1979. Significant progress was made with the inaugural report of the Intergovernmental Panel on Climate Change (IPCC) in 1990, emphasizing international cooperation to address climate change. The formation of the United Nations Framework Convention on Climate Change (UNFCCC) in 1992 led to an emphasis on reducing global emissions of carbon dioxide and the need to stabilize Greenhouse Gas Emissions 1. Mitigation commitments and the corresponding institutional and financial mechanisms, underpinned by an early understanding of climate science (Huq and Reid, n.d.) emerged as the most important pillar of the UNFCCC framework. This understanding primarily posited that climate change would manifest gradually over the medium to long term, with the policy priority centred on emission reduction (Rogers and Agrawal, n.d.).
The Kyoto Protocol (1997) placed the responsibility for reducing carbon emissions on developed countries, while aiming to assist developing nations in adapting to the adverse effects of climate change. Ever since the annual meetings - Conference of Parties (COP) – witness signatory countries (currently 197) have come together to review the progress and implementation of the Kyoto Protocol and set targets for mitigating greenhouse emissions. Significantly, in 2015, The Paris Agreement, signed by 196 countries, acknowledged the imperative of limiting global temperature rise to below 1.5 degrees Celsius. Towards this goal, countries were required to submit their Nationally Determined Contributions (NDCs) to the UNFCCC, outlining their mitigation and adaptation goals 2
Historically, the UNFCCC has compartmentalized mitigation and adaptation (Watkiss, Benzie, and Klein, 2015). As against viewing these as mutually reinforcing strategies to address climate change, these were seen as substitutes (Klein et al., 2007). Mitigation is conceptualized as a ‘public good’ (Watkiss, Benzie, and Klein, 2015, pp 548), wherein the benefits are shared globally, and the costs are borne at the national level. Consequently, the success of mitigation actions relies heavily on international cooperation. Hence, since its inception, the UNFCCC framework’s mitigation focus has been propelled by global agreements and national policies. In contrast, adaptation measures are typically localized, immediate and short-term. Despite the IPCC as well as the UNFCCC emphasizing adaptation as a powerful option for responding to climate change while advocating for its role as a complement to mitigation efforts (IPCC, 1996b, pp 187), there has been little integration into formal climate policy (Pielke, 1998).
There are several reasons for this reduced focus on adaptation. To begin with, the uncertainty associated with the impacts of climate change on different people in different geographies makes it difficult to plan adaptation responses (Watkiss, Benzie and Klein 2015; Pielke, 1998). Burton (1994) emphasized a prevailing perception that discussions on adaptation were considered a trade-off for mitigation activities and possibly deemed anti-environmental. The UNFCCC (1996) noted a scarcity of studies quantifying the costs of adaptation compared to those addressing the costs of greenhouse gas mitigation. The difficulty lies in accurately assessing adaptation costs when the impacts are regional and highly uncertain. This challenge is further compounded by the absence of a common physical metric for evaluating the progress of adaptation. In contrast, mitigation benefits from a global metric of evaluation – that of greenhouse gas
1 The term Greenhouse effect was coined by the Swedish scientist Svante Arrhenius, marking the beginning of scientific literature emphasizing the potential impacts of anthropogenic carbon dioxide emissions (Morgenstern, 1991).
2 The Paris Agreement works on a five- year cycle of increasingly ambitious climate action carried out by countries. Every five years, each country is expected to submit an updated national climate action plan - known as Nationally Determined Contribution, or NDC. In their NDCs, countries communicate actions they will take to reduce their greenhouse gas emissions in order to reach the goals of the Paris Agreement. Countries also communicate in the NDCs actions they will take to build resilience to adapt to the impacts of rising temperatures (https://www.un.org/en/ climatechange/paris-agreement).
(GHG) emissions. This facilitates the scientific definition of policy goals and allows for quantitative analysis of progress, spanning from the global to national level (Watkiss, Benzie, and Klein, 2015). Thus, the difficulty of incorporating adaptation into international negotiations and by extension its neglect at the global level (Pielke, 1998), percolating to the national levels.
Despite this larger focus on mitigation, the IPCC’s Third Assessment Report (TAR), 2001 highlighted the increasing emissions and the resultant impacts. The report emphasized the imperative of adopting adaptation responses in conjunction with mitigation measures. It emphasized anticipatory/proactive adaptation as against reactive adaptation. While the former involves measures before the observable impacts of climate change, the latter responds to the impacts after they become evident (Robledo, Kanninen, and Pedroni 2005). In a hypothetical scenario even if the GHG emissions are completely halted, the report argued that there exists a state of inertia affecting both natural and human systems – the socio-ecological and socio-economic systems. It is in this context that anticipatory adaptation becomes particularly crucial, recognizing that decisions related to adaptation will require time for acceptance and comprehensive implementation. Ever since the UNFCCC negotiations have been relatively more attentive to adaptation. The Marrakesh Accords played a pivotal role by allocating “Marrakesh” funds at COP 7 to assist poorer developing countries in dealing with adaptation (UNFCCC, 2001).
As the focus on adaptation gained momentum, in 2010, at the 16th COP of the UNFCCC the preparation of National Adaptation Plans (NAPs) in least developed and developing countries was mooted. As of 2023, 70 countries, many of which fall under the developing country list, including Brazil, Nepal, Bangladesh, Sri Lanka, Costa Rica and Kenya have NAPs, successfully integrating adaptation planning into their development agendas, thus moving away from the notion of reactive adaptation. The NAPs of Sri Lanka, Bangladesh and Brazil serve as an illustrative example of this shift. They adopt a comprehensive climate risk management strategy across various thematic areas, including agriculture, biodiversity and ecosystems, vulnerable populations, water resources, health, and infrastructure. Each thematic area involves an assessment of the current scenario and incorporates planning and policy tools to address associated risks. A distinguishing factor about Brazil’s plan is the effort to leverage indigenous knowledge of populations living in environmentally sensitive ecosystems like the Amazon rainforest. The Traditional Knowledge Initiative (TKI) plans to integrate the knowledge into regional and national scientific models. This integration serves to enhance the effectiveness of adaptation actions, ensuring that they are informed by community-level insights and contribute to the resilience of vulnerable populations (NAP Brazil 2016). Similarly, Bangladesh’s NAP focuses on coastal erosion and flooding by proposing various community awareness programs and provision of climate resilience funds to farmers and fishermen to recover losses and damages.
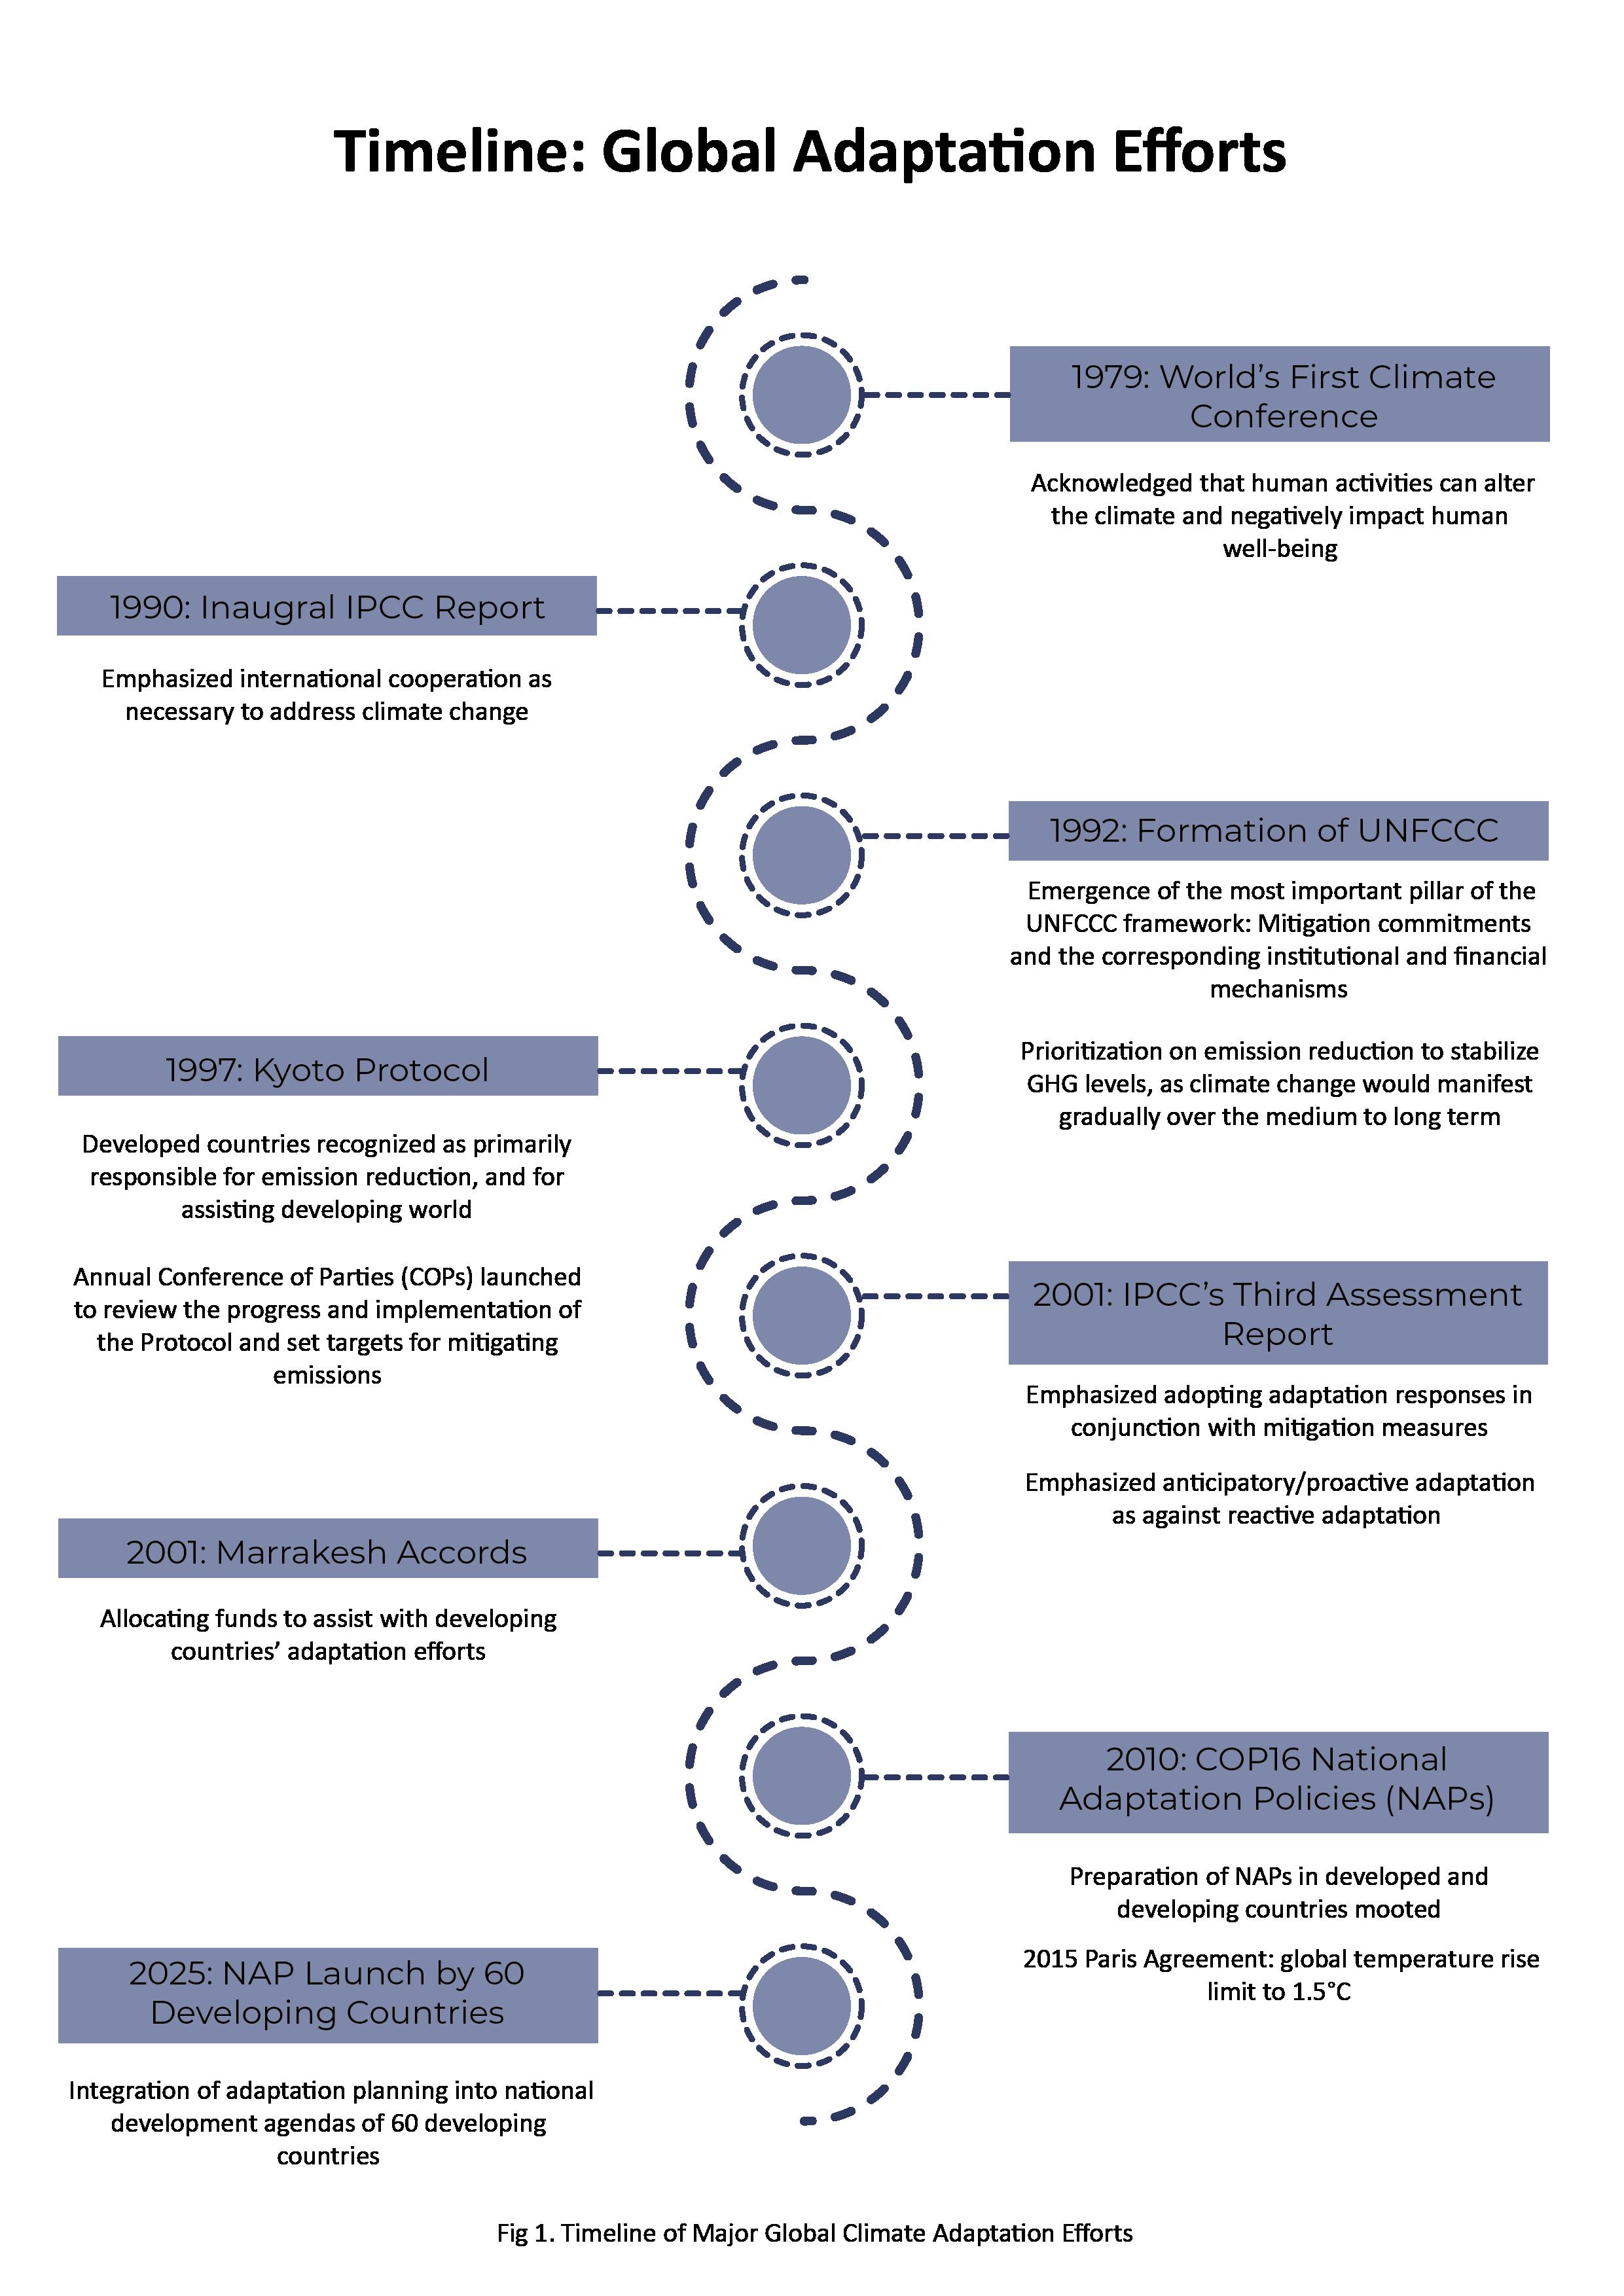
India demonstrated its alignment with international climate goals through its National Action Plan for Climate Change, 2008. While the National Plan focused on the mitigation approach of carbon emission reduction, an immediate (2009-10) directive to prepare State (provincial) Action Plans for Climate Change (SAPCCs) called for a focus on adaptation to address the state-specific climate issues. This followed the Delhi Ministerial Declaration at COP 8 (UNFCCC 2002, pp 2-The Delhi Ministerial Declaration on Climate Change and Sustainable Development) which recognized adaptation and mitigation both as “overriding priorities in developing countries.” A review of the SAPCCs shows that several states (notably Maharashtra and Karnataka concentrate their adaptation strategies on key sectors such as agriculture, water, livestock management, and forestry. The Tamil Nadu SAPCC specifically addresses vulnerabilities of communities such as the pastoralists and honey trappers, by planning strategies tailored to their unique challenges. However, the SAPCCs are criticized for lack of political will to materialize action, a concern exacerbated by dormant steering committees and institutional mechanisms once formed under pressure from the central government (Gogoi, 2017). States are dependent on the national government for funds to implement climate action. The National Adaptation Fund for Climate Change, established in 2015 to finance highpriority projects in states and union territories, has faced a continuous decline in funding. Starting at 118 crores in 2015-16, the fund has dwindled to 20 crores in 2022-23. Furthermore, there is an inconsistency in budgeting for the costs of adaptation among different states, attributed primarily to the variations in methods employed for vulnerability assessments which springs from the lack of a proper guiding framework provided by the UNFCCC (Dhanapal 2014). These methodological discrepancies potentially contribute to the observed tendency of prioritizing mitigation over adaptation. National budget outlays, allocating 35,000 crores for energy transitions under the Ministry of Petroleum and Natural Gas and 19,000 crores for the launch of the Green Hydrogen Mission evidence the former (Maharana 2023).
Despite policy and budgetary focus, India continues to endorse fossil fuel policies (the UN Production Gap Report, 2023). India has experienced a 4% increase in its greenhouse gas (GHG) emissions from 2016 to 2019, as indicated in the Third National Communication and Initial Adaptation Report, 2023. The Fourth National Communication from 2024 reveals that GHG emissions have reduced by 8% since 2019, although this is falling short on the agreed emission-reduction rate. The Nationally Determined Contributions (NDC) submitted to the UNFCCC in 2022, concentrate on three mitigation targets: a) A 45% reduction in the emission intensity of GHGs by 2030 as against the 33-35% range outlined in the NDC of 2015 3 ; b) Achieving 50% cumulative electric power installed capacity from non-fossil fuel-based energy resources by 2030, up from the 40% target set in the 2015 NDC; and, c) Creating an additional carbon sink of 2.5 billion tons of CO2, through forest and tree cover. Notably, the NDCs encompass a single goal related to building adaptive capacities but lack specific targets within this domain. While achieving net-zero targets is argued to be elusive (Raj 2023, Mcgrath 2021, Nugent 2021), the emerging imperative for tangible and proactive adaptation measures cannot be emphasized more.
Cities of the 21st century, largely in developing countries given their elevated vulnerabilities, necessitate a substantial share of the global climate change costs (Mertz et. al 2009). In India, city-scale Climate Action Plans (CAPs) have been gaining momentum with Mumbai as the first city to publish its CAP in 2022 (Bhalla, 2022), followed by Bhopal, Ahmedabad, Chennai and Bangalore amongst others. The national government prioritized city climate action planning only in 2019 with the launch of the Climate Smart Cities Assessment Framework (CSCAF). However, since 2009, as part of transnational municipal networks (TMNs) such as the C40 Cities Alliance (2005), the European Covenant of Mayors (2007) and ICLEI (2008) amongst others, cities had begun to pursue climate agendas. We analyze sixteen CAPS using three frameworks –CSCAF, The C40; and ICLEI framework.
The CSCAF framework outlines 28 indicators across five sectors namely —(a) energy & green buildings, (b) urban planning, (c) green cover & biodiversity, (d) mobility and air quality, (e) water resource management and waste management. Cities using this framework are required to assess the climate smartness across each of these sectors through a differential weightage system: energy and buildings and urban planning receiving the highest at 25% each; mobility and air quality is 20%; and waste management and water management are accorded 15% each. Performance indicators within each sector are evaluated on a scale of 100, reflecting the city’s accomplishments. For instance, in Bhopal, the Waste Management sector attained a noteworthy score of 567 points, indicating a relatively high performance 4. The assessment enables cities to identify and prioritize sectors with lower performance and by extension devising targeted interventions to enhance climate resilience.
The C40 Cities climate planning framework advocates for the engagement of communities to inform the planning process and equitable distribution of benefits. It advocates a five-step process: (a) establish context; (b) gather stakeholders and team resources; (c) identify, analyze and evaluate risks (d) create risks and vulnerability maps; e) deriving from the analysis, propose and prioritize contextual mitigation and adaptation strategies and an implementation plan.
The ICLEI CAPs follow a nine-step process that includes identifying stakeholder groups, creating a baseline (GHG inventory, fragile urban systems), local monitoring and evaluation of CAP implementations. The fragile sectors focus on a combination of the (a) water supply system, (b) wastewater management system, (c) storm-water management, (d) solid waste management, (e) transportation, (f) urban green spaces and biodiversity and (g) air quality/health. In these CAPs, there is a general trend to lay greater emphasis on adaptation measures relative to the C40 and CSCAF methodologies.
All three frameworks have formulated a Climate Action Plan Training Manual that outlines processes for the assessment and implementation of adaptation and mitigation actions. However, these are guiding documents; city officials and their partner agencies are free to decide on their approach and methodology for preparing the CAPs 5. Notably, neither framework specifies the scale for vulnerability mapping, nor do they mention the participation and/or representation of vulnerable communities in assessment and decision-making. Finally, the frameworks do not mention the split between adaptation and mitigation actions. Irrespective of the framework cities adopt, they are expected to report to the National Mission for Sustainable Habitat – NMSH 2.0, a revised version of the 2009 one launched as part of the National Action Plan on Climate Change (NAPCC). Through this reporting, the NMSH 2.0 aims to synchronize its national and sub-national initiatives and policies.
4 For instance, the aggregate score of 567 is derived from various performance indicators such as waste minimization initiatives, the extent of dry waste recovered and recycled, construction and demolition waste management, and remediation and landfill operations.
5 The municipal government of each city is the custodian of the Climate Action Plans. In thirteen of the sixteen cities, the preparation is entrusted to an NGO organization. In three out of four cities (Mumbai, Bhopal, Bangalore) drafting of the CAP was outsourced to the World Resource Institute (WRI). Bhopal developed its CAP with the collaboration of State Knowledge Management Centre on Climate Change, EPCO and WRI, India. Chennai’s CAP was prepared by the Urban Management Centre. Meanwhile, ICLEI South Asia led the CAPs of Tiruchirappalli, Tirunelveli, Coimbatore, Ahmedabad, Rajkot, Siliguri, Udaipur, Kakinada and Vijayawada. Leh, Jamnagar and Junagadh more fell under the directive of the National Institute of Urban Affairs, a government body.
2.2 Methodology
The research employs a mixed methods approach to review a broad spectrum of data - policy documents, scholarly articles and the sixteen selected. Along with the literature review, stakeholders from the C40 Cities alliance and World Resource Institute and the CSCAF were interviewed. The sixteen CAPs are evaluated through a two-stage process: the first uses the UNDP’s Adaptation Policy Framework (APF, Burton et al., 2005) and its four criteria - approach, stakeholder engagement, coverage, and mapping socio-economic conditions. The second evaluates the CAPs using the adaptation typology framework of Biagini et al. (2014).
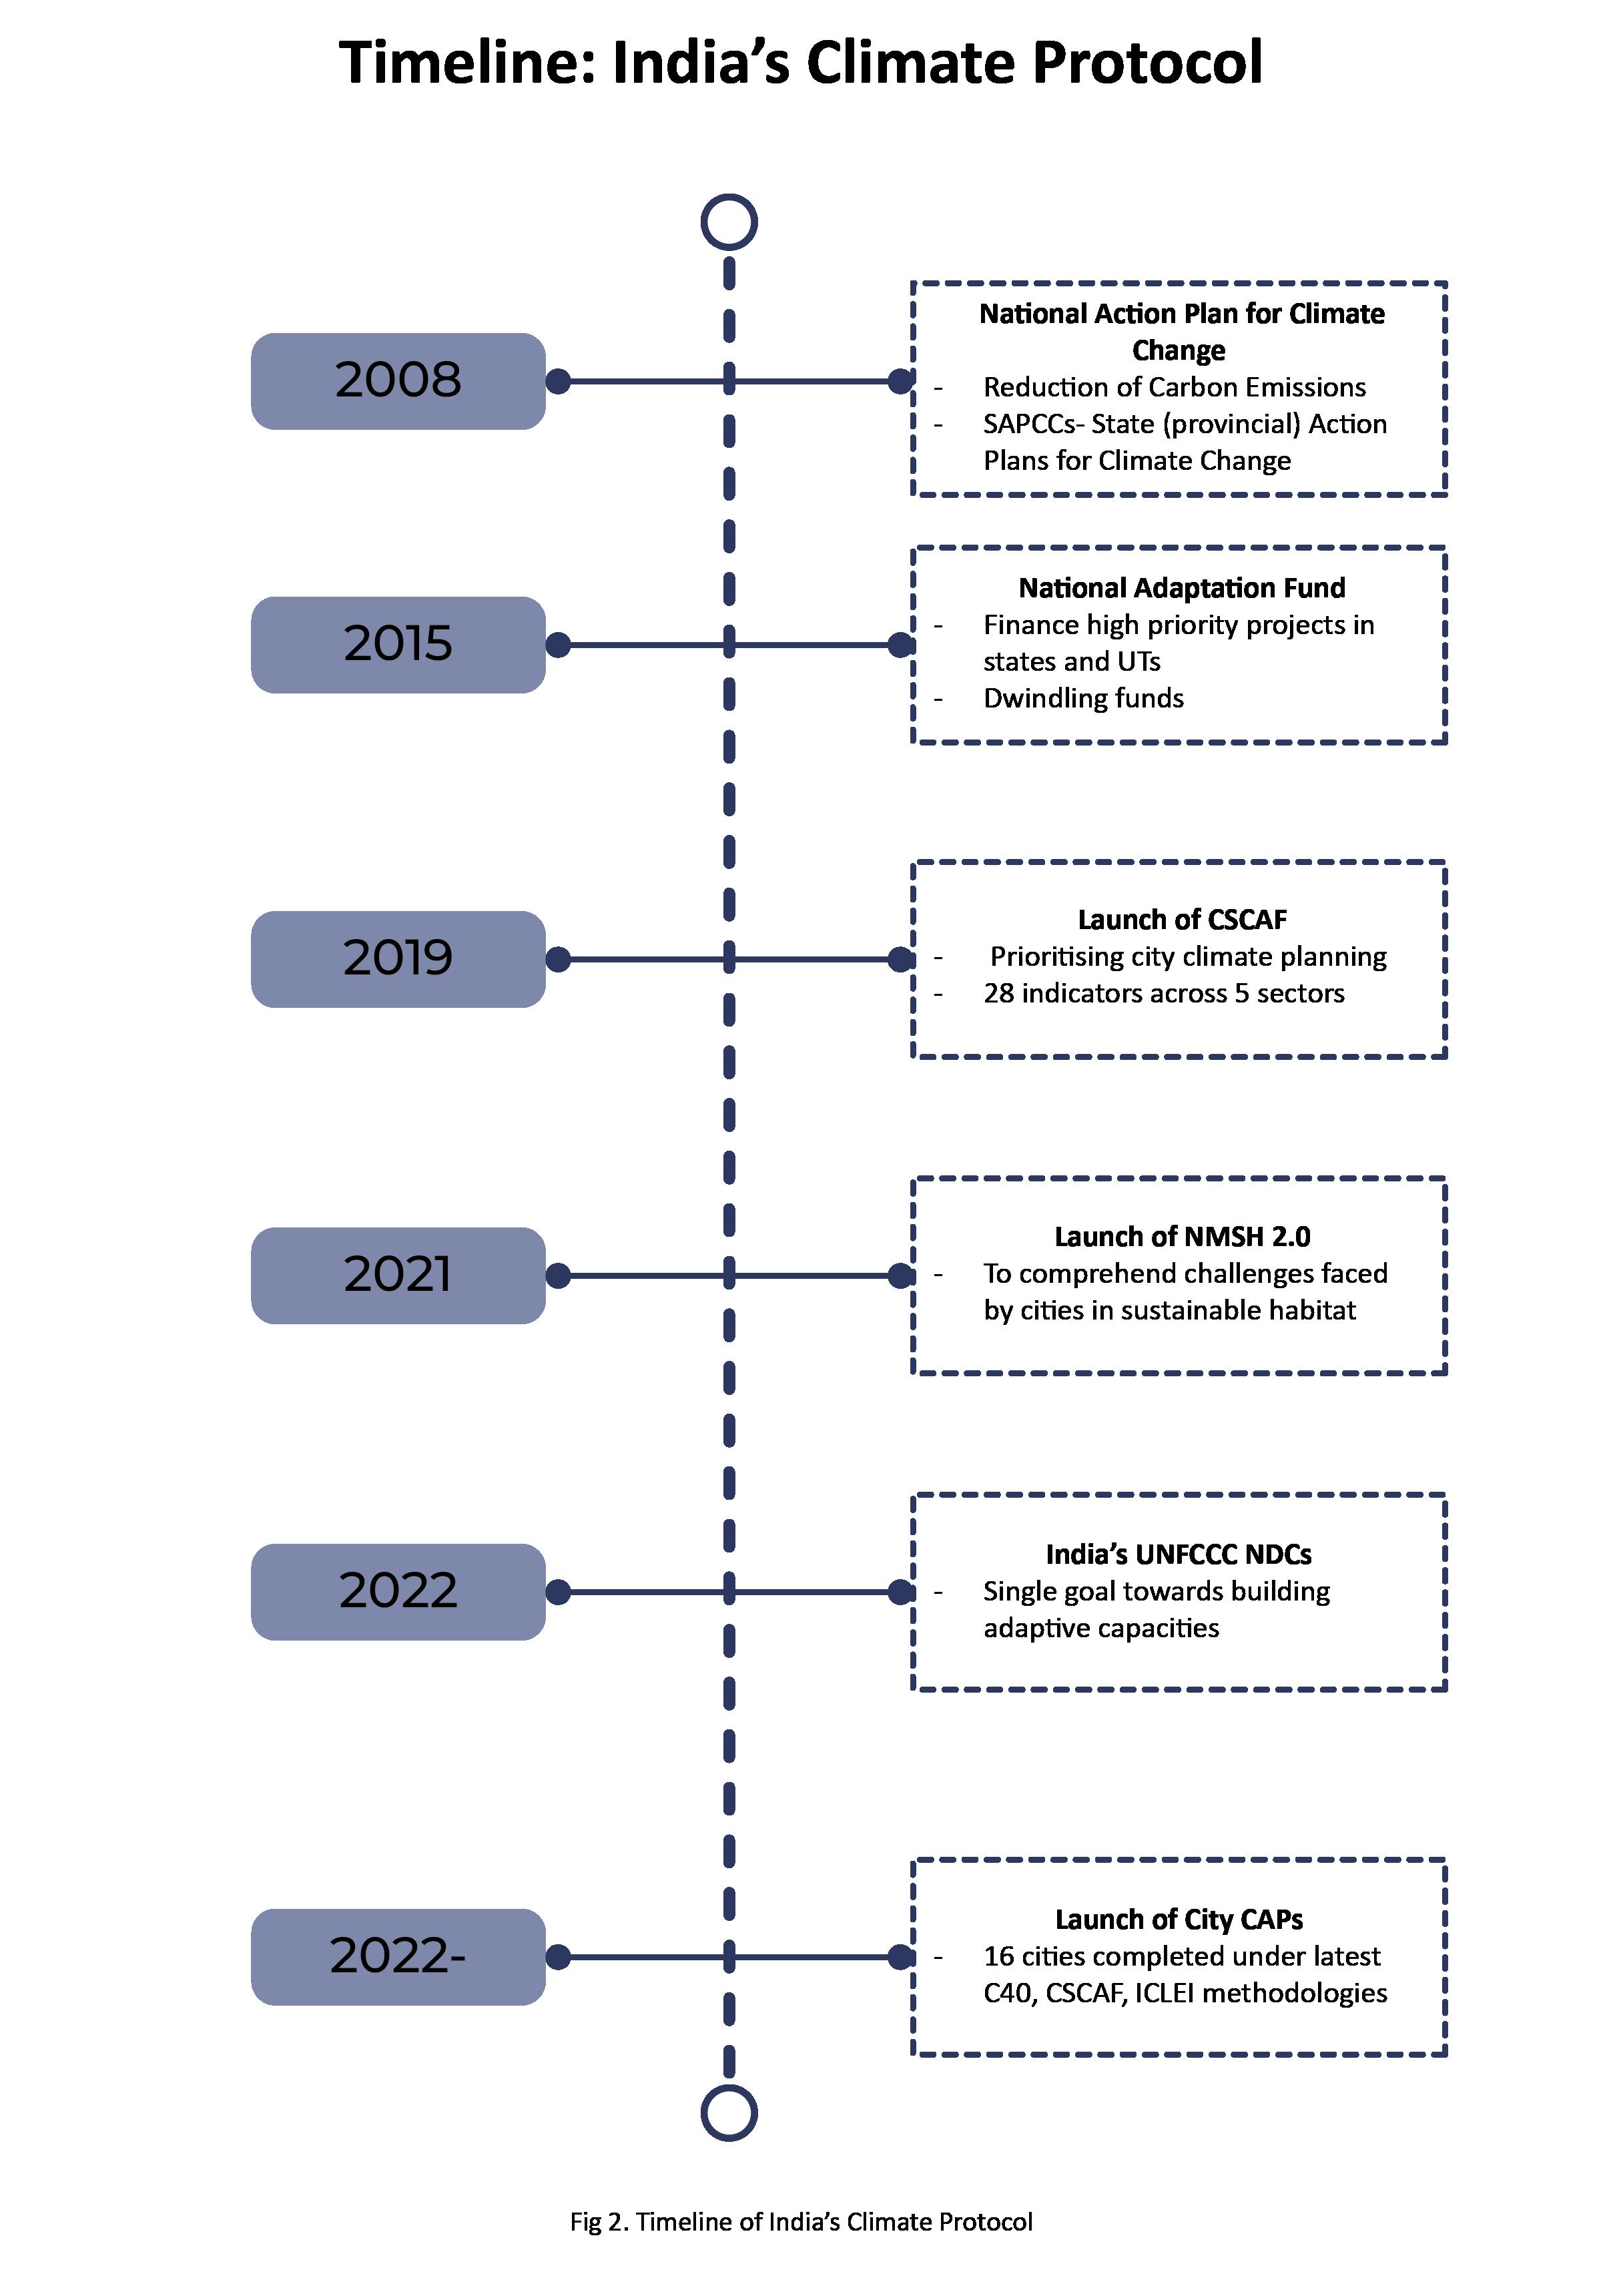
The APF as the primary evaluation framework was selected for two reasons: First, it is developed specifically for developing countries and cities. Second, it provides a lens where existing vulnerabilities and adaptation policies are combined rather than viewed in singularity. To facilitate this integration, the framework advocates principles of bottom-up approaches (Burton et al., 2005) at the city and sub-city level. However, it does not provide a framework to evaluate the typology of adaptation strategies planned in the CAPs. To further understand adaptation typologies, we turn to Biagini et al. (2014). For ease of comprehension, we collapse the ten typologies into six categories– (a) Capacity Building, (b) Finance, (c) Infrastructure Upgradation, (d) Management, Planning and Policy, (e) Information and Technology, and (f) Practice and Behavior.
3. Cities and the City Climate Action Plans (CAPs)
The CAPs of Bhopal, Leh, Jamnagar and Junagadh (CSCAF framework), Mumbai, Chennai and Bangalore (The C40 framework) and Ahmedabad, Coimbatore, Rajkot, Ahmedabad, Udaipur, Tirunelveli, Tiruchirappalli, Kakinada, Vijayawada and Siliguri (the ICLEI framework) are selected for this research. Each CAP commences with a comprehensive city profile, outlining the demography, physical attributes, and socio-economic conditions prevalent in the city. This profiling extends to distinct climate characteristics of each city, inclusive of an evaluation of climate risks and vulnerabilities, coupled with the development of a Greenhouse Gas Emission inventory.
The preparatory phase leans on consultation workshops involving various departments, experts, and the NGOs and CSOs. Emerging from these consultations, the CAPs strategically prioritize six key sectors, defining associated goals, and subsequently delineating mitigation and adaptation strategies aligned with the established objectives (Refer to Table 1 below). Broadly, the identified sectors common across all CAPs are energy and green building, transportation/sustainable mobility, water resource management, and waste management. Within these sectors, a detailed list of actions is outlined, delineating the city’s course of action.
Fig 4. Location within India of the 16 cities
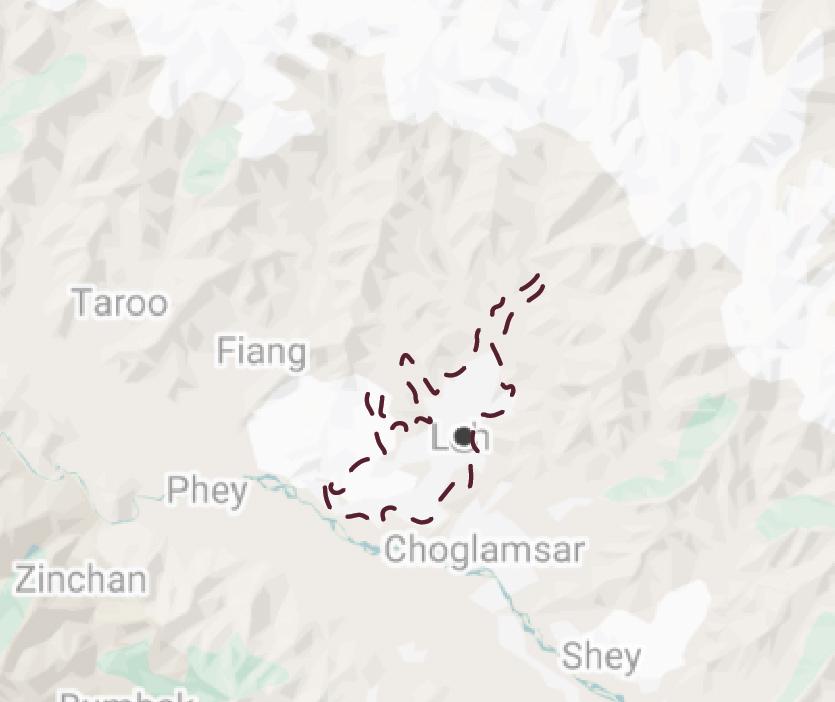
Leh
Karakoram and Great Himalayan Mountain ranges with the Shayok, Indus and Zanskar rivers
Population: 30,870
Population Density: 4 persons/sqkm
• 3000m above sea-level
• Urban flooding from intensified rainfall and water scarcity due to an over-reliance on ground-water extraction.
• Climate vulnerable in the country: Increase in temperatures by 8–10-degrees Celsius during the summers, and 5–10-degrees Celsius for winter by 2050.
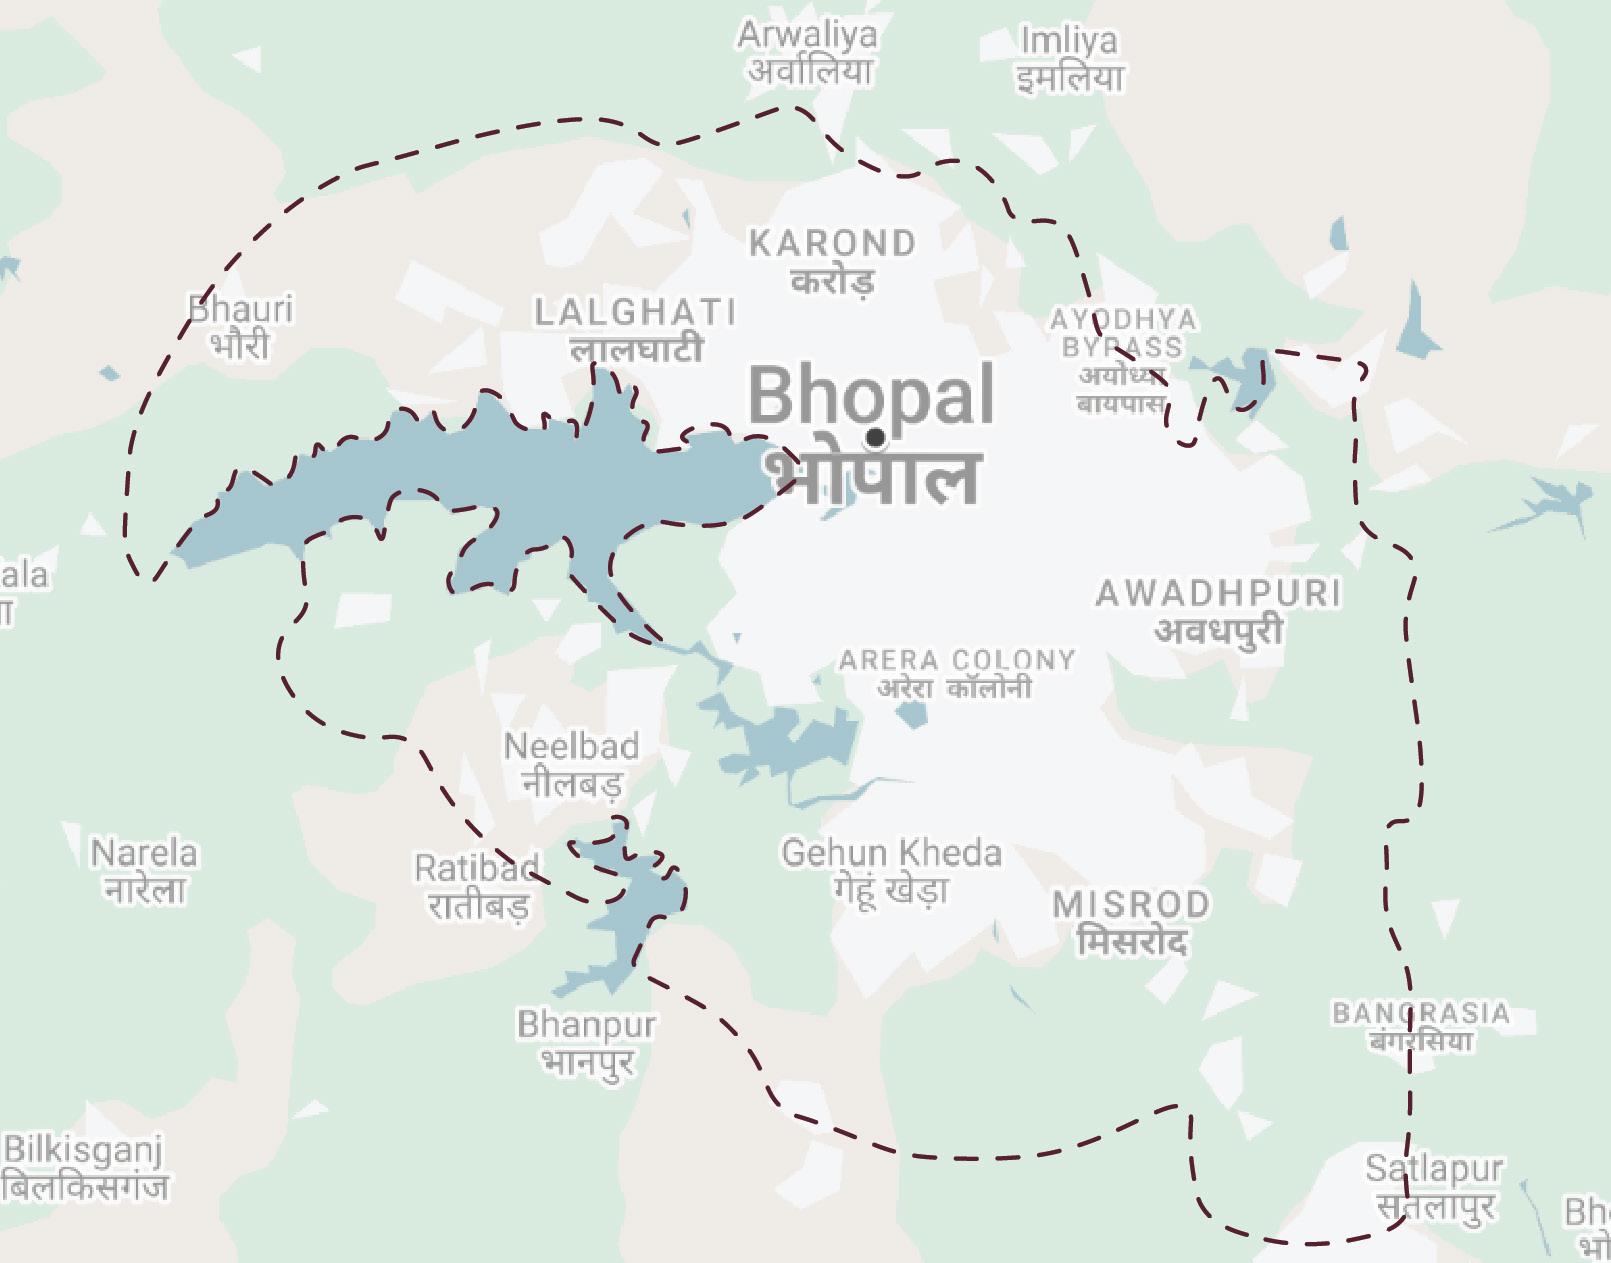
Bhopal
Vindhya and Malwa plateau region, bounded by the Narmada valley in the central-east, Bhoj wetland towards the southeast and Berasia shrub forests in the west
Population: 1,798,218
Population Density: 855 persons/sqkm
• City of lakes
• Rising mean temperatures and shifts in rainfall patterns
• Highest temperature of the season at 43.9 degrees Celsius
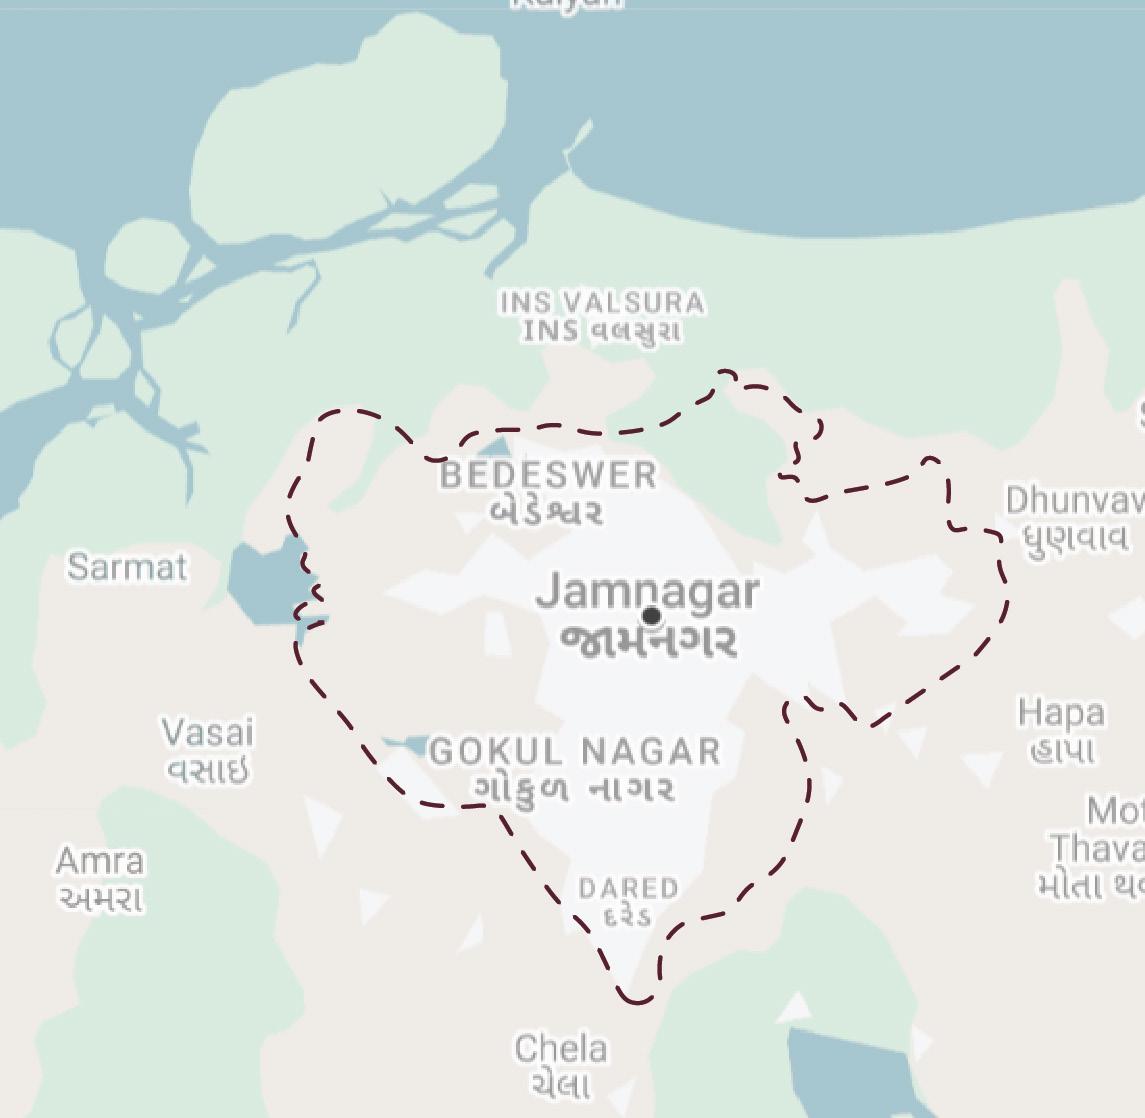
Jamnagar
Eastern India is a coastal city of Gujarat’s Saurashtra region facing the Arabian Sea to the West
Population: 602,000
Population Density: 238 persons/sqkm
• Hill ranges, sand dunes, islands, and mangrove forests, with the Barda Hills reaching elevations up to over 617 metres
• Semi-arid climate, erratic rainfall and high evaporation rates.
• Climate risks are urban floods and storm surges, emerging from its low-elevation and unpredictable rains
• Increased salinity ingress from the ocean and has seen frequent flooding of low-lying areas such as slums.
Junagadh
Western Gujarat between the Arabian Sea and forested areas. The city is traversed by rivers such as the Sonrakh and Kalwo, along with several lakes including Narsinh Mehta Sarovar and Damodar Kund
Population: 2,743,082
Population Density: 5588 persons/sqkm
• Green cover- 22.3% in 2011 to 15.1% of the city area by 2021
• Tropical dry and wet climate
• Climate risk: Flooding with devastating floods in 2023 due to sudden, intense rainfall
C40 City Profiles
Bengaluru
Heart of the Mysore plateau , Southern state of Karnataka
Population: 9.6 million
Population Density: 12,000 persons/sqkm
• Altitude of 900m
• Temperate climatic zone, with high humidity and low temperatures
• Distinctive ecological feature—its intricate network of lakes and Rajakaluves (drainage channels)—which historically served as rainwater harvesting structures.
• Dual challenges of water scarcity and heightened flooding events.
Mumbai
Coastal city in the Western Ghats of India
Population: 12.44 million
Population Density: 28,426 persons/sqkm
• Connected seven islands- low-lying floodable areas
• Moderately warm and highly humid climatic zone, with heavy southwest monsoons
• Climate hazards like heat island effects, coastal flooding and air pollution according to the hazard assessment in the MCAP
Chennai
Coastal City in the Eastern Ghats of India
Population: 4.6 million
Population Density: 26,902 persons/sqkm
• As a coastal city, this area encounters intense northeast monsoons
• Water scarcity since 2019 importing 10 million litres of water every day
• City experiences periodic cyclones and tidal flooding due to its geographic location on the southeast coast of India
ICLEI City Profiles
Siliguri
Across the floodplains of the Mahananda River, at the foothills of the Himalayas
Population: 0.5 million
Population Density: 12,264 persons/sqkm
• Serves as the link between mainland India and North-east India
• Significant increase in land-surface temperatures in past decades, due to urbanization at the cost of reducing vegetation and water bodies
• Climate challenge: Air pollution and in the summer of 2024, the city faced an acute drinking water crisis due to high levels of pollution in the Mahananda River
Ahmedabad
West India, is located on the banks of the River Sabarmati
Population: 5,577,940
Population Density: 11,950 persons/sqkm
• Major Economic Hub of Gujarat
• Semi-arid climate with hot summers and mild winters
• Limited rain- 800mm annually
• Rapid urbanization- Extreme heat, water scarcity, and more extreme weather conditions.
• One of India’s hottest cities with temperatures regularly above 40-degrees Celsius, and it was the first city in South Asia to launch a Heat Action Plan in 2013
Coimbatore
Adjacent to the River Noyyal and surrounded by the Western Ghats, known to be a major cotton producing and manufacturing city
Population: 1 million
Population Density: 1875-56,180 persons/ sqkm
• 650mm of rainfall annually
• Hot and humid climate
• Climatic challenges such as the urban heat island effect and air pollution has risen due to a rise in vehicles and loss of green cover, with flood alerts have been increasingly common due to erratic, heavy rainfall
Udaipur
Historical city located in Rajasthan (West India) located on the southern slopes of the Aravalli Range
Population: 0.5 million
Population Density: 7048 persons/sqkm
• City of lakes
• Haphazard urbanization- high levels of temperature fluctuation across the year from 16-degrees Celsius in Winter to 45-degrees Celsius in Summer, strained the blue-green spaces, risks of flash floods
• In May of 2025, a five-day heatwave took place with exceptionally high temperatures over 45-degrees Celsius as well as strong, dusty winds during the same period
Rajkot
The rivers of Aji and Nyari run through the city –facing issues such as extreme heat, drying up of rivers and air pollution.
Population: 2 million
Population Density: 12,289 persons/sqkm
• 22nd fastest growing city between 2006-2020
• Fourth largest city in Gujarat, a commercial and industrial hub
• Semi-arid climate
• In April of 2025, the city experienced scorching heat of 46.2-degrees Celsius and is regularly among the hottest cities in Gujarat
Tirunelveli
Banks of the Thamirabarani River
Population: 473,637 million
Population Density: 4359 persons/sqkm
• Nestled in the foothills of the Western Ghatstypical climate with 968mm of rain annually
• Water-related infrastructure is inadequate, water scarcity and flooding/inundation is increasing, expecting a 15% rise in annual rainfall by 2050, while over 60% of the population is vulnerable to urban heat risks
• 32% increase in urban built-up areas between 20072017-with the risk of urban-heat island effect
Kakinada
Coastal city adjacent to the Bay of Bengal besides the Godavari River flowing through the Eastern Ghats
Population: 312,538 million
Population Density: 19,314 persons/sqkm
• Known for products such as fertilizers and technology
• Tropical climate with hot and humid weather
• Kakinada has historically been a port city and has rapidly industrialized at the outskirts
Tiruchirapalli
Besides the Cauvery River in Tamil Nadu
Population: 847,387
Population Density: 5474 persons/sqkm
• In 2024- Its hottest day since 1896 in May as well as hottest and driest September in 10 years
• Extremely hot summers over 42-degrees Celsius, while winter months are more moderate
• The population is expected to double by 2070, with climate challenges of poor groundwater supply, vulnerability to floods and clones and inadequate waste management at the forefront
Vijaywada
Located at the banks of the Krisha River in the Eastern Ghats
Population: 1 million
Population Density: 9,782 persons/sqkm
• Known to be the agricultural and commercial capital of Andhra Pradesh
• Experiences tropical climates similar to Kakinada, with hot summers and moderate winters
• One of the most climate-vulnerable states in India, highly prone to events such as floods, droughts and cyclones
4. Evaluating the CAPs
4.1 Stage One Applying UNDP’s Adaptation Policy Framework (APF)
The APF is developed specifically for the global South, providing a lens where existing vulnerabilities and adaptation policies are combined rather than viewed in singularity. The framework suggests four criteria:
Approach
The guidelines for climate impact and adaptation assessment commonly employ two distinct approaches: the hazards-based approach and the vulnerability-based approach (UNDP, 2004). The primary focus of the former is on the events and effects of climate change. Assessments commence with climate change projections derived from models, with limited consideration of non-climatic factors. The latter, in contrast, projects climate change events in the context of existing climate risks, with particular emphasis on social factors that influence the capacity to deal with climatic hazards. This approach draws upon past experiences in managing climate risks while involving stakeholders from the beginning to connect adaptation to climate change with those impacted.
Vulnerability-based assessments can yield valuable outcomes, even when reliable impact projections are unavailable (Kale, 2013). An assessment of the CAP along with their approach allows for an understanding of the CAPs’ reliance on the climatic and non-climatic factors that impact the vulnerabilities of people as well as the strategies employed to cope with these challenges. The evaluation also points to the limitations of specific hazard-based approaches like climate models and climate impact projections which are often irrelevant at the sub-city scales. These scales are most in need of robust adaptation planning.
All CAPs adopt a composite approach of integrating both hazard-based and vulnerability-based assessment, although the reliance on the former is dominant.
CSCAF Cities
Amongst the CSCAF cities, Bhopal uses a hazard-based approach to examine both business-as-usual scenarios and low-end mitigation strategies (Department of Environment, Government of Madhya Pradesh 2023). The analysis focuses on rainfall and mean temperature but lacks insights into factors like the heat island effect and urban flooding. For vulnerability assessment, Bhopal relies on a state-wide study that assesses the vulnerability of cities around water, forests and climate 6. The analysis was done using climate modeling software for projected scenarios. While “there is no mandate from the government to conduct municipal-scale vulnerability assessment for Smart Cities, and due to tedious and time-consuming procedures” (Personal Interview- Bhopal CAP team, 2024) they decided to side-step it. Further, the interviewee informed that the vulnerability of Bhopal municipality was assumed to be identical to that of Bhopal district, neglecting the possibility of a ward or community-scale analysis of socio-economic and demographic parameters such as access to healthcare services, infrastructure, housing typology, roofing materials, etc., which are currently absent from the BCAP 7 .
Leh, Jamnagar and Junagadh follow is similar process, focusing on five sectors:(a) urban green cover, (b) energy and green buildings, (c) mobility and air quality, (d) water management and (e) waste management. While the focus is on climate modeling, temperature and rainfall projections; with two climate scenarios of middle of the road and fossil-fuel development (as per the IPCC’s Sixth Assessment Report of 2021),
6 The BCAP gives state-level maps for the water, forest and climate vulnerability. There are no city-scale maps. 7 Bhopal municipality is a part of the larger Bhopal district which consists of 614 villages, 3 tehsils and 2 block panchayats.
there is little or no attention on specific demographics impacted by climate change, nor is there any focus on the inter-sectoral linkages between the five focus areas. Instead, baseline studies of the focus areas are presented before summarizing the risk analysis. While Leh’s risk analysis is through the lens of urban flooding and water scarcity, Jamnagar identifies flood risk and storm surge hazard risk and Junagarh does not mention a specific risk analysis.
C40 Cities
Mumbai and Chennai follow C40 Cities Climate Change Risk Assessment (CCRA) framework. Mumbai analyses each hazard spatially and temporally indicating areas impacted by the heat island effect within the city, owing to the impact of land use on surface temperature. It goes on to analyze vulnerability based on three aspects – socioeconomic sensitivities, physical environment and access to services. Through the vulnerability assessment framework, the CAP comprehends the disparities in the impacts of different hazards based on different sensitivities like home ownership, access to information, access to drinking water, healthcare and sanitation services, etc. Deriving this assessment, it highlights the most vulnerable ward 8. While Chennai adopts the same framework, in assessing vulnerability, it focuses on slums and fisher-folk, physical infrastructure and health infrastructure, relying on variable parameters.
In doing so, the CAP analyses the housing conditions, and proximity to areas susceptible to flooding and sea level rise; for physical infrastructure: impacts of hazards like flooding on bus stops, metro stations, suburban railways, sewage treatment plants and power charging stations. A similar evaluation is conducted for healthcare facilities and disaster relief centers: impact of flood inundation on disaster relief infrastructure and healthcare centers and accessibility of public healthcare units at the time of water stagnation. Bengaluru’s vulnerability assessment uses the Climate Hazard Vulnerability Assessment (CHVA) Framework developed by World Resources Institute (WRI), India. The vulnerability assessment at the ward scale is based on three dimensions – hazard exposure considers areas exposed to maximum flooding, land surface temperature greater than 35 degrees Celsius and air pollution; demographic parameters keeping in mind population density, female literacy, informal settlements, housing with temporary roofs and scheduled caste and scheduled tribes’ populations among others; and adaptive capacity that assesses access to basic services and infrastructure like electricity, clean cooking fuel, treated drinking water, fire stations, healthcare, etc.
ICLEI Cities
The ICLEI cities’ approach is like the C40 methodology. The emphasis is on climate hazards such as urban flooding, high land-surface temperatures (LSTs) and to some extent air pollution. The Climate Risk and Vulnerability Assessment (CRVA) and baseline assessment is made is made – toward different GHG emission scenarios for the city. The selected focus areas across the nine ICLEI cities tend to include a combination of water supply, sewerage, solid waste management, transportation, air quality, health as well as urban greening and biodiversity that are most fragile to climate change. These focus areas have mitigation-based risk assessments to reveal climate challenges for the entire city, as well as vulnerability assessments based on spatial analyses to highlight climate-vulnerable areas. The adaptive capacity of different stakeholders is provided, revealing how groups such as the urban poor, elderly, children, women, vendors etc. have the least adaptive capacity relative to major government and private institutes.
This mix of vulnerability and hazard-based approaches lead to the contextualization of the climate actions proposed to achieve climate resilience in the ICLEI cities. In all the sixteen CAPs, the approach to identify climate risks and (for those that mention) populations susceptible to vulnerabilities is top-down, relying primarily on climate modeling and quantitative data analysis based on projections. Overall, these CAPs
presented ward-level data illustrating vulnerabilities across different dimensions. This serves as an entry point in prioritizing actions towards high-risk areas, however, there remains a limited understanding of the specifics regarding communities - their livelihoods, migration patterns, the everyday coping mechanisms and adaptation strategies. Notably, comprehending these specifics would require a deep-delve into localized climate impacts, associated challenges and coping abilities (mechanisms) of those most impacted. These, we argue (and demonstrate in Section IV) are critical to devise contextually derived adaptation strategies that speak to the objectives of climate justice.
Stakeholder Consultation and Participation
This criterion is crucial in assessing the democratic, inclusive and equitable nature, especially of the adaptation policies. Stakeholders are individuals or groups who possess valuable first-hand experience in dealing with and adjusting to the fluctuations and severity of climate change (Burton et al., 2005). These experiences, both current and historical, equip them with insights into how to effectively navigate environmental shifts and attendant impacts. In responding to the impacts of climate change, the most crucial resource available is the human element itself (Burton et al., 2005). At this point, an important distinction between stakeholder consultation and participation mentions merit.
While stakeholder consultation involves seeking feedback and or comments, stakeholder participation means involving the public in an active decision-making process (Stewart, 2009). Participation is a more democratic and inclusive form of decision-making which would potentially involve the most vulnerable stakeholders to foster their knowledge and adaptive capacities into comprehensive strategies (Reed, 2008). All CAPs mention stakeholder consultation and participation at multiple stages. However, stakeholder consultation is particularly concentrated in the initial phase of the sector and risk privatization, participation is conspicuous by its absence.
CSCAF Cities
In Bhopal stakeholder consultations occurred through two workshops with city and government officials, academicians, NGOs and CSOs, primarily to get into the key challenges confronting the city, including emissions reduction and enhancing resilience. There is no mention of representatives from vulnerable communities as participants, potentially missing valuable perspectives from those most affected. Additionally, it makes no mention of any form of engagement to assess coping strategies, an understanding of which is critical to devise effective adaptation planning (Mohan and Muraleedharan, 2024).
Leh, Jamgarh and Junagarh conducted three stakeholder consultations over nine months with residents, city officials and relevant NGOs. The first consultation was to validate and correspond on identified climate challenges, while the next collaboratively defined the respective CAP’s vision. Based on these consultations, target setting took place in reference to stakeholders’ recommendations. In the last consultation, only city officials were spoken to for their green light on the final CAP report. Only the Leh mentions conducting consultations with business and religious associations as well as academicians; the other two only provide a list of city officials and NGOs consulted. Moreover, just Jamnagar explicitly mentions feedback from stakeholder consultations in the report’s climate adaptation and mitigation action recommendations. Like other CAPs, however, no effort is made to consult with vulnerable populations such as at-risk to flood slum residents residing beside Jamnagar’s coast.
Mumbai entailed stakeholder consultation through three workshops with domain experts, NGOs, researchers, international development agencies, students, climate enthusiasts and citizens. The second one was dedicated to the city corporation and other arms of the government and sought to a) facilitate comprehensive discussions on the appropriateness and feasibility of proposed actions; and b) to critically evaluate the existing impediments that could potentially hinder successful implementation. The final workshop involved ward-level officials seeking insights and experiences on challenges specific to various areas within the city. While Mumbai reached out to a range of stakeholders both government and nongovernment, there is a noticeable gap in representation from vulnerable communities. Chennai and Bengaluru followed a similar process of workshops with similar stakeholders conducting conversations on the GHG inventory and vulnerability assessment, the city’s capacity to implement climate actions and gaps in policy and action; and one-on-one workshops concerning a specific sector.
ICLEI Cities
Cities following the ICLEI framework are ambiguous on the exact timeline and number of interactions with stakeholders. The few mentions of stakeholder interactions are those that are deemed as “multilevel stakeholder collaboration” (Foreword, Rajkot Climate Resilient City Action Plan, 2025) through focus group discussions and consultations with “civil society, government departments and research-based institutions” to validate secondary research on energy consumption and climate projections, for example (Coimbatore Climate Resilient City Action Plan, 2024, pp 76). Roughly the preparation of these CAPs took between six months to two years. For instance, Ahmedabad’s mayoral announcement from January 2023 committed to the development of a CAP for the city, which was released to the U20 summit in July that year.
Meanwhile, Rajkot also made the commitment in January 2023, releasing the final report in August 2024. Similarly, Vijayawada and Kakinada decided in June 2023 and finalized the report in early 2025. Once again though, unlike other cities, there is a relatively scarce mention of the number of meetings with stakeholders, at what stage of the CAP-creation process the consultation occurred (if at all), the outcomes from these interactions. Like other cities there is little acknowledgment of heterogeneities among stakeholders beyond the private-public binary. Each CAP has a section detailing climate-vulnerable stakeholders and their respective adaptive capacities ‘score,’ but no direct interactions with specified groups such as migrant labor and vulnerable populations. While all sixteen CAPs attempt both consultation and participation, in effect, participation is tokenistic.
Rajkot and Siliguri fail to mention the stakeholders consulted, instead referring to them simply as seemingly homogeneous private or public entities. In other words, citizens did not play an active role in decisionmaking, which means experiences from and about specific contexts – those that are most impacted–are missing. The limited inclusion of citizens and communities in the stakeholder engagement process underscores a potential gap in understanding the true nuances of local challenges and the effectiveness of current coping mechanisms. By neglecting direct interactions with the very individuals who are most affected, the plans unintentionally overlook crucial insights that could inform adaptive strategies. This observation underscores the need for a more inclusive approach, where direct participation from vulnerable communities is considered to ensure that their unique challenges and needs are adequately addressed within the CAP framework.
Coverage
Coverage refers to the specific dimensions of the urban environment that policies are directed at. Three distinct dimensions of coverage have been identified: sectoral coverage (encompassing industry-specific sectors such as transportation, energy and green building, and waste management), demographic coverage (incorporating social indicators like literacy, gender, and economically disadvantaged sections), and geographical coverage (encompassing spatiality). These categories aid in comprehending the range of effects that adaptation policies generate.
The CAPs establish sector-specific goals around energy and green building, transportation, urban greening and biodiversity conservation, and waste management. In Bhopal, according to an interviewee sectors like energy and green building, transportation and waste management, only mitigation activities can be possible. While this has proved insightful for planning mitigation, adaptation planning requires an understanding of the specific sub-city geographies facing repeated climate hazards and the demographics in these geographies that are most susceptible to the risk of identified climate hazards. This requires mapping the socio-economic trends at the city and sub-city levels- discussed in the next subsection.
Leh, Jamnagar and Junagarh provide sectoral and geographical coverage but fail to account for demographics that are most vulnerabilities. After providing a flood risk assessment map and the baselines (for the five themes of the CSCAF framework - these findings are frequently used to chalk out strong mitigation projects.
C40 Cities
Premised on a baseline assessment, Mumbai identified two additional goals: urban flooding and water management and air quality. For each of these sectors, the CAP attempts to identify vulnerable populations. It formulates corresponding adaptation strategies at the city level while acknowledging the requirement for a more detailed assessment at the ward level. Additionally, there’s an emphasis on actions tailored to specific industries aligning with the populations that demand immediate attention. For instance, within the energy and building sector, the outlined action specifies developing a road-map for retrofitting energyefficient equipment, especially for low-income settlements. The actions for urban flooding and water management include building climate-proof water supply and sewage infrastructure in slums. It intersects an understanding of the geographies and associated demographics to identify locations requiring open spaces, storm-water drains and constructing flood shelters for those who are most susceptible.
Chennai’s adaptive strategies are centered around two key aspects. First, it emphasizes geographic coverage by preserving natural water systems and enhancing storm-water management techniques. Second, it incorporates demographic coverage through initiatives like awareness campaigns and programs to enhance the capacities of vulnerable communities such as slum settlements and fisher-folk. For this demographic, Chennai directs its attention towards two vital sectors – housing and healthcare – to bolster adaptation management.
Bengaluru’s adaptive strategies outline the need for a strong geographic coverage. Several strategies in the water, wastewater and storm-water as well as urban planning, greening and biodiversity sectors elucidate the need for ward-level data and plans to target more vulnerable areas and populations. Bengaluru incorporates demographic coverage through specific strategies that target low-income groups, women and the elderly through Information, Education and Communication (IEC) campaigns and involving them in participatory planning.
The ICLEI cities predominantly rely on sectoral and geographical coverage. Sectors such as water supply, solid waste management and air pollution are individually explored in terms of their ‘urban system gaps,’ mapping wards that are particularly vulnerable to urban flooding for instance (Tirunelveli Climate Resilient City Action Plan, 2024, pp 80). Each of these cities’ ‘actor analysis and adaptive capacity’ provides a list of different groups’ resilience to climate disasters and stressors for private entities, public institutions and specified others. Here, vulnerable populations - slum residents, rag pickers, street vendors etc (including the elderly, women, people with special needs)- are given an ‘adaptive capacity score.’ Climate-vulnerable groups are occasionally mentioned in proposed climate actions, but emphasis is predominantly laid on wards and locations that are vulnerable to intense heat and urban flooding. For instance, Coimbatore classifies 59%, 19% and 3% of its population as vulnerable, highly vulnerable and extremely vulnerable to extreme heat (Coimbatore Climate Resilient City Action Plan, 2024, pp 87).
As is evident, the CSCAF framework CAPs excludes demographic coverage, while the other CAP methodologies establish some degree of sectoral, geographic and demographic correlations. . In contrast, Chennai and Siliguri not only identify vulnerable populations but also directs specific adaptation strategies toward these populations. Yet, even the C40 and ICLEI CAPs that categorise slums and vulnerable populations deem them as homogeneous entities. Various slums exhibit distinct levels of vulnerability and employ diverse coping mechanisms. Factors such as tenure security, women and children demographics, and access to basic services significantly influence the adaptive capacities of vulnerable populations. Delving deeply into the intricacies of various slums within a city provides enriched insights for adaptive planning as discussed further in Section 4.
The extent of demographic coverage is contingent upon socio-economic mapping. Furthermore, the intersection of demographic data with geographical and sector-specific coverage is a by-product of correlating various socio-economic factors derived from the mapping exercise.
CSCAF Cities
In Bhopal the focus remains relatively broad, offering a general overview of population distribution and key urban establishments and businesses of the city with little or no focus on the settlements, informal economy and associated livelihood data. This resonates with the generic nature of the CAP, manifesting in the inability to arrive at specific adaptation strategies tailored to the needs of diverse communities. While Leh, Jamnagar and Junagarh account for ward-wise population growth and density, tourist hotspots, walkability scores, major livelihood distributions and flooding risk profiles, a detailed focus on other relevant indicators like literacy rates, different levels of access to basic services or gendered access to mobility are missing.
All the plans outline ward-wise physical characteristics to provide a picture of the city’s climate vulnerabilities. Yet the populations across the wards are viewed homogeneous without accounting for the vulnerable populations and the disproportionate impacts on these communities 9. Overall, the CSCAF framework has not enabled the CAPs to account for identifying demographic variables to addresses climate justice within the cities. 9
Mumbai offers a more comprehensive analysis, encompassing trends in slum populations, literacy levels (including identification of wards with low literacy rates), mobility patterns, and gender-based disparities. The plan highlights the most vulnerable wards in terms of literacy levels, access to infrastructure and healthcare. Yet, it fails to target climate action for the identified vulnerable wards. Hence, even though there is socio-economic mapping, the translation of those insights into actions is missing. Chennai integrates socio-economic mapping in the profiling of risks and vulnerabilities. In emphasizing the vulnerable populations such as slum dwellers and fishing communities, Chennai provides information on housing typologies, aiding infrastructure as well as allied employment details, especially for the fishing community.
These insights are converted in form of targeted actions like conducting regular census of the marine fisher-folk with details of standard of living, income levels and quality of assets and assess the houses in relation to mean sea level rise. Bangalore takes a similar approach where it provides maps of vulnerable wards based on various socio-economic factors. The strategies mention the need to collect relevant wardlevel data and develop micro-level plans.
ICLEI Cities
In contrast, ICLEI cities provide adaptive capacity scores of selected demographic groups. However, there is little mention of other socio-economic characteristics that render communities vulnerable to varying levels of climate events. As explored in the coverage section, the spatial and sectoral focus of ICLEI CAPs do not extend to specificities about impacts of inequitable access to climate resilient services and livelihoods. Instead, more general statements such as ‘45% households have sewer network connections, which are predominantly laid in the core city’ (Coimbatore Climate Resilient City Action Plan, 2024, pp 45) or 67% of the city being a part of the sewer network (Tiruchirappalli Climate Resilient City Action Plan, 2024, pp 213) are used to appeal for improved coverage.
This approach fails to address which populations are facing added climate vulnerability given lack of formal sewage infrastructure, limiting the scope of demographic coverage through socio-economic mapping. Although Mumbai incorporates a comprehensive socio-economic coverage, it does not directly channel these findings into specific actions that support vulnerable communities. For example, CAP actions almost universally focus on solar rooftop installations in formal areas, which Pradhan (2025) argues to have ‘missing equity components’ such as ensuring accessible, cheap energy for low-income households. For every adaptation measure that focuses on resilience building concerning intense heat and urban flooding, there is a crucial lack of social vulnerability mapping or equitable post-disaster recovery systems (Pradhan, 2025). Therefore, across all CAPs, the need to study climate vulnerabilities and provide adaptation measures through the intersecting influences of all three of sectoral, geographic and demographic coverage is lacking.
In conclusion, the stage one evaluation highlights a significant methodological gap in the preparation process of the CAPs. The predominant approach employed is top-down which is supported by climate modeling, with little or no understanding of the nuances of the impacts of climate hazards across different segments of the city’s population. The experiential dimension of those most impacted by climate hazards is rarely captured. For example, the BCRP notes that the per capita open space available is only 1.3 sqm in the city. While this highlights the scarcity of open spaces in Bangalore, it fails to convey the nature of the existing open spaces, the population utilizing them, or whether these spaces are inclusive enough for vulnerable communities. The top-down approach restricts the emergence of such details, impeding their contribution to micro-level planning. Similarly, while studying the socio-economic conditions, all CAPs lack specificity regarding socio-economic groups, their financial circumstances, occupational profiles, and trends in industrial development and shifting livelihood patterns. In other words, the CAPs successfully highlight the vulnerability of the city, but do not highlight the vulnerabilities of its people.
City, Year and Methodology
Bhopal (2023, CSCAF)
Mumbai (2022, C40)
Chennai (2023, C40)
Bengaluru (2023, C40)
CLIMATE ACTION PLANS (CAPs) - SUMMARY
Climate Resilient and Adaptive societies
Net Zero by 2050 and Climate Resilience
Carbon Neutrality and Water Balance
Towards Net Zero and Climate Resilience
Leh (2024, CSCAF)
Net Zero by 2047 and Climate Resilience
Jamnagar (2024, CSCAF)
Net Zero by 2050 and Climate Resilience
Transform Bhopal into a Solar City, Waste Management, Transport, Green and Inclusive Spaces, Water Resilience, Climate Resilient Infrastructure
Energy and Buildings, Sustainable Mobility, Sustainable Waste Management, Urban Greening and Biodiversity, Urban Flooding and Water Management, Air Quality
Electric Grid and Renewable Energy, Energy and Buildings, Waste Management, Urban Flooding and Water Scarcity, Vulnerable Populations and Health
Energy and Buildings, Transportation, Solid Waste Management, Air Quality, Wastewater and Stormwater, Urban Planning + Greening and Biodiversity, Disaster Management, Water Management
Water Management, Combating Flash Floods, Revamped Waste Management, Emission Reduction through Transport Transformation, Reduction of Electricity Usage
Decarbonize Stationary Energy Emissions, Adoption of Green Transport Network, Resource Efficient Circular Waste Economy, Build Heat and Flood Resilience, Environmental Health and Biodiversity, Sustainable Water and Used Water Management
Junagadh (2024, CSCAF)
Net Zero by 2050 and Climate Resilience
Ahmedabad (2023, ICLEI)
Siliguri (2024, ICLEI)
Coimbatore (2024, ICLEI)
Rajkot (2024, ICLEI)
Net Zero by 2070 and Climate Resilience
Net Zero by 2070 and Climate Resilience
Net Zero by 2070 and Climate Resilience
Net Zero by 2070 and Climate Resilience
Decarbonize Stationary Energy Emissions, Resource Efficient Waste Management, Reduce Vehicular Emissions, Efficient Water and Waste Management, Sustainable Tourism and Heritage Management, Adopting Climate-Sensitive Planning Approaches
Built Environment and Energy, Transport, Water, Wastewater, Stormwater, Solid Waste, Urban Greening and Biodiversity, Air Quality
Built Environment and Energy, Transport, Water, Wastewater, Stormwater, Solid Waste, Urban Greening and Biodiversity, Air Quality
Built Environment and Energy, Transport, Water, Wastewater, Stormwater, Solid Waste, Urban Greening and Biodiversity, Air Quality
Built Environment and Energy, Transport, Water, Wastewater, Stormwater, Solid Waste, Urban Greening and Biodiversity, Air Quality
Udaipur (2024, ICLEI)
Tirunelveli (2024, ICLEI)
Tiruchirappalli (2024, ICLEI)
Kakinada (2025, ICLEI)
Net Zero by 2070 and Climate Resilience
Net Zero by 2070 and Climate Resilience
Net Zero by 2070 and Climate Resilience
Net Zero by 2047 and Climate Resilience
Vijayawada (2025, ICLEI)
Net Zero by 2047 and Climate Resilience
Built Environment and Energy, Transport, Water, Wastewater, Stormwater, Solid Waste, Urban Greening and Biodiversity, Air Quality
Built Environment and Energy, Transport, Water, Wastewater, Stormwater, Solid Waste, Urban Greening and Biodiversity, Air Quality
Built Environment and Energy, Transport, Water, Wastewater, Stormwater, Solid Waste, Urban Greening and Biodiversity, Air Quality
Built Environment and Energy, Transportation, Water Supply, Wastewater Management, Stormwater Management, Solid Waste Management, Urban Greening and Biodiversity, Health
Built Environment and Energy, Transportation, Water Supply, Wastewater Management, Stormwater Management, Solid Waste Management, Urban Greening and Biodiversity, Health
Table 1. Summary of Selected Cities’ Climate Action Plans
Across the sixteen cities, there is a perceivable balance between mitigation and adaptation. Overall, the latter accounts for 50.41% of all actions proposed, while mitigation stands at 49.59%. In the CAPs using the CSCAF framework mitigation exceeds adaptation. Bhopal and Leh are particularly mitigation-heavy at over 70% of total climate actions proposed. Bangalore – using the C40 C40 framework is the only city to have more adaptation than mitigation; Chennai and Mumbai have mitigation standing at 52% and 64% of total actions respectively. Seven out of the nine ICLEI cities put forward adaptation actions more frequently than mitigation, with Vijayawada and Tirunelveli being mitigation dominant (see Figure below)
Yet, a further understanding of the nature of adaptation actions – as discussed in the next Section reveals a different understanding. Fig 7: Distribution of mitigation and adaptation actions in the selected cities’ CAPs
4.2 Stage Two Evaluation: Applying Biagini et al.’s (2014) Typology
This section uses Biagini et.al’s (2014) adaptation typology to evaluate the recommended adaptation strategies – enabling an understanding of the nature of adaptation proposed. As mentioned above, Biagini et al’s typologies were collapsed into 6 categories- Capacity Building; Finance; Infrastructure Upgradation; Management, Planning and Policy; Information and Technology; and Practice and Behavior 10 .
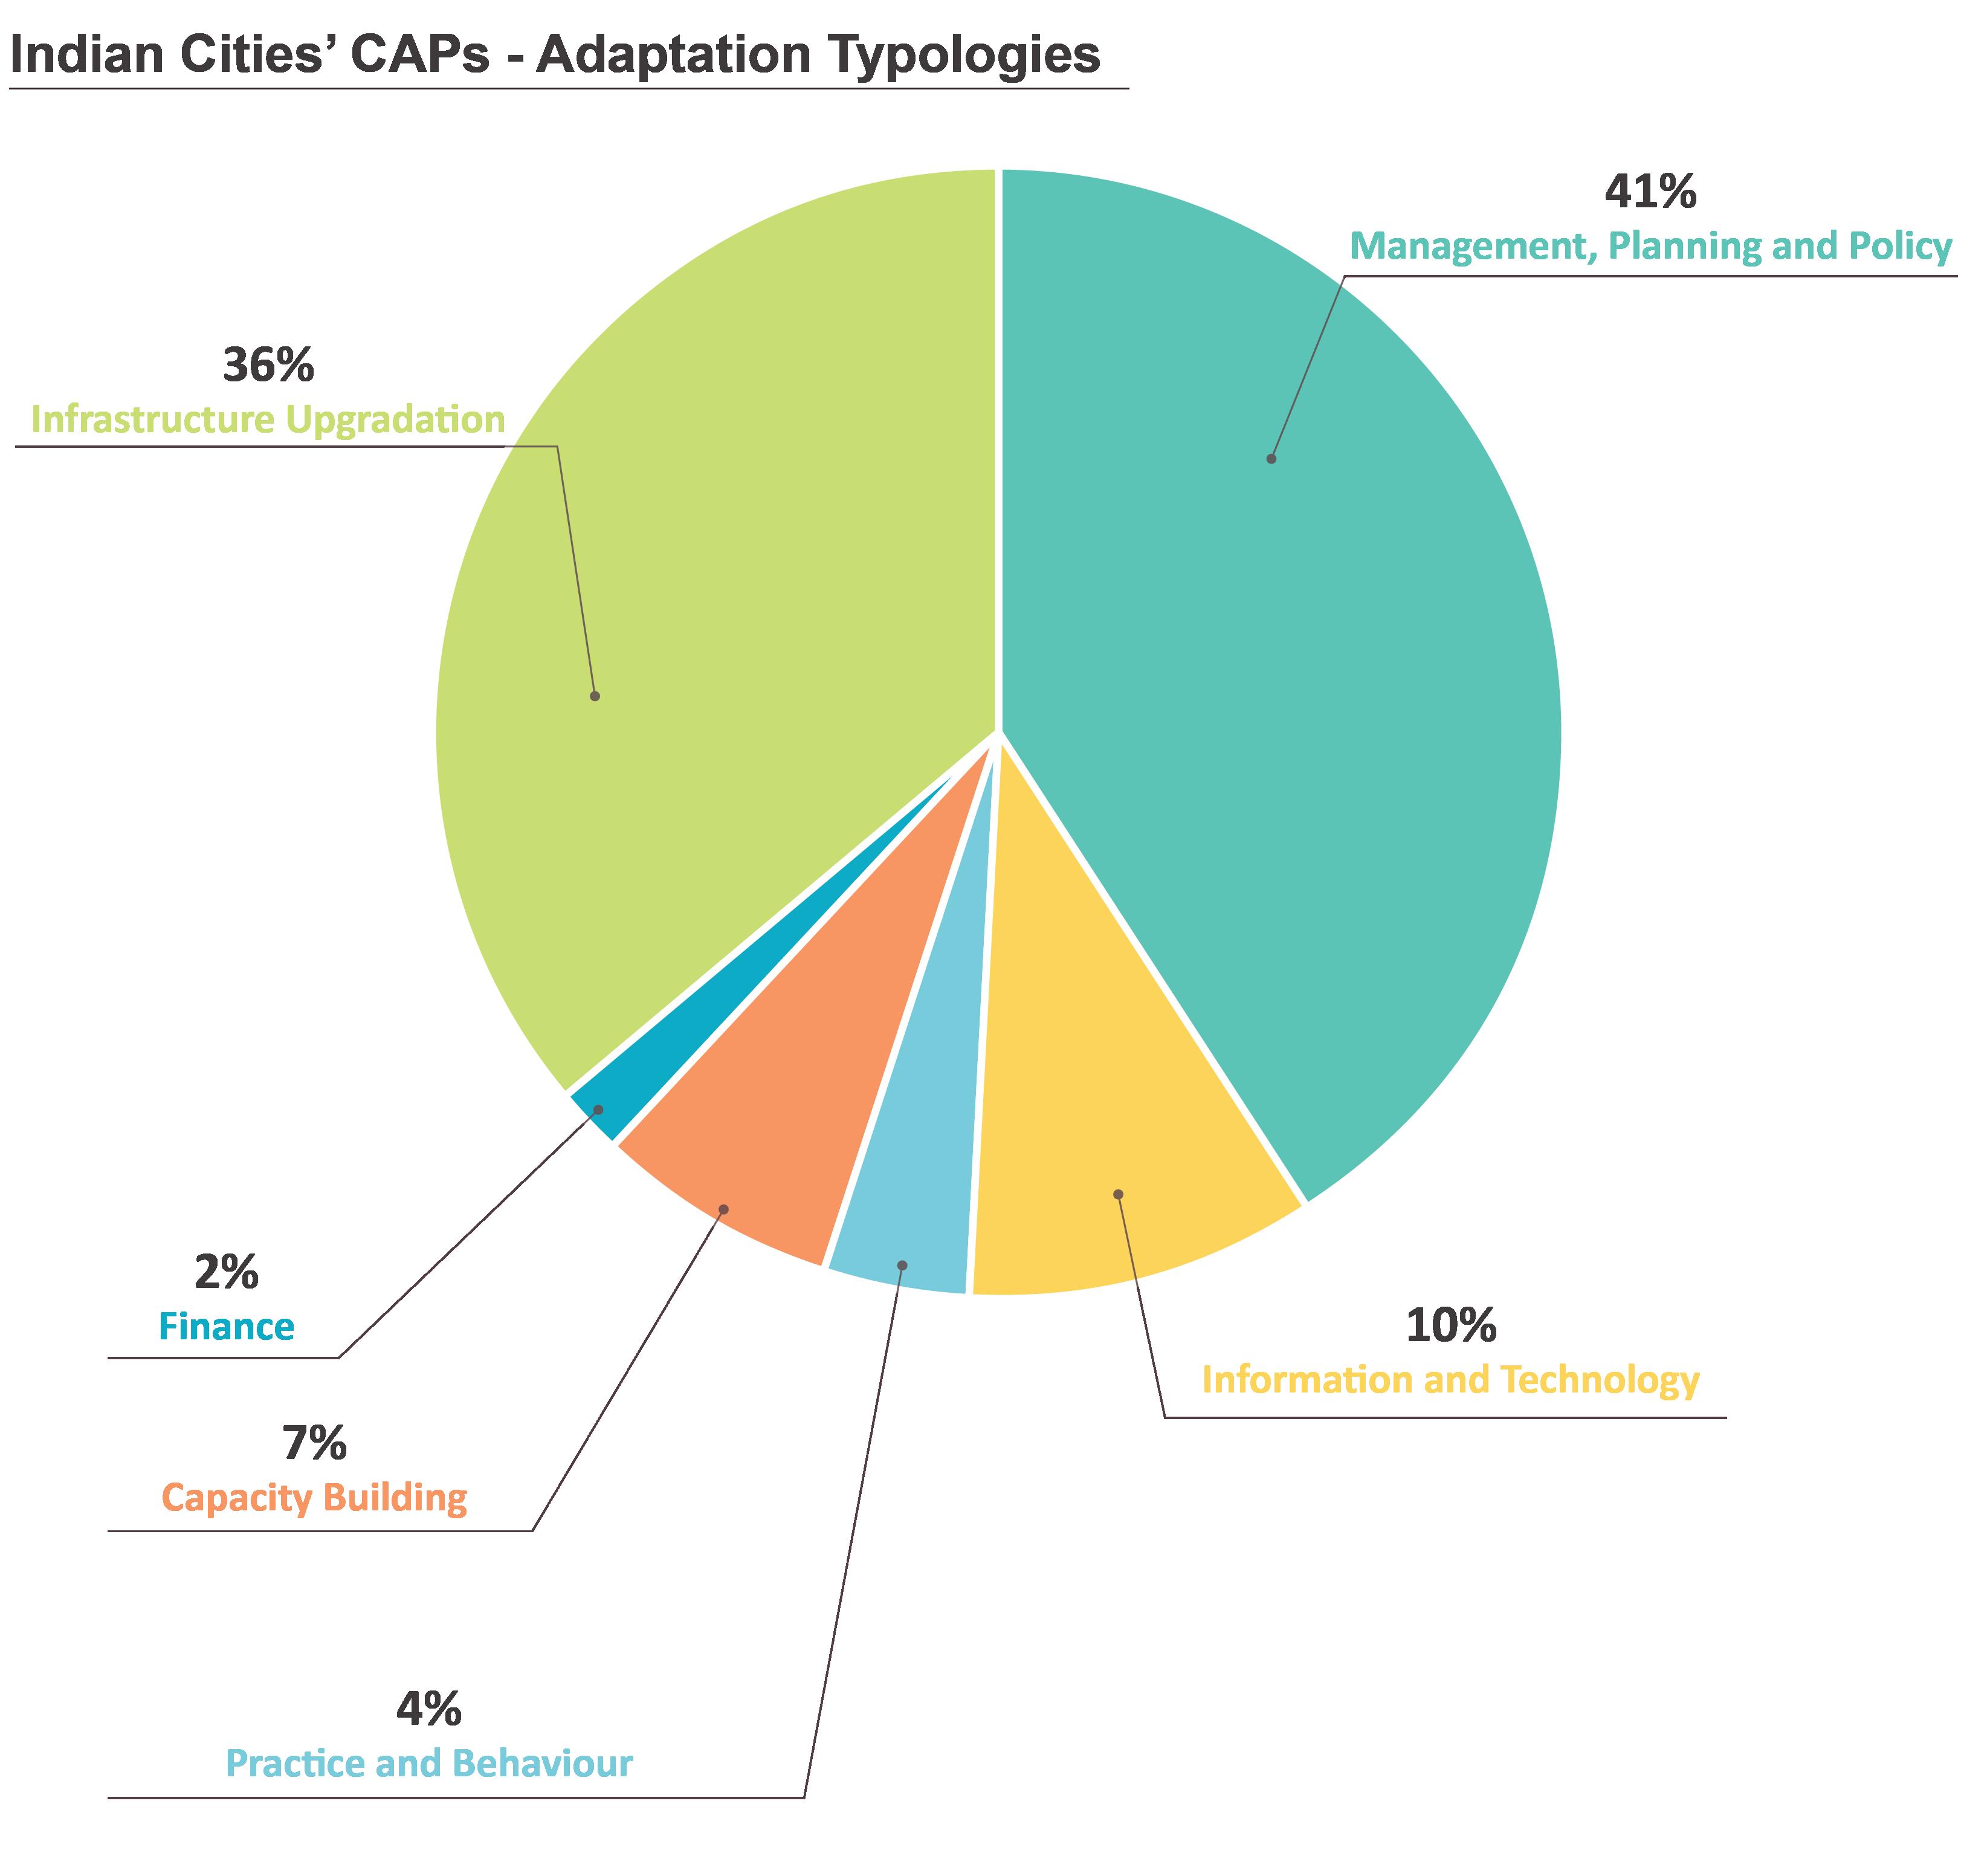
As is evident from the above Figure 8 and Table 2 adaptation actions that speak to Management, Planning and Policy are dominant (being as high as 79% in Jamnagar). These actions span a wide range of sectoral priorities — from sustainable water and used water management to building heat and flood resilience. Examples include creating a comprehensive storm-water management plan that encompasses the entire city as opposed to the current network reaching only 40% of its area. This is followed by actions under the Infrastructure Upgradation and Information and Technology category.
10 Leh, Jamnagar and Junagarh categorize climate actions that straddle mitigation and adaptation. In these few instances, we have decided to classify them into either mitigation or adaptation (based on whichever is more predominant) based on the detailing of this action. For instance, Jamnagar proposes ‘treated used water for industry’ as a climate action that we have placed as a ‘mitigation’ effort — focusing on mandating treated use water among some industrial units and providing regulations through a cost model to incentivise the transition to less freshwater production use. Moreover, these CAPs also provide numerous ‘sub-actions’ under each climate action, which we have chosen to omit in this paper for the sake of consistency with the other four CAPs. Similarly, for ICLEI cities, some measures such as solar-powered transport in Tirunelveli have been classified as an adaptation action – but we have placed them in the mitigation category based on our discretion and to be consistent with other CAPs’ classification of mitigation and adaptation activities.
INDIAN CITIES’ CAPs – DISTRIBUTION OF ADAPTATION TYPOLOGIES
Table 2. Analyses the distribution of adaptation typologies in Indian cities’ CAPs as per Biagini et al. 2014’s Classification
In Jamnagar, infrastructure upgradation accounts for 14% and Information and Technology is 7%. Actions include floodwater detention and retention basins, enhancing green spaces that have reduced dramatically in recent decades and documenting biodiversity hotspots. Similarly, in Leh, Management, Planning and Policy actions (60%) include reduction of freshwater usage and improving groundwater recharge. Here, a series of restrictions are introduced to limit the extraction of groundwater, while simultaneously developing pricing regimes and improving wastewater use facilities. Infrastructure Upgradation is at 20%. Proposals include the redevelopment of the Leh Canal and strengthening storm water drainage to mitigate mudslides and landslides as well as better manage floodwater in a city that suffers frequently from urban floods. Information and Technology as well as Finance typologies at are at 10% each. Junagarh is the only plan where infrastructure upgradation dominates at 69% followed by Management, Planning and Policy at 39%. The former includes heritage conservation for emission reduction, building level measures to cope with heat in public institutions and improving drainage infrastructure amongst others. The latter proposes policies on improving bus services in the city, better regulation of construction projects to maintain a human-wildlife balance and developing heat action plans.
Across cities, adaptive actions under capacity building, finance and practice and behavior are abysmally low or conspicuous by their absence. Some examples include advocating for more stringent regulations within biodiversity hotspots, the widespread installation of LEDs in households, and the implementation of monitoring systems to track surface run-off and water quality. Bengaluru outlines the highest number of adaptation actions. The plan lists several planning mechanisms needed for the city starting with a master plan, blue-green policy and aquifer plan among others, emphasizing the need for integration and cutting across silos. For instance, it mandates the integration of the blue-green policy (and spaces) within the Master Plan and the aquifer plan towards informing the groundwater recharge plan. It is the only plan amongst all others that has recognized urban commons as crucial for the overall resilience of the city not only from the perspective of biodiversity but more so with respect to livelihoods associated with these commons. Furthermore, it emphasizes on several ward-level actions like collecting water consumption data, disaster preparedness systems and responses, and ward-level disaster management cells. Under Infrastructure Upgradation, the plan outlines strategies like conversion of footpaths into permeable materials, upgrading existing sewage treatment plants to meet the standards of the Central Pollution Control Board, and improving the existing storm-water drainage networks as per the storm-water drainage policy among others.
Ahmedabad, Rajkot and Udaipur have the highest proportion of adaptation actions at over 58% each. In these cities too, the categories of Infrastructure Upgradation and Management and Planning and Policy contribute to at least three fourths of the total proposed adaptation activities. These typologies most frequently fall under the ‘water supply’ fragility system category. Examples under these two typologies include developing water management plans, 24x7 water supply for the city and rejuvenating lakes and riverfronts. While Rajkot mentions that 16% of its slum population and 29% of total vendors are vulnerable to urban flooding which could hamper their access to safe and secure water supply (Rajkot Climate Resilient City Action Plan, 2024, pp 97) its adaptation actions do not speak to these vulnerabilities. Although, proposals seeking to ‘improve storm water drainage networks in areas susceptible to urban flooding’ are a step forward, these are not sufficient. The plan lacks exploration of how local communities interpret and respond to climate stressors. Capacity building efforts to support them are missing. This reveals a key finding that across The C40, CSCAF and ICLEI cities - even if the proportion of adaptation actions vary, a common thread across methodologies is a lack of demographic coverage and socio-economic heterogeneities - in turn leading to a reliance on adaptation interventions that are context blind.
Vijayawada, Kakinada, Coimbatore, Tiruchirapalli, Tirunelvelli, and Siliguri see at least 85% of adaptation actions pertaining to Infrastructure Upgradation and Management, Planning and Policy. The remaining four typologies see proposed actions such as partnering with local institutions to develop green corridors (urban greening and biodiversity) and incentivising switching from high-polluting old vehicles (air
pollution and Practice and Behaviour) and implementing traffic surveillance cameras (Information and Technology). Many of the adaptation efforts run similar across the ICLEI cities, owing to the near-identical methodology used. The typology Finance is at 0% for the nine ICLEI cities.
Overall, while the CAPs exhibit a consistent focus on high-level mandates and regulations, they overlook the potential of other equally essential strategies, such as awareness generation and information dissemination within vulnerable communities. For example, the Bengaluru does not mention any action related to (a) Capacity Building, Mumbai provides actions like organizing capacity building of health workers in heatrelated illnesses. These grassroots efforts can play a pivotal role in enhancing community resilience by fostering a deeper understanding of climate risks and empowering individuals with the knowledge and tools to mitigate these challenges. The 2024 UNEP Adaptation Gap Report reveals that adaptation efforts in developing countries chronically suffer from financial constraints (2024, pp 83). This research supports this finding as the Finance typology constitutes a mere 2.20% of total adaptation actions across the sixteen cities. This typology has the least actions. This is despite the C40 and CSCAF frameworks outlining financial strategies as a separate category. While Bengaluru suggests the integration of multiple financing streams to implement rainwater harvesting and lake rejuvenation projects, the ICLEI cities, mention indicative costs for implementation of adaptation actions.
Practice and Behavior is also one of the most neglected at less than 10% of adaptation actions in fifteen out of the sixteen cities. Mumbai, Leh, Jamgarh and Junagarh list no adaptation actions under this typology. Chennai mentions few while Bengaluru suggest strategies like conducting sensitization workshops on the segregation of waste and the impacts of climate change. IEC campaigns for fragile urban systems such as solid waste management and water supply management, urging better waste-related practices find mention in the ICLEI cities. The limited role of this typology renders citizens as passive actors to climate change, ignoring negating the crucial role of behavioral changes to achieve improved adaptation.
Essentially, while policy-level actions are crucial, a comprehensive climate action approach requires the integration of diverse adaptation strategies. Strengthening the capacities of the most affected communities, coupled with effective dissemination of information about coping strategies, can better prepare them for future risks and hazards. This emphasis on capacity building is particularly vital for communities lacking the voice and agency to seek assistance from government departments. Combining top-down mandates with bottom-up initiatives through community engagement, education, and awareness-building can amplify the overall impact of adaptation.
Fig 9: Distribution of all adaptation actions in Indian Cities’ CAPs
5. Discussion: Towards Decentralised Adaptation Planning
The two-stage evaluation of the CAPs offers several insights. To begin with, while mitigation and adaptation are ‘seemingly’ balanced, despite a worldwide recognition of the importance of inclusive adaptation, there is a conspicuous deficiency on adaptation planning for the most vulnerable. This, we argue is a direct outcome of the process of preparing the CAPs. While the CAPs have incorporated stakeholder consultations involving departmental heads, NGOs and CSOs amongst others, the process misses out on the participation of the vulnerable communities thereby failing to factor in their experiences and coping mechanisms. This failure to move beyond consultation to include participation has manifested in the CAPs confining themselves to higher-level mandates, policies, and infrastructure projects. By extension, in effect, the CAPs are mitigation heavy despite adaptation being acknowledged as an emerging imperative. Further, across cities, even within adaptation strategies, the CAPs struggle to plan capacity-building and behavioral change, vital for communities to cope with impending climatic hazards. The dominance of strategies speaking to the categories of Management, Planning and Policy and the Infrastructure Upgradation are a call for the creation of climate-resilient infrastructure through policy mandates. For instance, Mumbai’s sectoral priority of ‘urban greening and biodiversity’ suggests establishing guidelines for street-side landscape to be resilient to heat and flood risks (Management, Planning and Policy) leading toward the integration of street-side landscapes with the city’s storm-water drainage network (Infrastructure Upgradation). This perpetuates the conceptualization of adaptation inherently going hand-in-hand with climate-resilient infrastructure (Dodman et al., 2022), de-emphasising a more holistic approach to adaptation that focuses on adaptive social protection (Tenzing, 2020). These findings resonate with the UNEP Adaptation Gap Report (2024) argument that despite the Asian and Pacific cities hosting larger vulnerable populations these countries have the highest percentage of adaptation actions that belong to the ‘engineering and technological’ intervention category at 39% of all adaptation actions (United Nations Environment Program Adaptation Gap Report, 2024, pp 37-39).
With recent studies suggesting the unattainability of the 1.5-degree Celsius targets of the Paris Agreement and the increasing frequency of climate risks, strengthening adaptation becomes paramount. Therefore, contextualizing adaptation is a pivotal intervention in bringing environmental and climate justice in cities. To this end, the advocacy for co-production approaches towards evolving community-based adaptation via participatory procedures engaging diverse stakeholders (Van Aalst, Cannon and Burton, 2008, Ziervogel et al., 2021; Ersoy, Aksel, 2017, Mohan and Muraleedharan, 2024) is gaining momentum. It involves recognizing, supporting, and executing development initiatives tailored to the community’s needs, thereby enhancing the ability of residents to adapt to the challenges posed by a more unpredictable and hazardous climate. The rest of this Section discusses this through the lens of ground -up efforts across India.
Integrated Design’s work in collaboration with multiple stakeholders (NGOs, community members, planners, climate experts and state officials) illustrates bottom-up approaches to adaptation planning in different Indian cities like Bhopal, Ranchi, Bangalore, Delhi and Dharwad 11. As against relying solely on consultations, attempts were made to ensure continuous participation of communities in all phases of planning. For instance, in Bhopal, climate action planning is largely driven by the communities themselves (Mohan and Muraleedharan, 2024) where the process allowed (and empowered) the community to engage in negotiations with state agencies, exemplified by efforts to secure solid waste collection from the settlement to prevent vector-borne diseases. Notably, Information, Education, and Communication (IEC) campaigns aimed at behavioral change and raising awareness about the impacts of heat stress and vectorborne diseases, amongst others emerged as the foundational trigger. The ongoing negotiation process fostered accountability and commitment within the community, exemplifying the transformative potential of participatory approaches (Mohan and Muraleedharan, 2024).
Similarly, in Dharwad, livelihood vulnerabilities were gauged through FGDs both at the city and settlement scales, yielding a comprehensive spatial and functional understanding of shared spaces. In Ranchi the arguments for a paradigm shift in planning- from a techno-managerial approach to a collaborative and communicative one (Mohan 2023) was premised on a collaboration between communities, elected representatives, the NGO and the technical partner to revive and restore community wells. The collaboration allowed for a framing of the problem through multiple lenses, understanding existing power hierarchies within the communities, and breaking them down through continuous deliberation.
This engagement across cities shed light on various dimensions of vulnerability that is not driven solely by changing climates. Interestingly, these vulnerabilities lie at the intersection of climate hazards, bad urbanization, and informality. For instance, in most low-income settlements, flooding is not solely due to the increased frequency of rainfall. A major contributing factor is redevelopment seen in the construction of roads at higher levels on the periphery of the settlement. This redirects storm-water flow directly into the settlements Importantly, it elucidated the interconnected experiences of these manifestations on the ground. The community often finds it challenging to differentiate between the impacts caused by climate change and those driven by badly conceived (and implemented) urbanization and development projects. Simple adaptation strategies that incorporate ecosystem-based solutions such as buffer vegetation and shaded spaces in common areas used for livelihood and household chores are the need of the hour. Similarly, percolation trenches to mitigate surface runoff and reduce flooding is a holistic response to the intertwined challenges posed by climate hazards and urbanization.
6. Conclusion
In conclusion, this research underscores the critical need for a paradigm shift towards integrating urban development and climate planning. While top-down Climate Action Plans (CAPs) offer valuable frameworks, their effectiveness is hindered by a detachment from ground realities. The exclusive reliance on quantitative models overlooks the nuanced complexities of local contexts and the imperative role of community engagement. The two-stage evaluations highlights the methodological gaps in the process of drafting city-level CAPs, especially in the context of adaptation planning.
Decentralized and contextual processes that foster community participation while integrating diverse perspectives can yield locally relevant and sustainable solutions. However, the integration of these bottom-up methods into existing planning frameworks remains a significant challenge. To effectively mitigate climate risks and achieve climate justice, a synergistic approach combining the strengths of topdown planning with the adaptability and inclusivity of bottom-up initiatives is crucial. By bridging this gap, cities can develop robust and resilient climate action plans that address both immediate and long-term challenges for the most vulnerable populations in cities.
This research calls for a decentralized planning model that empowers communities, prioritizes adaptation, and fosters equitable outcomes. By investing in participatory processes and capacity building, cities can harness the collective wisdom of their residents to create a more sustainable and climate-resilient future.
Fig 8: Distribution and sectoral priorities within Bhopal’s adaptation typologies
Fig 9: Distribution and sectoral priorities within Mumbai’s adaptation typologies
Fig 10: Distribution and sectoral priorities within Chennai’s adaptation typologies
Fig 11: Distribution and sectoral priorities within Bengaluru’s adaptation typologies
Fig 12: Distribution and sectoral priorities within Junagadh’s adaptation typologies
Fig 13: Distribution and sectoral priorities within Jamnagar’s adaptation typologies
Fig 14: Distribution and sectoral priorities within Coimbatore’s adaptation typologies
Fig 15: Distribution and sectoral priorities within Rajkot’s adaptation typologies
Fig 16: Distribution and sectoral priorities within Tirunelveli’s adaptation typologies
Fig 17: Distribution and sectoral priorities within Tiruchirapalli’s adaptation typologies
Fig 18: Distribution and sectoral priorities within Vijaywada’s adaptation typologies
Fig 19: Distribution and sectoral priorities within Kakinada’s adaptation typologies
Fig 20: Distribution and sectoral priorities withinAhmedabad’s adaptation typologies
Fig 21: Distribution and sectoral priorities within Leh’s adaptation typologies
22: Distribution and sectoral priorities within Udaipur’s adaptation typologies
Distribution and sectoral priorities within Siliguri’s adaptation typologies
Fig
Fig 23:
Bibliography
Aathira Perinchery (2019). Urbanization of Tirunelveli city might warm it up. [online] The Hindu. Available at:https://www.thehindu.com/sci-tech/science/urbanisation-of-tirunelveli-city-might-warm-it-up/ article26037548.ece
ADAPTATION POLICY FRAMEWORKS FOR CLIMATE CHANGE: DEVELOPING STRATEGIES, POLICIES AND MEASURES. (n.d.). Available at: https://www.preventionweb.net/files/7995_APF.pdf.
Advance unedited version Decision _/CP.8 The Delhi Ministerial Declaration on Climate Change and Sustainable Development The Ministers and other heads of delegation present at the eighth session of the Conference of the Parties to the United Nations Framework Convention on Climate Change. (n.d.). Available at: https://unfccc.int/cop8/latest/1_cpl6rev1.pdf.
Amundsen, H., Berglund, F. and Westskog, H. (2010). Overcoming Barriers to Climate Change Adaptation—A Question of Multilevel Governance? Environment and Planning C: Government and Policy, [online] 28(2), pp.276–289. doi:https://doi.org/10.1068/c0941.
Anjali Karol Mohan and Gayathri Muraleedharan (2024). Exploring co-production in redirecting climate urbanism. Climate and development, pp.1–19. doi:https://doi.org/10.1080/17565529.2024.2339249. Ap.gov.in. (2019). ABOUT DISTRICT | Kakinada District | India. [online] Available at: https://kakinada. ap.gov.in/about-district.
Araos, M., Berrang-Ford, L., Ford, J.D., Austin, S.E., Biesbroek, R. and Lesnikowski, A. (2016). Climate change adaptation planning in large cities: A systematic global assessment. Environmental Science & Policy, 66, pp.375–382. doi:https://doi.org/10.1016/j.envsci.2016.06.009.
Available at: https://www.ceew.in/how-cheruthoni-in-kerala-is-climate-proofing-infrastructure?utm_ source=chatgpt.com
Ayers, J.D. and Forsyth, T. (2009). Community-Based Adaptation to Climate Change. doi:https://doi. org/10.1093/acrefore/9780190228620.013.602.
Bhalla, G. (2022). Mumbai Becomes First City In The Country To Launch Climate Action Plan: Know All Details. [online] Indiatimes. Available at: https://www.indiatimes.com/news/india/mumbai-becomesfirst-city-in-the-country-to-launch-climate-action-plan-know-all-details-564424.html.
Biagini, B., Bierbaum, R., Stults, M., Dobardzic, S. and McNeeley, S.M. (2014). A typology of adaptation actions: A global look at climate adaptation actions financed through the Global Environment Facility. Global Environmental Change, 25, pp.97–108. doi:https://doi.org/10.1016/j.gloenvcha.2014.01.003.
Bloomberg.com. (2024). Bloomberg - Are you a robot? [online] Available at: https://www.bloomberg.com/ features/2023-india-ahmedabad-extreme-heat/.
Burton, I., 1994. Deconstructing adaptation... and reconstructing. Delta, 5(1), pp.14-15. Cag.org.in. (2023). Climate action plan is ready, let’s back it up with science | CAG. [online] Available at: https://www.cag.org.in/media-coverage/climate-action-plan-ready-lets-back-it-science.
CEEW. (2021). 29 Districts in Gujarat Vulnerable to Extreme Climate Events: CEEW. [online] Available at: https://www.ceew.in/press-releases/29-districts-gujarat-vulnerable-extreme-climate-events-ceew.
CEEW. (2022). Rebuilding Cheruthoni: How a Kerala town is climate-proofing infrastructure. [online] Available at: https://www.ceew.in/how-cheruthoni-in-kerala-is-climate-proofing-infrastructure.
Central Ground Water Board, West Central Region, Ahmedabad, 2013. District Groundwater BrochureJamnagar District, Gujarat, Ahmedabad: Central Ground Water Board, Government of India.
Chandramouli, C. and General, R., 2011. Census of india. Rural urban distribution of population, provisional population total. New Delhi: Office of the Registrar General and Census Commissioner, India.
Chennai water crisis: ‘We can’t do anything’. (2019). BBC News. [online] 22 Jun. Available at: https://www. bbc.com/news/world-asia-india-48674775.
Climate-data.org. (2021). Tirunelveli climate: Weather Tirunelveli & temperature by month. [online] Available at: https://en.climate-data.org/asia/india/tamil-nadu/tirunelveli-2784/
Come hell and high water. (n.d.). https://doi.org/10.59117/20.500.11822/46497
Debnath, M., Poddar, I., Saha, A., Islam, N. and Roy, R. (2025). Analysis of land surface temperature and its correlation with urban, water, vegetation, and surface indices in the Siliguri Urban Agglomeration area of the Himalayan foothill region. Geomatics Natural Hazards and Risk, 16(1). doi:https://doi.org/10.1080/19 475705.2025.2470393.
Deepak Karthik (2024). Sept 2024 was Trichy’s hottest and driest in 10 years. [online] The Times of India. Available at: https://timesofindia.indiatimes.com/city/trichy/trichys-record-breaking-heat-hottest-anddriest-september-in-10-years/articleshow/113858935.cms
DeshGujarat (2025). Gujarat witnesses scorching heat; Rajkot records season’s hottest day at 46.2°CDeshGujarat. [online] DeshGujarat. Available at: https://deshgujarat.com/2025/04/29/gujarat-witnessesscorching-heat-rajkot-records-seasons-hottest-day-at-46-2c/
Dodman, D., Hayward, B., Pelling, M., Castan Broto, V., Chow, W., Chu, E., Dawson, R., Khirfan, L., Mcphearson, T., Prakash, A., Zheng, Y., Ziervogel, G., Pörtner, H.-O., Roberts, D., Tignor, M., Poloczanska, E., Mintenbeck, K., Alegría, A., Craig, M. and Langsdorf, S. (2022). Gina Ziervogel (South Africa) Contributing Authors: Diane Archer. [online] doi:https://doi.org/10.1017/9781009325844.008.
Ersoy, A. ed., 2017. The impact of co-production: From community engagement to social justice. Policy Press.
European Environment Agency, 2012. Urban adaptation to climate change in Europe. Challenges and opportunities for cities, Copenhagen: European Environment Agency.
Fry, I. (2009). The Earthscan Reader on Adaptation to Climate Change - Edited by E. Lisa F. Schipper and Ian Burton. Review of European Community & International Environmental Law, 18(2), pp.223–226. doi:https://doi.org/10.1111/j.1467-9388.2009.00643_6.x.
Gondhalekar, D., Akhtar, A., Keilmann, P., Kebschull, J., Nussbaum, S., Dawa, S., Namgyal, P., Tsultim, L., Phuntsog, T., Dorje, S. and Mutup, T., 2014. Drops and hot stones: towards integrated urban planning in terms of water scarcity and health issues in Leh Town, Ladakh, India. In Ecological health: Society, ecology and health (pp. 173-193). Emerald Group Publishing Limited.
Govindarajulu, D. (2014). Urban green space planning for climate adaptation in Indian cities. Urban Climate, 10, pp.35–41. doi:https://doi.org/10.1016/j.uclim.2014.09.006.
Greater Chennai Corporation, 2023. Chennai Climate Action Plan, Chennai: Greater Chennai Corporation.
Heat Wave Action Plan -Rajkot city, Gujarat. (2024). Available at: https://www.rmc.gov.in/rmcwebsite/ docs/HomePage/Rajkot_HAP_2024.pdf
How Chennai, One of the world’s Wettest Major cities, Ran out of Water. (2021). The Economic Times. [online] 4 Feb. Available at: https://economictimes.indiatimes.com/news/politics-and-nation/howchennai-one-of-the-worlds-wettest-major-cities-ran-out-of-water/articleshow/80680182.cms.
Iclei.org. (2024). Ahmedabad Climate Resilient City Action Plan – ICLEI South Asia. [online] Available at: https://southasia.iclei.org/publication/ahmedabad-climate-resilient-city-action-plan/.
Iclei.org. (2025). Coimbatore Climate Resilient City Action Plan – ICLEI South Asia. [online] Available at: https://southasia.iclei.org/publication/coimbatore-climate-resilient-city-action-plan/
Iclei.org. (2025). Kakinada Net-Zero Climate Resilient City Action Plan – ICLEI South Asia. [online] Available at: https://southasia.iclei.org/publication/kakinada-net-zero-climate-resilient-city-action-plan/
Iclei.org. (2025). Rajkot Climate Resilient City Action Plan – ICLEI South Asia. [online] Available at: https:// southasia.iclei.org/publication/rajkot-climate-resilient-city-action-plan/
Iclei.org. (2025). Siliguri Climate Resilient City Action Plan 2070 – ICLEI South Asia. [online] Available at: https://southasia.iclei.org/publication/siliguri-climate-resilient-city-action-plan-2070/
Iclei.org. (2025). Siliguri Climate Resilient City Action Plan 2070 – ICLEI South Asia. [online] Available at: https://southasia.iclei.org/publication/siliguri-climate-resilient-city-action-plan-2070/.
Iclei.org. (2025). Tiruchirappalli Climate Resilient City Action Plan – ICLEI South Asia. [online] Available at: https://southasia.iclei.org/publication/tiruchirappalli-climate-resilient-city-action-plan/
Iclei.org. (2025). Udaipur Climate Resilient City Action Plan – ICLEI South Asia. [online] Available at: https:// southasia.iclei.org/publication/udaipur-climate-resilient-city-action-plan/
Iclei.org. (2025). Vijayawada Net-Zero Climate Resilient City Action Plan – ICLEI South Asia. [online] Available at: https://southasia.iclei.org/publication/vijayawada-net-zero-climate-resilient-city-action-plan/
Iisd.ca. (2025). ENB @ UNFCCC COP-7, 29 October - 9 November 2001, Marrakesh, Morocco. [online] Available at: http://www.iisd.ca/climate/cop7/
India, T.O. (2024). Siliguri faces acute drinking water crisis. [online] The Times of India. Available at:https://timesofindia.indiatimes.com/city/kolkata/siliguri-faces-acute-drinking-water-crisis/ articleshow/110607372.cms
India, T.O. (2025). Rajkot sizzles at 42.1 degrees, hottest in Gujarat. [online] The Times of India. Available at:https://timesofindia.indiatimes.com/city/rajkot/rajkot-sizzles-at-42-1-degrees-hottest-in-gujarat/ articleshow/118947559.cms
India’s State Action Plans on Climate Change: towards meaningful action. (n.d.). Available at: https://www. opml.co.uk/files/Publications/corporate-publications/briefing-notes/id-state-action-plan-climate-india. pdf.
Jamnagar City Climate Action Plan. (n.d.). Available at: https://niua.in/c-cube/sites/all/themes/zap/pdf/ Jamnagar%20CAP%20Report-For%20WEB.pdf
Junagadh City Climate Action Plan. (n.d.). Available at: https://niua.in/c-cube/sites/all/themes/zap/pdf/ Junagadh%20CAP%20Report-For_WEB.pdf
Kale, G.D. (2013). A Modified Combined Approach Framework of Climate Impact and Adaptation Assessment for Water Resource Systems Based on Experience Derived from Different Adaptation Studies in the Context of Climate Change. Journal of Water Resource and Protection, 05(12), pp.1210–1218. doi:https://doi. org/10.4236/jwarp.2013.512129.
Khosla, R. and Bhardwaj, A. (2018). Urbanization in the time of climate change: Examining the response of Indian cities. Wiley Interdisciplinary Reviews: Climate Change, [online] 10(1), p.e560. doi:https://doi. org/10.1002/wcc.560.
Klein, R.J., Huq, S., Denton, F., Downing, T.E., Richels, R.G., Robinson, J.B. and Toth, F.L., 2007. Interrelationships between adaptation and mitigation.
Leh City Climate Action Plan. (n.d.). Available at: https://niua.in/c-cube/sites/all/themes/zap/pdf/ LehCAP%20Report__For_WEB.pdf
Lesnikowski, A., Ford, J., Biesbroek, R., Berrang-Ford, L. and Heymann, S. Jody (2015). National-level progress on adaptation. Nature Climate Change, 6(3), pp.261–264. doi:https://doi.org/10.1038/nclimate2863.
Lim, B., Spanger-Siegfried, E., Burton, I., Malone, E. and Huq, S., 2005. Adaptation policy frameworks for climate change: developing strategies, policies and measures (Vol. 258). Cambridge University Press, Cambridge.
Limited, D. (2005). UNITED NATIONS. [online] Available at: https://unfccc.int/resource/docs/2005/sbsta/ eng/l26.pdf
Mani, S. and Head (2024). Urban Contrasts: A Comprehensive Review of Chennai and Coimbatore. International Journal of Research Publication and Reviews Journal homepage: www.ijrpr.com, [online] 5(1), pp.2450–2457. Available at: https://ijrpr.com/uploads/V5ISSUE1/IJRPR21886.pdf.
Mertz, O., Mbow, C., Reenberg, A. and Diouf, A. (2008). Farmers’ Perceptions of Climate Change and Agricultural Adaptation Strategies in Rural Sahel. Environmental Management, 43(5), pp.804–816. doi:https://doi.org/10.1007/s00267-008-9197-0.
Ministry of Enviroment, Brazil, 2016. National Adaptation Plan to Climate Change. Volume II: Sectoral and Thematic Strategies, Brasília: Ministry of Enviroment, Brazil.
Mohan, A.K. and Gayathri Muraleedharan (2023). For climate action, collaborate. [online] Deccan Herald. Available at: https://www.deccanherald.com/amp/story/opinion/for-climate-action-collaborate-1182406. html
Mohan, A.K., 2023. Contextualizing collaborative planning: Addressing water resilience in the urban poor settlements of Ranchi. Planning Theory, 22(4), pp.426-447.
Mohan, K. (2022). Socially Just and Adaptive Community Spaces. [online] ArcGIS StoryMaps. Available at: https://storymaps.arcgis.com/stories/06066d37fb284e049fec0b7408de67b4
Mohanty, A. and Wadhawan, S. (2021). Mapping India’s Climate Vulnerability. [online] CEEW. Available at: https://www.ceew.in/publications/mapping-climate-change-vulnerability-index-of-india-a-district-levelassessment.
Mp.gov.in. (2025). The Environmental Planning & Coordination Organisation. [online] Available at: https:// epco.mp.gov.in/uploads/media/5__Bhopal_MPCAP.pdf.
Mumbai Climate Action Plan. (2022). Home - Mumbai Climate Action Plan. [online] Available at: https:// mcap.mcgm.gov.in/.
Ojha, H. (2023). SPATIO-TEMPORAL ASSESSMENT OF LAND USE LAND COVER CHANGES IN UDAIPUR CITY USING SATELLITE DATA. International Journal of Creative Research Thoughts, [online] 11(7), pp.2320–2882. Available at: https://ijcrt.org/papers/IJCRT2307387.pdf.
Padmanaban, R., Bhowmik, A.K. and Cabral, P., 2019. Satellite image fusion to detect changing surface permeability and emerging urban heat islands in a fast-growing city. PloS one, 14(1), p.e0208949.
Patrika Desk (2025). Rajasthan Heatwave: 5-Day Extreme Heat Warning, Record Temperatures, Dust Storms Forecast. [online] Patrika News. Available at: https://www.patrika.com/en/undefined/rajasthanheatwave-5-day-extreme-heat-warning-record-temperatures-dust-storms-forecast-19606193
Pelling, M. (2012). The Vulnerability of Cities. Routledge.
Pib.gov.in. (2023). Net zero emissions target. [online] Available at: https://www.pib.gov.in/ PressReleaseIframePage.aspx?PRID=1945472.
Pib.gov.in. (2025). Press Release:Press Information Bureau. [online] Available at: https://www.pib.gov.in/ PressReleasePage.aspx?PRID=205679
Pielke, R.A. (1998). Rethinking the role of adaptation in climate policy. Global Environmental Change, 8(2), pp.159–170. doi:https://doi.org/10.1016/s0959-3780(98)00011-9.
Pradhan, K., 2025. Who Gets Left Behind? Equity and Inclusion in Indian City Climate Action Plans. [Online] Available at: https://transitionsresearch.org/article/who-gets-left-behind-equity-and-inclusion-in-indiancity-climate-action-plans
PRADHAN, S. and MENON, P. (1986). A STUDY OF URBAN HEAT ISLAND OVER BHOPAL. MAUSAM, 37(3), pp.407–408. doi:https://doi.org/10.54302/mausam.v37i3.2473.
Ramkumar, P. (2020). Coimbatore collector issues flood alert for people living on Bhavani river banks as Pillur dam water level is nearing full capacity. [online] The Times of India. Available at: https://timesofindia. indiatimes.com/city/coimbatore/coimbatore-collector-issues-flood-alert-for-people-living-on-bhavaniriver-banks-as-pillur-dam-water-level-nearing-full-capacity/articleshow/77342944.cms
Robledo, C., Kanninen, M. & Pedroni, L., 2005. Conclusions. In: C. Robledo, M. Kanninen & L. Pedroni, eds. Tropical forests and adaptation to climate change. In search of synergies. Jakarta: Center for International Forestry Research, pp. 184-186.
Roy, A.K. and Sharma, S. (2015). Perceptions and Adaptations of the Coastal Community to the Challenges of Climate Change. Environment and Urbanization ASIA, 6(1), pp.71–91. doi:https://doi. org/10.1177/0975425315585182.
S.Ganesan (2024). Tiruchi sizzles at 43.1 degree Celsius, hottest day since 1896. [online] The Hindu. Available at: https://www.thehindu.com/news/cities/Tiruchirapalli/tiruchi-sizzles-at-431-degree-celsiushottest-day-since-1896/article68129230.ece
Schipper, E.L.F. (2006). Conceptual History of Adaptation in the UNFCCC Process. Review of European Community and International Environmental Law, 15(1), pp.82–92. doi:https://doi.org/10.1111/j.14679388.2006.00501.x.
Sebastian, S., 2022. Rebuilding Cheruthoni. How a Kerala town is climate-proofing infrastructure. [Online]
Sharma, S., Anees, M.M., Sharma, M. and Joshi, P.K., 2021. Longitudinal study of changes in ecosystem services in a city of lakes, Bhopal, India. Energy, Ecology and Environment, 6(5), pp.408-424.
Shrimoyee, B. et al., 2023. Bengaluru Climate Action and Resilience Plan, Bengaluru: Bengaluru Climate Action Cell, Bruhat Bengaluru Mahanagara Palike.
Singh, C., Madhavan, M., Arvind, J. and Bazaz, A. (2021). Climate change adaptation in Indian cities: A review of existing actions and spaces for triple wins. Urban Climate, 36, p.100783. doi:https://doi.org/10.1016/j. uclim.2021.100783.
Stewart, J. (2009). The Dilemmas of Engagement: The Role of Consultation in Governance. [online] library. oapen.org. ANU Press. Available at: https://library.oapen.org/handle/20.500.12657/33773.
Surya, K., Rao, D., Kpr, V. and Murty (2007). A Viable Optimum Solution for Air Pollution and Climate Moderation Based On Selected, Suitable Plant Species of Vijayawada Urban Area. International Journal of Innovative Research in Science, Engineering and Technology (An ISO, [online] 3297(1), pp.2319–8753. Available at: https://www.rroij.com/open-access/a-viable-optimum-solution-for-air-pollution-andclimatemoderation-based-on-selected-suitableplant-species-of-vijayawada-urban-area.pdf
Sutton, A. (2024). Mumbai. [online] ArcGIS StoryMaps. Available at: https://storymaps.arcgis.com/ stories/23c88922723c41cd82ba001487835a4c
The Production Gap: Phasing down or phasing up? Top fossil fuel producers plan even more extraction despite climate promises. (2023). doi:https://doi.org/10.51414/sei2023.050.
The World’s Cities in 2018. (n.d.). Available at: https://digitallibrary.un.org/record/3799524/files/the_ worlds_cities_in_2018_data_booklet.pdf.
Tirunelveli.nic.in. (2024). Tirunelveli District, Government of Tamil Nadu | Oxford of South India | India. [online] Available at: https://tirunelveli.nic.in/
TNN (2022). Bhopal records highest temperature of the season at 43.9 degree Celsius. [online] The Times of India. Available at: https://timesofindia.indiatimes.com/city/bhopal/city-records-highest-temp-of-theseason-at-43-9-c/articleshow/91527764.cms
TNN (2023). After downpour, Junagadh city faces its worst flood in decades. [online] The Times of India. Available at: https://timesofindia.indiatimes.com/city/ahmedabad/after-downpour-junagadh-city-facesits-worst-flood-in-decades/articleshow/102047438.cms.
Udaipur Darpan. (2023). Weather of Udaipur Throughout the Year. [online] Available at: https:// udaipurdarpan.com/weather-of-udaipur/
UNDP (2024). What is climate change adaptation and why is it crucial? [online] UNDP Climate Promise. Available at: https://climatepromise.undp.org/news-and-stories/what-climate-change-adaptation-andwhy-it-crucial.
UNFCCC (2007). CLIMATE CHANGE: IMPACTS, VULNERABILITIES AND ADAPTATION IN DEVELOPING COUNTRIES. [online] Available at: https://unfccc.int/resource/docs/publications/impacts.pdf. United Nations Framework Convention on Climate Change. (n.d.). Available at: https://unfccc.int/files/ press/backgrounders/application/pdf/press_factsh_adaptation.pdf.
Unnikrishnan, H. and Nagendra, H. (2021). Building climate resilient cities in the global South: assessing city adaptation plans in India - ePrints@APU. Azimpremjiuniversity.edu.in. [online] doi:https://publications. azimpremjiuniversity.edu.in/3022/1/Building%20climate%20resilient%20cities%20_harini.pdf.
Van Aalst, M.K., Cannon, T. and Burton, I. (2008). Community level adaptation to climate change: The potential role of participatory community risk assessment. Global Environmental Change, 18(1), pp.165–179. doi:https://doi.org/10.1016/j.gloenvcha.2007.06.002.
Vizzuality (2020). Junagadh, India, Gujarat Deforestation Rates & Statistics | GFW. [online] Globalforestwatch. org. Available at: https://www.globalforestwatch.org/dashboards/country/IND/11/15/?category=forestchange
Wagh, H.I. and S. (n.d.). The dangerous optimism of Mumbai’s climate action plan. [online] Scroll.in. Available at: https://scroll.in/article/1020471/the-dangerous-optimism-of-mumbais-climate-action-plan.
Wamsler, C. (2025). Operational Framework for Integrating Risk Reduction and Climate Change Adaptation into Urban Development. [online] Lund University. Available at: https://portal.research.lu.se/en/ publications/operational-framework-for-integrating-risk-reduction-and-climate-
Watkiss, P., Benzie, M. and Klein, R.J., 2015. The complementarity and comparability of climate change adaptation and mitigation. Wiley Interdisciplinary Reviews: Climate Change, 6(6), pp.541-557.
Ziervogel, G., Enqvist, J., Metelerkamp, L. and van Breda, J., 2022. Supporting transformative climate adaptation: community-level capacity building and knowledge co-creation in South Africa. Climate Policy, 22(5), pp.607-622.
This research was led by Dr. Anjali Karol Mohan. Integrated Design acknowledges the contributions of Rutu Patel who anchored the research initially when the focus was on a few cities, Shoubhik Chatterjee (Intern INDE) who assisted in extending the research to the additional cities and Shruti Kulkarni who helped design the final report.