
The Journal ofSport and Exercise Science, Vol. 9, Issue 1, 1-11 (2025) www.jses.net
The relationship between force measures from isometric first and isometric mid-thigh pull with weightlifting performance across 16 weeks
Danny Lum1,2* , Paul Comfort3,4
1Sport Science and Sport Medicine, Singapore Sport Institute, Singapore
2Sport and Exercise Science, School of Allied Health, Human Services and Sport, La Trobe University, Australia
3Directorate of Sport, Exercise, and Physiotherapy, University of Salford, United Kingdom.
4Strength and Power Research Group, Edith Cowan University, Australia
A R T I C L E I N F O A B S T R A C T
Received: 17.09.2024
Accepted: 08.11.2024
Online: 18.04.2025
Keywords:
Peak force
Rate of force development
Snatch
Clean
Theaimofthisstudywastodeterminetherelationshipbetweensnatchandcleanperformance with force-time characteristics obtained from isometric first (IFP) and isometric mid-thigh pull (IMTP) over several mesocycles. Ten male and female weightlifters (age: 27.4 ± 1.9 years, body mass: 69.8 ± 113.2 kg, height: 1.67 ± 0.08 m) from the national training squad performed the IFP, IMTP, and 85% of season’s best for snatch and clean on three separate occasions each separated by eight weeks. Near perfect correlations were observed between IFPandIMTPpeakforce(PF)withsnatchandcleanpeakpower(PP)andmeanpower(MP) on week 0, 8, and 16 (r = 0.954 – 0.991, p < 0.001). Very large – near perfect correlations wereobserved between IFP forceat200 ms(Force200) and IFP rateof force developmentat 200 and 250 ms (RFD0-200 and RFD0-250, respectively) with snatch and clean PP and MP at week 0 (r = 0.753 – 0.847, p = 0.008 – 0.048). Very large – near perfect correlations were observedbetweenIFPForce50 andForce200 withsnatchandcleanPPandMPatweek8and 16(r=0.777 – 0.865,p=0.004 – 0.032).Verylargecorrelationswerealsoobservedbetween IFPRFD0-200 andRFD0-250 withcleanPPandMPatweek16(r=0.752 – 0.778,p=0.032 –0.048). The results indicate the importance of maximum force capabilities at both first and second pull positions, and early force development and RFD at first pull position for weightliftingperformance.
1. Introduction
Weightlifting is a sport which requires athletes to lift as much weightaspossible,overhead,inthesnatch (SN)andtheclean(CN) and jerk events. To succeed, athletes are required to possess the ability to generate a high level of force rapidly (Chavda et al., 2023; Fry et al., 2006; Sorenson et al., 2022). For example, it was reported that the ability to generate large extensor muscle joint impulse (force × time) is an important factor in lifting heavier loads during the clean (Kipp & Harris, 2017). In addition, Haff et al. (2005) reported a high correlation (r = 0.80) between rate of force development (RFD) during the isometric mid-thigh pull (IMTP) with weightlifting total (sum of best snatch and clean and jerk) weight in elite female weightlifters.Furthermore,Sorensonet al. (2022) reported that the average resultant force of the weighting
phase(firstpull: theliftingofthebarbellfromthefloortoabout midthighposition)andaveragebarpowerfromthepointofliftofftopeak bar height showed high correlations (r ≥ 0.88) to weightlifting performance. In view of the strong relationship between force generation capability and weightlifting performance, it is therefore important to monitor the muscular strength of weightlifters, for coaches to better plan and evaluate their training program.
Isometric strength assessments have been gaining popularity as they are relatively simple to administer, pose minimal injury risk, have high test-retest reliability (Brady et al., 2020; Lum et al., 2020), are able to detect subtle changes in strength (e.g., change in RFD and early force development; Drake et al., 2018), and are considered less fatiguing than 1 repetition maximum (1RM) tests (Lum et al., 2020). Specifically, measures obtained from the IMTP, which requires the athlete to exert force against a
*Corresponding Author: Danny Lum, Singapore Sport Institute, Singapore, dannylum82@gmail.com
fixed bar while adopting the second pull position (the upward extension of the body to accelerate and elevate the barbell from about mid-thigh to the full extended position) of the clean, has been reported to behighlycorrelated to weightliftingperformance (r = 0.80 – 0.91) (Beckham et al., 2013; Ben-Zeev et al., 2022; Haff et al., 2005; Joffe et al., 2021). Significant correlations between IMTP RFD, early force development, and weightlifting performance has also been observed (r = 0.65 – 0.80; Beckham et al., 2013). Based on these findings, weightlifting coaches may use IMTP as an assessment tool to monitor the force generation capability of their athletes to monitor adaptations to training.
While the IMTP is a feasible option for monitoring weightlifting athletes, Ben-Zeev et al. (2022) and Joffe et al. (2021) reported higher correlations (r = 0.81 – 0.96) between isometric force and weightlifting performance when isometric peak force was obtained from the first pull position of clean (IFP) as compared to IMTP (r = 0.60 – 0.91). These findings support the suggestionthat isometricforcehas a strongerrelationship with a dynamic movement when the test is performed in the position where concentric force is initiated for that movement (Lum et al., 2020). Hence, this finding suggests that IFP serves as another option for weightlifting coaches to use for monitoring their athletes. However, despite the findings by Ben-Zeev et al. (2022) and Joffe et al. (2021), only Ben-Zeev et al. (2022) compared the relationship between RFD and early force development obtained from the IFP and IMTP with weightlifting performance. As rapid force production obtained during the IMTP (e.g., RFD and force at early time-points [i.e., 100-, 150-, 200-, 250-ms)]) has previously found to be an important determinant of weightlifting performance (Beckham et al., 2013; Haff et al., 2005), and there is a lack of data on rapid force development obtained from IFP, this warrants further investigation.
Although researchers have shown high correlation between weightlifting performance with measures of IFP and IMTP (Beckham et al., 2013; Ben-Zeev et al., 2022; Haff et al., 2005; Joffe et al., 2021), the researchers did not perform long-term monitoring of weightlifters’ performance using these two isometric strength assessments. Considering that the changes in dynamic and isometric strength performance were shown to be disproportional (James et al., 2023), it is likely that the correlation between weightlifting performance with measures of IFP and IMTP would changeovertime.Indeed,resultsfromapreviousstudyshowedthat the relationship between isometric strength measures and dynamic movementperformancemaychangeafteraperiodoftraining(Lum & Joseph, 2020). This outcome may also be observed for the relationship between weightlifting performance measures with IFP and IMTP measures, hence, altering the ability of IFP and IMTP force-time characteristics in predicting weightlifting performance. In view of this, the purpose of the study was to determine the relationship between weightlifting performance with force-time characteristics obtained from IFP and IMTP over several mesocycles.Inlinewithpreviousfindings, it was hypothesizedthat (1) weightlifting performance, as determined by the mean power and peak power during SN and CN at 85% of season best, would demonstrate stronger correlations with RFD and early force developmentobtainedfromIFPthanIMTP;and(2)therelationship between weightlifting performance with measures obtained from IFP and IMTP will be affected by the training that athletes undergo during each mesocycle
2. Methods
An observational repeated measures design was used to determine the relationships between the force-time characteristics of the IFP and IMTP with weightlifting performance including competition best snatch (SN) and clean (CN) at week 0, and peak power and mean power at 85% best SN and CN (based on their best clean and jerk load) in national male and female weightlifters over a period of 16 weeks. For each testing session, participants performed the IFP, IMTP, and SN and CN at 85% of their competition best. This intensity was selected to minimize any disruption to athletes’ training as they trained within this intensity most of the time. Participants performed three testing sessions in total at week 0, 8, and 16
2.1. Participants
Aconveniencesampleofsixmale(age:28.7±2.0years,bodymass: 73.2 ± 11.4 kg, height: 1.72 ± 0.05 m) and four female (age: 26.0 ± 1.4 years, body mass: 57.5 ± 3.7, height: 1.61 ± 0.04 m) weightliftersfromthenationaltrainingsquadwererecruitedforthis study.Inclusioncriteriaincluded:(1)18–35yearsold;(2)hadbeen participating in competitive weightlifting for more than 2 years; (3) is currently in the national training squad; and (4) was free from injuryatthepointofrecruitment.Studycommencedafterobtaining the approval from the institutional review board of the Singapore Sport Institute (SC-EXP-029). All participants were briefed on the procedure of the study and signed an informed consent form.
2.2. Procedure
Participants were asked to avoid the consumption of heavy meals 2 hours before each testing session. All testing sessions were conducted at similar time between sessions (within 1 hour) to avoid diurnal effect. To ensure that participants were able to perform at their best during each session, participants performed their individual competition warm up regime during each session. Participants performed the tests in the following order each separated by 5 minutes, IFP, IMTP, SN, and CN.
2.3.
Isometric strength tests
Both IFP and IMTP were performed on the dual force plates (Force Decks, VALD Performance, FD4000, Queensland, Australia) sampling at 1000 Hz. The commercially available ForceDecks software (VALD Performance, ForceDecks, Queensland, Australia) was used to analyze all force-time data obtained during the tests, using raw unfiltered data. For the IFP, participants were asked to adopt a posture that reflected the start of the first pull of a clean (Figure 1A). The bar height (22.2 cm off the ground) was based on the height of a weightlifting bar when loaded with standard weightlifting weight plates of 45 cm in diameter. Therefore, the body position of each participant varied slightly due to individual anthropometric and mobility characteristics. However, key technical criteria of the set-up position for the clean was followed (Joffe et al., 2021). This was visually inspected by the weightlifting coach prior to the commencement of the test. For the IMTP, participants adopted a posture that reflects the start of the second pull of the clean
resulting in a knee flexion angle of 125 – 145˚, and hip flexion angle of 140 – 150˚ (Comfort et al., 2019) (Figure 1B). A handheld goniometer was used to ensure that athletes adopt the required knee and hip angles and that these were replicated across testing sessions. For both tests, participants were required to hold on to the bar with elbows fully extended, using lifting straps to ensure that grip strength was not a limiting factor. Prior to each test, participants performed a3 s submaximalIFP orIMTP at50%, 70%, and 90% perceived maximal effort. Each repetition was separated by 60 s (Comfort et al., 2019).
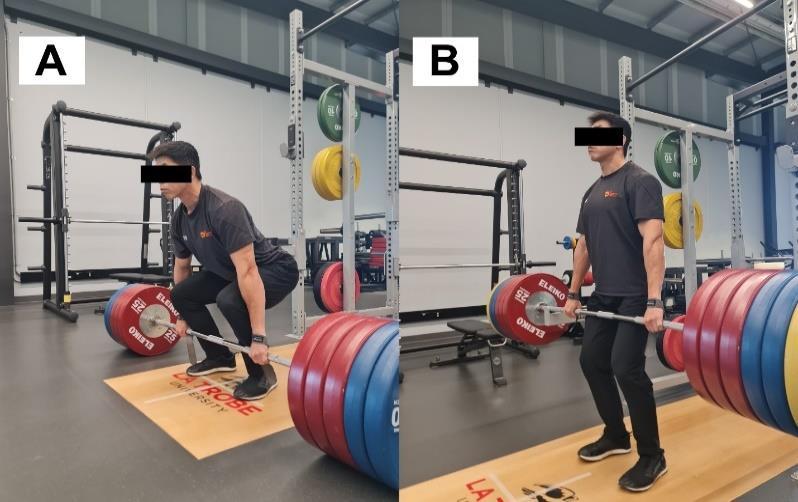
1: Posture adopted for (A) isometric first pull, and (B) isometric mid-thigh pull.
During the test, participants were asked to drive their feet into the ground “as fast and as hard possible” following a “3, 2, 1pull” countdown from the tester. During the first two attempts, participants maintained the tension for a period of 1 s with each repetition separated by 20 s (Guppy et al., 2022). Force at 100, 150, and 200 ms (Force100, Force150, and Force200, respectively) and mean rate of force development at 0-100, 0-150, 0-200 and 0250 ms (RFD0-100, RFD0-150, RFD0-200 and RFD0-250, respectively) from the onset of pull were determined for each trial. The average of the two trials were recorded and analyzed. Participants rested for 2 minutes before performing 2 more attempts in which they maintained the tension for a period of 5 s with acceptable trials demonstrating no countermovement and peak force between trials demonstrating a difference < 250 N. Each repetition was separated by 2 minutes (Comfort et al., 2019). The average of the peak force generated by the two trials was recorded and analyzed. The onset of pull was determined based on an increase of > 5 standard deviation (SD) of participants body mass during a period of quiet standing prior to the pull (Dos’ Santos et al., 2017). This setting is available in the ForceDecks software. A 20 kg stiff powerlifting barbell (Eleiko, Sweden) was used for all testing. The barbell was loaded with sufficient weight plates to ensure that participants were not able to move the bar.
2.4. Snatch and clean
The SN and CN performance were determined as the mean power (MP) and peak power (PP) obtained when lifting 85% of individual’s season’s best. The reason for using the using the
submaximal load is firstly, to avoid disruption to participants’ training, and the 85% load is a commonly used load during training. Secondly, assessing power output is suggested to be a good predictor of weightlifting performance (Garhammer, 1980; Garhammer, 1993). Specifically in the current study where the weight lifted was kept constant throughout the 16-week period, a higher power measured would indicate an improvement in performance. This would allow the athletes to be aware of their progression without the need to perform a maximal lift. During the SN and CN, participants began their build up to 85% of their season’s best by performing 3 repetitions at 40% and 50%, 2 repetitions at 60% and 70%, and 1 repetition at 80% of their season’s best. Each repetitionwas separated by 30 s and each load intensity by 3 min. Participants performed the 85% for two attempts, each separated by 3 min. A linear position transducer (LPT; GymAware, Kinetic Performance Technology, Canberra, Australia) was used to determine the peak and mean velocity of the barbell. The mean and peak power was determined as the instantaneous product between the net force applied to the barbell (i.e., barbell mass × vertical barbell acceleration, based on the displacement time data from the LPT) and vertical barbell mean and peak velocity. The average of both attempts was used for further analysis. Participants lifted the same testing load for SN and CN during subsequent testing sessions.
2.5. Statistical analyses
Statistical analysis was performed using the JASP version 0.18.3.0. All tested variables were expressed by Mean (± 1 SD). Within session test-retest reliability was assessed using two-way, mixed intraclass correlation coefficients (ICC) and coefficient of variation (%CV) for all measured variables. ICC values were deemed as poor, moderate, good, or excellent if lower bound 95% confidence interval (CI) of ICC values were < 0.50, 0.50 – 0.74, 0.75 – 0.90, or > 0.90, respectively (Koo & Li, 2016). Acceptable within-sessionvariabilitywas classifiedas≤ 10%(Cormacketal., 2008). All assumptions torunANOVA were checked beforehand, including normality and sphericity. A one-way ANOVA with Tukey post-hoc analysis was used to determine the differences in all variables measured at different time points (p ≤ 0.05). To reduce the incidence of bias due to the small sample size, Hedges’ g was computed, where the following descriptors were used: (i) trivial effect size if g < 0.20; (ii) small effect size if g = 0.20 –0.49; (iii) moderate effect size if g = 0.50 – 0.80; and (iv) large effect size if g > 0.80 (Cohen, 1988).
Pearson correlation coefficients (r) and the associated 95% CI was used to determine the interrelationships among isometric assessment and weightlifting performance measures. The strength of all correlations was interpreted using the following criteria: trivial (< 0.10), small (0.10 – 0.29), moderate (0.30 – 0.49), large (0.50 – 0.69), very large (0.70 – 0.90), or near perfect (> 0.90) (Hopkins et al., 2009). Fisher r-z transformation was performed to compare the magnitude of correlation between isometric assessment and weightlifting performance measures at different time points (Raghunathan et al., 1996).An apriori alpha levelwas set at p < 0.05, and p-values associated with the correlations were subsequently adjusted for familywise error rates, based on the multiple correlations (adjusted p = p ÷ 4).
3. Results
The reliability analysis of all measured variables is displayed in Table 1. Excellent reliability was observed for MP and PP obtained from SN and CN, as well as PF obtained from IFP and IMTP (ICC = 0.977 – 0.997, 95% CI = 0.933 – 1.00, %CV = 1.1 – 3.7, 95% CI = 0.9 – 5.2). Good reliability was observed for IFP Force50, Force200, RFD0-200, and RFD0-250, and IMTP Force50,
Force150, RFD0-200, and RFD0-250 (ICC = 0.852 – 0.939, 95% CI = 0.750 – 0.968, %CV = 5.2 – 7.1, 95% CI = 4.1 – 8.8). Moderate reliability was observed for IFP Force100 and Force150, and IMTP Force100 and Force200 (ICC = 0.783 – 0.847, 95% CI = 0.645 –0.918, %CV = 4.7 – 6.9, 95% CI = 3.7 – 9.6). The IFP and IMTP RFD0-50, RFD0-100,and RFD0-150 showed unacceptable %CV (ICC = 0.686 – 0.850, 95% CI = 0.509 – 0.919, %CV = 11.6 – 19.7, 95% CI = 9.0 – 28.3)
Table 1: Reliability analysis of snatch, clean, and isometric force measures.
Snatch
Notes: Bold font denotes good to excellent reliability. ICC = intraclass correlation, CI = confidence interval, CV = coefficient of variation, IFP = isometric first pull, IMTP = isometric mid-thigh pull, Force50 = force at 50 ms, Force100 = force at 100 ms, Force150 = force at 150 ms, Force200 = force at 200 ms, RFD0-50 = rate of force development from 0 to 50 ms, RFD0-100 = rate of force development from 0 to 100 ms, RFD0-150 = rate of force development from 0 to 150 ms, RFD0-200 = rate of force development from 0 to 200 ms, RFD0-250 = rate of force development from 0 to 250 ms
Measures obtained from snatch, clean, IFP, and IMTP across 16 weeks are displayed in Table 2. No significant difference between weeks was observed from all measured variables (p = 0.151 –0.975). At week 0, significant and near perfect correlations were observed between IFP and IMTP PF with snatch and clean PP and MP (r = 0.967 – 0.989, p < 0.001) (Table 3).
Significant and very large correlations were observed between IFP Force200, IFP RFD0-200 and RFD0-250 with snatch and clean PP and MP (r = 0.753 – 0.852, p = 0.006 – 0.010) (Table 3). At week 8, significantandnearperfectcorrelations wereobserved between IFP and IMTP PF with snatch and clean PP and MP (r = 0.966 –0.991, p <0.001)(Table4).Significantandverylargecorrelations
were observed between IFP Force50 and Force200 with snatch and clean PP and MP (r = 0.777 – 0.840, p = 0.002 – 0.008) (Table 4). At week 16, significant and near perfect correlations were observed between IFP and IMTP PF with snatch and clean PP and MP (r = 0.954 – 0.977, p < 0.001) (Table 5). Significant and very large correlations were observed between IFP Force50 and Force200 with snatch and clean PP and MP (r = 0.803 – 0.865, p = 0.002 –0.02) (Table 5). Fisher r-z transformation analysis showed no significant change in correlation magnitude between snatch and clean PP and MP with all isometric variables across 16 weeks (p = 0.053 – 0.497) (Supplementary Table 1 – 4).
Table 2: Snatch, clean and isometric test measures across 16 weeks expressed as mean (SD).
Snatch
(N) 1367.3 (194.9) 1370.7 (347.4) 1551.6 (273.5) 0.975
0.89]
1.65]
[-0.34, 1.45] Force200 (N) 1551.6 (273.5) 1601.4 (317.7) 1610.5 (428.5) 0.920 0.16 [-0.72, 1.04] 0.16 [-0.72, 1.03] 0.02 [-0.85, 0.9] RFD0-50 (N·s-1) 1869.9 (960.7) 2108.6 (1009.3) 2023.5 (1159.3) 0.875 0.23 [-0.65, 1.11] 0.14 [-0.74, 1.02] -0.07 [-0.95, 0.8]
RFD0-100 (N·s-1) 4187.2 (1736.8) 4433.5 (1752.8) 4192.6 (1981.1) 0.943 0.14 [-0.74, 1.01] 0.00 [-0.87, 0.88] -0.12 [-1, 0.75] RFD
-150 (N·s-1) 4229.1 (1107.7) 4628.3 (1389.9) 4397.8 (2072.0)
RFD0-200 (N·s-1) 4162.3 (1324.9)
RFD0-150 (N.s-1) 5975.5 (2318.4) 6833.5 (2613.3) 7989.1 (2372.5)
RFD0-200 (N·s-1) 6043.9 (1972.4) 6878.0 (2371.4) 7542.0 (1963.5) 0.299
RFD0-250 (N·s-1) 5652.5 (1618.8) 6358.6 (1841.6) 6519.6 (1703.3) 0.498 0.39 [-0.49, 1.27] 0.50 [-0.39, 1.39] 0.09 [-0.79, 0.96]
Notes: PP = peak power, MP = mean power, IFP = isometric first pull, PF = peak force, IMTP = isometric mid-thigh pull, Force50 = force at 50 ms, Force100 = force at 100 ms, Force150 = force at 150 ms, Force200 = force at 200 ms, RFD0-50 = rate of force development from 0 to 50 ms, RFD0-100 = rate of force development from 0 to 100 ms, RFD0-150 = rate of force development from 0 to 150 ms, RFD0-200 = rate of force development from 0 to 200 ms, RFD0-250 = rate of force development from 0 to 250 ms
Table 3: Correlation between snatch and clean power measures with isometric test measures at Week 0 expressed as r [95% CI]. Snatch PP
PF 0.983 [0.929, 0.996]** 0.987 [0.945, 0.997]**
Force50 0.293 [-0.413, 0.779] 0.254 [-0.447, 0.762]
Force100 0.371 [-0.338, 0.811] 0.405 [-0.302, 0.824]
[0.953, 0.998]** 0.985 [0.938, 0.997)**
[-0.405, 0.783] 0.318 [-0.390, 0.789]
[-0.268, 0.836] 0.427 [-0.277, 0.833]
Force150 0.611 [-0.030, 0.896] 0.618 [-0.019, 0.898] 0.654 [0.042, 0.909]* 0.651 [0.037, 0.908]*
Force200 0.793 [0.327, 0.949]* 0.792 [0.325, 0.949]* 0.815 [0.381, 0.955]* 0.813 [0.377, 0.954]*
RFD0-50 0.120 [-0.551, 0.967] 0.143 [-0.535, 0.709] 0.179 [-0.541, 0.727] 0.170 [-0.515, 0.722]
RFD0-100 0.049 [-0.602, 0.656] 0.118 [-0.552, 0.696] 0.134 [-0.541, 0.704] 0.110 [-0.558, 0.692]
RFD0-150 0.450 [-0.250, 0.841] 0.510 [-0.176, 0.863] 0.525 [-0.156, 0.868] 0.503 [-0.186, 0.860]
RFD0-200 0.753 [0.234, 0.938]* 0.768 [0.267, 0.942]* 0.776 [0.286, 0.944]** 0.767 [0.266, 0.942]*
RFD0-250 0.827 [0.412, 0.958]* 0.847 [0.466, 0.963]** 0.852 [0.480, 0.964]** 0.844 [0.458, 0.962]**
IMTP
PF
0.969 [0.869, 0.993]** 0.971 [0.880, 0.993]**
0.970 [0.873, 0.993]** 0.967 [0.862, 0.992]**
Force50 0.706 [0.137, 0.925] 0.738 [0.202, 0.934] 0.740 [0.207, 0.934] 0.731 [0.188, 0.932]
Force100 0.276 [-0.428, 0.772] 0.378 [-0.330, 0.814]
0.340 [-0.368, 0.799] 0.306 [-0.40, 0.785]
Force150 0.364 [-0.345, 0.808] 0.450 [-0.251, 0.841] 0.407 [-0.299, 0.825] 0.379 [-0.329, 0.814]
Force200 0.545 [-0.129, 0.875] 0.614 [-0.025, 0.897] 0.585 [-0.071, 0.888] 0.563 [-0.103, 0.880]
RFD0-50 0.139 [0.538, 0.707] 0.236 [-0.462, 0.754] 0.226 [-0.471, 0.749] 0.190 [-0.499, 0.732]
RFD0-100 -0.147 [0.532, 0.711] -0.040 [-0.653, 0.605] -0.081 [-0.676, 0.578] -0.119 [-0.696, 0.552]
RFD0-150 0.120 [-0.551, 0.697] 0.212 [-0.482, 0.742] 0.166 [-0.518, 0.720] 0.135 [-0.541, 0.705]
RFD0-200 0.358 [-0.350, 0.806] 0.431 [-0.273, 0.834] 0.399 [-0.307, 0.822] 0.375 [-0.334, 0.813]
RFD0-250 0.626 [0.006, 0.901] 0.676 [0.082, 0.916] 0.654 [0.041, 0.909] 0.637 [0.012, 0.904]
Notes: *p < 0.05. **p < 0.01. IFP = isometric first pull, IMTP = isometric mid-thigh pull, PF = peak force, Force50 = force at 50 ms, Force100 = force at 100 ms, Force150 = force at 150 ms, Force200 = force at 200 ms, RFD0-50 = rate of force development from 0 to 50 ms, RFD0-100 = rate of force development from 0 to 100 ms, RFD0-150 = rate of force development from 0 to 150 ms, RFD0-200 = rate of force development from 0 to 200 ms, RFD0250 = rate of force development from 0 to 250 ms
Table 4: Correlation between snatch and clean power measures with isometric test measures at Week 8 expressed as r (95%CI).
Snatch PP
IFP
PF
Snatch MP Clean PP Clean MP
0.982[0.924, 0.996]** 0.987 [0.944, 0.997]**
[0.960, 0.998]** 0.980 [0.914, 0.995]**
Force50 0.777 [0.289, 0.945]* 0.780 [0.295, 0.945]* 0.777 [0.288, 0.944]* 0.795 [0.332, 0.949]*
Force100 0.360 [-0.348, 0.807] 0.370 [-0.339, 0.811]
[-0.326, 0.815] 0.379 [-0.329, 0.814]
Force150 0.641 [0.019, 0.905] 0.646 [0.028, 0.907] 0.649 [0.033, 0.908] 0.653 [0.039, 0.909]
Force200 0.836 [0.436, 0.960]* 0.837 [0.439, 0.961]* 0.833 [0.429, 0.960]* 0.840 [0.446, 0.961]*
RFD0-50 0.178 [-0.509, 0.726] 0.184 [-0.504, 0.729]
0.202 [-0.490, 0.738] 0.217 [-0.478, 0.745]
RFD0-100 -0.129 [-0.702, 0.545] -0.120 [-0.697, 0.551] -0.101 [-0.687, 0.564] -0.111 [-0.692, 0.557]
RFD0-150 0.349 [-0.360, 0.802] 0.356 [-0.353, 0.805] 0.368 [-0.340, 0.810] 0.354 [0.354, 0.805]
RFD0-200 0.664 [0.059, 0.912]* 0.667 [0.063, 0.912]* 0.666 [0.063, 0.913]* 0.665 [0.061, 0.912]*
RFD0-250 0.739 [0.205, 0.934]* 0.741 [0.210, 0.935]* 0.744 [0.215, 0.935]* 0.740 [0.208, 0.934]*
IMTP
PF 0.970 [0.875, 0.993]** 0.976 [0.898, 0.994]** 0.979 [0.909, 0.995]** 0.966 [0.858, 0.992]**
Force50 0.638 [0.013, 0.904] 0.637 [0.013, 0.904] 0.633 [0.006, 0.903] 0.665 [0.061, 0.913]
Force100 0.336 [-0.373, 0.797] 0.339 [-0.369, 0.798] 0.341 [-0.367, 0.799] 0.356 [-0.353, 0.805]
Force150 0.417 [-0.289, 0.829] 0.420 [-0.285, 0.830] 0.424 [-0.281, 0.832] 0.422 [-0.282, 0.831]
Force200 0.605 [-0.039, 0.894] 0.606 [-0.038, 0.894] 0.611 [-0.031, 0.896] 0.614 [-0.026, 0.897]
RFD0-50 -0.096 [-0.684, 0.568] -0.095 [-0.684, 0.568] -0.094 [-0.683, 0.570] -0.068 [-0.669, 0.587]
RFD0-100 0.016 [-0.620, 0.639] 0.019 [-0.618, 0.641] 0.022 [-0.616, 0.643] 0.033 [-0.609, 0.649]
RFD0-150 0.185 [-0.503, 0.730] 0.189 [-0.500, 0.731] 0.194 [-0.496, 0.734] 0.187 [-0.502, 0.731]
RFD0-200 0.458 [-0.241, 0.844] 0.459 [-0.243, 0.844] 0.464 [-0.234, 0.846] 0.465 [-0.233, 0.847]
RFD0-250 0.670 [0.07, 0.914] 0.669 [0.068, 0.914] 0.673 [0.076, 0.915] 0.678 [0.084, 0.916]
Notes: *p < 0.05. **p < 0.01. IFP = isometric first pull, IMTP = isometric mid-thigh pull, PF = peak force, Force50 = force at 50 ms, Force100 = force at 100 ms, Force150 = force at 150 ms, Force200 = force at 200 ms, RFD0-50 = rate of force development from 0 to 50 ms, RFD0-100 = rate of force development from 0 to 100 ms, RFD0-150 = rate of force development from 0 to 150 ms, RFD0-200 = rate of force development from 0 to 200 ms, RFD0250 = rate of force development from 0 to 250 ms
Table 5: Correlation between snatch and clean power measures with isometric test measures at Week 16 expressed as r (95%CI).
Snatch PP
Snatch MP Clean PP Clean MP IFP
PF
0.954 [0.811, 0.989]** 0.965 [0.854, 0.992]** 0.973 [0.887, 0.994]** 0.965 [0.853, 0.992]**
Force50 0.803 [0.350, 0.952]* 0.811 [0.370, 0.954]* 0.825 [0.405, 0.957]* 0.844 [0.457, 0.962]*
Force100
0.586 [-0.069, 0.888] 0.618 [-0.019, 0.898] 0.644 [0.024, 0.906]* 0.638 [0.013, 0.904]*
Force150 0.563 [-0.103, 0.881] 0.587 [-0.067, 0.888] 0.613 [-0.026, 0.897] 0.628 [-0.003, 0.901]
Force200 0.824 [0.403, 0.957] * 0.839 [0.444, 0.961]* 0.856 [0.490, 0.965]* 0.865 [0.517, 0.968]*
RFD0-50 0.457 [-0.243, 0.844] 0.476 [-0.219, 0.851] 0.507 [-0.181, 0.861] 0.545 [-0.129, 0.874]
RFD0-100 0.142 [-0.535, 0.709] 0.177 [-0.509, 0.726] 0.203 [-0.489, 0.738] 0.192 [-0.498, 0.733]
RFD0-150 0.317 [-0.391, 0.789] 0.344 [-0.364, 0.800] 0.372 [-0.337, 0.811] 0.385 [-0.323, 0.817]
RFD0-200 0.714 [0.154, 0.927] 0.733 [0.191, 0.932] 0.752 [0.231, 0.938]* 0.761 [0.251, 0.940]*
RFD0-250 0.731 [0.188, 0.932] 0.750 [0.227, 0.937] 0.769 [0.270, 0.942]* 0.778 [0.291, 0.945]*
IMTP
PF 0.967 [0.863, 0.992]** 0.974 [0.890, 0.994]** 0.977 [0.903, 0.995]** 0.963 [0.847, 0.991]**
Force50 0.635 [0.008, 0.903] 0.635 [0.009, 0.904] 0.653 [0.040, 0.909] 0.691 [0.109, 0.920]
Force100 0.276 [-0.428, 0.772] 0.271 [-0.432, 0.770] 0.291 [-0.414, 0.778] 0.331 [-0.378, 0.795]
Force150 0.344 [-0.364, 0.800] 0.353 [-0.356, 0.804] 0.376 [-0.332, 0.813] 0.402 [-0.305, 0.823]
Force200 0.580 [-0.079, 0.886] 0.592 [-0.060, 0.890] 0.612 [-0.028, 0.896] 0.633 [0.006, 0.903]
RFD0-50 -0.256 [-0.763, 0.445] -0.266 [-0.767, 0.437] -0.246 [-0.758, 0.454] -0.198 [-0.736, 0.493]
RFD0-100 -0.180 [-0.727, 0.507] -0.188 [-0.731, 0.501] -0.171 [-0.723, 0.514] -0.137 [-0.706, 0.539]
RFD0-150 -0.048 [-0.658, 0.600] -0.044 [-0.656, 0.602] -0.024 [-0.644, 0.615] 0.048 [-0.629, 0.630]
RFD0-200 0.309 [-0.398, 0.786] 0.318 [-0.389, 0.790] 0.340 [-0.369, 0.798] 0.362 [-0.346, 0.808]
RFD0-250 0.561 [-0.106, 0.880] 0.572 [-0.090, 0.883] 0.591 [-0.062, 0.890] 0.608 [-0.035, 0.895]
Notes: *p < 0.05. **p < 0.01. IFP = isometric first pull, IMTP = isometric mid-thigh pull, PF = peak force, Force50 = force at 50 ms, Force100 = force at 100 ms, Force150 = force at 150 ms, Force200 = force at 200 ms, RFD0-50 = rate of force development from 0 to 50 ms, RFD0-100 = rate of force development from 0 to 100 ms, RFD0-150 = rate of force development from 0 to 150 ms, RFD0-200 = rate of force development from 0 to 200 ms, RFD0250 = rate of force development from 0 to 250 ms
4. Discussion
The purpose of the study was to determine the relationship between weightlifting performance with force-time characteristics obtained from IFP and IMTP over several mesocycles. The current results showed no significant difference in correlation magnitude of IFP and IMTP variables with PP or MP of the SN and CN. In addition, the correlation magnitude did not change significantly over a 16-week training period. Hence, our hypothesis was not supported. While it was not the primary purpose of the study to monitor the changes in both isometric strength measures and weightlifting performance across the 16week, the current results showed that there was no significant change in both isometric and weightlifting measures. Hence, the results were not able to affirm the findings of James et al. (2023) whoreportedthedisproportionate changesbetween isometricand dynamic strength measures.
Similar to the findings of Ben-Zeev et al. (2022) and Joffe et al. (2021), the current study showed significant correlation between PF obtained from IFP and IMTP with SN and CN performance (r = 0.954 – 0.989). However, while both previous studies reported greater correlation magnitude between weightlifting performance with IFP PF then with IMTP PF, the current results showed no difference. This contradiction was apparent throughout the 16 weeks. A possible reason could be the difference in the way weightlifting performance was measured. In both earlier studies, weightlifting performance was determined
by the highest amount of weight lifted during SN and CN, while the current study determined performance by the lifting velocity of SN and CN at 85% season best. Despite the difference in performance measures, all three studies were in agreement that PF obtained from both IFP and IMTP may provide insights into weightlifting performance.
TheRFDisoneoftheimportantdeterminantsofweightlifting performance(Beckhametal.,2013;Haffetal.,2005).Apartfrom the current study, Ben-Zeev et al. (2022) was the only one that compared the correlation between RFD obtained from both IFP and IMTP with weightlifting performance. Similar to the results presented by Ben-Zeev et al. (2022), the current results showed significant correlations between IFP RFD0-200 and RFD0-250 with SN and CN performance during week 0(r = 0.753 –0.852),while IFP RFD at other time point and IMTP RFD showed no significant or meaningful correlation to SN and CN performance (r = -0.040 – 0.740). However, although the correlation magnitude of IFP RFD0-200 and RFD0-250 with SN and CN performance did not change significantly at week 8 (r = 0.664 –0.744), they did not reach statistical significance after p-values were adjusted for familywise error rates. Furthermore, at week 16, IFP RFD0-200 and RFD0-250 were only significantly correlated to CN performance (r = 0.752 – 0.778). Nevertheless, the large to very large correlations between IFP RFD0-200 and RFD0-250 with SN and CN performance were observed across 16 weeks. These findings indicate that RFD within the 200 ms timeframe during the first pull of the weightlifting action may have greater
importance on the success of SN and CN performance than RFD at later phases of the lifts.
Interestingly, while IFP RFD0-50 showed no significant correlation to both SN and CN performance, IFP Force50 at week 8 and 16 showed significant and large correlations to all SN and CN measures (r = 0.777 – 0.844). One possible reason could be due to the poor reliability of the IFP RFD0-50 measure. Thus, resulting in low correlation to SN and CN. While this finding suggests that early force development may be a determinant of weightlifting performance, the IFP Force50 obtained during week 0 showed insignificant and small correlation with SN and CN performance. The reason for this observation is unknown as the data for IFP Force50 showed good reliability, and there was no major change in training program across the 16 weeks. Conversely, IFP Force200 was observed to have a very large and significant correlation with SN and CN performance across the 16 weeks (r = 0.792 – 0.865). This was consistent with the observationonIFPRFD0-200 andRFD0-250,thus,furtherindicating the importance of force development around the 200 ms timeframe on SN and CN performance. It has been observed that the duration of the first pull forboth SN and CN is around the 400 ms timeframe (Gourgoulis et al., 2000; Sorenson et al., 2022). Considering the short distance travelled with this period, weightlifters would need to have generated sufficient amount of force to overcome the inertial to lift the weight off the ground within the 200 ms timeframe. Hence, the significant correlation observed between IFP Force200, RFD0-200 and RFD0-250 with SN and CN performance observed.
Several limitations should be taken into consideration when interpreting the current results. Firstly, the weightlifting performance in this study was determined by the mean and peak power during SN and CN at 85% season’s best instead of a 1RM. This differs from the previous two studies by Ben-zeev et al. (2022) and Joeffe et al. (2021). Hence, direct comparison of data may not be accurate. However, the use of power measurement at submaximal load provides relevance to the daily training environment, and such measure has been determined to be agood predictor of weightlifting performance (Garhammer, 1993). Secondly, the current sample size of participants did not allow for subgroup comparison, although the sample size was limited by using the national training squad. Hence, future studies may consider filling this gap in the current literature.
In conclusion, the results of this study show that peak force in the first and second pull positions exhibit a near perfect correlation with weightlifting performance. Furthermore, the current findings also showed the importance of early force development and RFD at 200 ms at the first pull position on weightlifting performance The results of this study also suggest that the force generation capabilities at both first and second pull positions should be equally addressed during training.
Conflict of Interest
The authors declare no conflict of interest.
Acknowledgment
The authors would like to thank all participants for their participation in the study.
References
Beckham, G., Mizuguchi, S., Carter, C., Sato, K., Ramsey, M., Lamont, H., Hornsby, G., Haff, G., Stone, M. (2013). Relationships of isometric mid-thigh pull variables to weightlifting performance. Journal of Sports Medicine and PhysicalFitness, 53(5), 573–581.
Ben-Zeev, T., Sadres, E., & Hoffman, J. R. (2022). Comparison of force measures between start position, transition phase, and midthigh pull with weightlifting performance during israel national competition. Journal of Strength & Conditioning Research, 37(11), 2200–2205.
Brady, C. J., Harrison, A. J., & Comyns, T. M. (2020). A review of the reliability of biomechanical variables produced during the isometric mid-thigh pull and isometric squat and the reportingofnormativedata. Sportsbiomechanics,19(1),1–25.
Chavda, S., Comfort, P., Lake, J. P., Bishop, C., & Turner, A. N. (2023). Predicting weight category–specific performance zones for Olympic, World, and European Weightlifting Competitions. The Journal of Strength & Conditioning Research, 37(10), 2038–2045.
Cohen, J. (1988). Statistical power analysis for the behavioral sciences (2nd ed.). Hillsdale, Erlbaum.
Comfort. P., Dos’Santos, T., Beckham, G., Stone, M., Guppy, S., Haff, G. (2019). Standardization and methodological considerations for the isometric midthigh pull. Strength and Conditioning Journal, 41(2), 57–59.
Cormack, S. J., Newton, R. U., McGuigan, M. R., Doyle, T. L. A. (2008). Reliability of measures obtained during single and repeated countermovement jumps. International Journal of SportsPhysiology and Performance, 3(2), 131–144.
Dos' Santos, T., Jones, P. A., Comfort, P., Thomas, C. (2017). Effect of different onset thresholds on isometric midthigh pull force-time variables. Journal of Strength and Conditioning Research, 31(12), 3463–3473.
Drake, D., Kennedy, R., & Wallace, E. (2018). Familiarization, validity and smallest detectable difference of the isometric squat test in evaluating maximal strength. Journal of Sports Sciences, 36(18), 2087–2095.
Fry, A. C., Ciroslan, D., Fry, M. D., LeRoux, C. D., Schilling, B. K., Chiu, L. Z. (2006). Anthropometric and performance variables discriminating elite American junior men weightlifters. JournalofStrengthand Conditioning Research, 20(4), 861–866.
Garhammer, J. (1980). Power production by Olympic weightlifters. Medicine and Science in Sports and Exercise, 12(1), 54–60.
Garhammer, J. (1993). A review of power output studies of Olympic and powerlifting: Methodology, performance prediction, and evaluation tests. Journal of Strength & Conditioning Research, 7(2), 76–89.
Gourgoulis, V., Aggelousis, N., Mavromatis, G., & Garas, A. (2000). Three-dimensional kinematic analysis of the snatch of elite Greek weightlifters. Journal of Sports Sciences, 18(8), 643–652.
Guppy, S. N., Kotani, Y., Brady, C. J., Connolly, S., Comfort, P., & Haff, G. G. (2022). The reliability and magnitude of timedependent force-time characteristics during the isometric midthighpullareaffectedbybothtestingprotocolandanalysis
Lum et al. / The Journal of
and Exercise Science, Journal Vol. 9, Issue 1, 1-11 (2025)
choices. Journal of Strength and Conditioning Research, 36(5), 1191–1199.
Haff, G. G., Carlock, J. M., Hartman, M. J., & Kilgore, J. L. (2005). Force-time curve characteristics of dynamic and isometric muscle actions of elite women Olympic weightlifters. JournalofStrengthand Conditioning Research, 19(4), 741–748.
Hopkins, W. G., Marshall, S. W., Batterham, A. M., & Hanin, J. (2009). Progressive statistics for studies in sports medicine and exercise science. Medicine & Science in Sports & Exercise, 41(1), 3–13.
James, L. P., Weakley, J., Comfort, P., & Huynh, M. (2023). The relationship between isometric and dynamic strength following resistance training: a systematic review, metaanalysis, and level of agreement. International Journal of SportsPhysiology and Performance, 19(1), 2–12.
Joffe, S. A., Phil, P., & Jamie, T. (2021). Maximal isometric force in the start of the first pull exhibits greater correlations with weightlifting performance than in the mid-thigh position in national and international weightlifters. Journal of Sport and ExerciseScience, 5(3), 202–211.
Kipp, K., & Harris, C. (2017). Muscle-specific effective mechanical advantage and joint impulse in weightlifting. Journal of Strength & Conditioning Research, 31(7), 1905–1910.
Koo, T. K., Li, M. Y. (2016). A guideline of selecting and reporting intraclass correlation coefficients for reliability research. JournalofChiropracticMedicine, 15(2), 155–163.
Lum, D., Haff, G. G., & Barbosa, T. M. (2020). The relationship between isometric force-time characteristics and dynamic performance: A systematic review. Sports, 8(5), 1–32.
Lum, D., & Joseph, R. (2020). Relationship between isometric force-time characteristics and dynamic performance pre-and post-training. The Journal of Sports Medicine and Physical Fitness, 60(4), 520–526.
Raghunathan, T. E., Rosenthal, R., & Rubin, D. B. (1996). Comparing correlated but nonoverlapping correlations. PsychologicalMethods, 1(2), 178–183.
Sorensen, A. M., Chavda, S., Comfort, P., Lake, J., & Turner, A. N. (2022). Intra-and interday reliability of weightlifting variables and correlation to performance during cleans Journal of Strength & Conditioning Research, 36(11), 3008–3014.
Supplementary Table 1: Comparison of correlations to snatch peak power (p).
0 vs 8
0 vs 16
Notes: IFP = isometric first pull, IMTP = isometric mid-thigh pull, PF = peak force, Force50 = force at 50 ms, Force100 = force at 100 ms, Force150 = force at 150 ms, Force200 = force at 200 ms, RFD0-50 = rate of force development from 0 to 50 ms, RFD0-100 = rate of force development from 0 to 100 ms, RFD0-150 =rateofforcedevelopment from0to150ms, RFD0-200 =rateof forcedevelopmentfrom0 to200 ms, RFD0-250 =rateofforcedevelopment from 0 to 250 ms
Supplementary Table 2: Comparison of correlations to snatch mean power (p).
Notes: IFP = isometric first pull, IMTP = isometric mid-thigh pull, PF = peak force, Force50 = force at 50 ms, Force100 = force at 100 ms, Force150 = force at 150 ms, Force200 = force at 200 ms, RFD0-50 = rate of force development from 0 to 50 ms, RFD0-100 = rate of force development from 0 to 100 ms, RFD0-150 = rate of force development from 0 to 150 ms, RFD0-200 = rate of force development from 0 to 200 ms, RFD0-250 = rate of force development from 0 to 250 ms.
Supplementary Table 3: Comparison of correlations to clean peak power (p-value).
Week 0 vs 8
Week 0 vs 16 Week 8 vs 16
Notes: IFP = isometric first pull, IMTP = isometric mid-thigh pull, PF = peak force, Force50 = force at 50 ms, Force100 = force at 100 ms, Force150 = force at 150 ms, Force200 = force at 200 ms, RFD0-50 = rate of force development from 0 to 50 ms, RFD0-100 = rate of force development from 0 to 100 ms, RFD0-150 = rate of force development from 0 to 150 ms, RFD0-200 = rate of force development from 0 to 200 ms, RFD0-250 = rate of force development from 0 to 250 ms.
Supplementary Table 4: Comparison of correlations to clean mean power (p-value).
Notes: IFP = isometric first pull, IMTP = isometric mid-thigh pull, PF = peak force, Force50 = force at 50 ms, Force100 = force at 100 ms, Force150 = force at 150 ms, Force200 = force at 200 ms, RFD0-50 = rate of force development from 0 to 50 ms, RFD0-100 = rate of force development from 0 to 100 ms, RFD0-150 = rate of force development from 0 to 150 ms, RFD0-200 = rate of force development from 0 to 200 ms, RFD0-250 = rate of force development from 0 to 250 ms
The Journal ofSport and Exercise Science, Vol. 9, Issue 1, 12-20 (2025)
www.jses.net
A
cross-sectional assessment of the Omega-3 Index in an Australian cohort of elite rugby football athletes: Opportunities to address nutritional omega-3 intake
Gregory E.
Peoples1* , Ryan Anthony2 ,
Eliza Freney
3 , Nicola
Jaffrey
4, Stephanie Cronin5, Michael J. Macartney6
1Graduate School of Medicine, University of Wollongong, Australia
2Graduate School of Medicine, University of Wollongong, Australia
3Rugby Australia, Australia
4St George-Illawarra Dragons, Australia
5Rugby Australia, Australia
6Graduate School of Medicine, University of Wollongong, Australia
A R T I C L E I N F O A B S T R A C T
Received: 25.11.2024
Accepted: 01.04.2025
Online: 15.05.2025
Keywords:
Omega-3 Index
Long chain omega-3 fatty acids
Eicosapentaenoic acid
Docosahexaenoic acid
Rugby football
Elite athletes
Rugby football athletes endure unique physiological strain including high intensity contacts. Long chain omega-3 polyunsaturated fatty acids (LCn-3PUFA), eicosapentaenoic acid (EPA) and docosahexaenoic acid (DHA) are incorporated into cell membranes and optimise cell durability. However, it is unclear whether elite rugby football athletes consume enough EPA and DHA to optimise their omega-3 status. This study evaluated omega-3 biomarker status (Omega-3 Index [O3I]; sum of erythrocyte EPA% + DHA%) and principal LCn-3PUFA dietary habits of elite athletes (n = 100; 54% female; mean age 25 years; 95% CI [24, 26]; mean body mass 89 kg; 95% CI [86, 93]) in a cohort of Rugby Australia (RA) and National Rugby League (NRL). At the start of their competition cycle, 47 RA (64% female) and 53 NRL (45% female) athletes had their whole blood collected using a finger prick method and analysed to produce a fatty acid profile. At the same time, n = 96 of these athletes completed a nutritional omega-3 survey. The mean cohort O3I was 5.38% (95% CI [5.15, 5.60]; optimal > 8%) and arachidonicacid(AA)toEPAratio(AA/EPA)was13.21 (95%CI[12.28,14.14];optimal < 11). There was no association of rugby code on the sum of the major classes of fatty acids. The male athletes’ O3I was significantly higher (6.06%; 95% CI [5.89, 6.23] vs. 4.79%; 95% CI [4.56, 5.02]; p < 0.001) and AA:EPA was significantly lower (11.44; 95% CI [1.48, 21.40] vs. 14.90; 95% CI [14.76, 15.04]; p = 0.001) than the females, respectively. Australian rugby athletes who self-reported EPA + DHA intake above 500 mg / day were observed to have a significantly elevated O3I. Notwithstanding, given that only two athletes returned an O3I > 8%, there are opportunities for sports dietitians to address nutritional LCn-3PUFA intake in this cohort.
1. Introduction
Performance nutrition strategies for elite rugby football athletes typically aim to meet energy needs, considering seasonal and positional demands. Of particular interest, the dietary fat intake
of elite players has been reported to be 38–40% of energy intake (Black et al., 2019). However, the profile of dietary fat including the proportions of saturated, monounsaturated and polyunsaturated fatty acids is complex and extends beyond simplistic provision of energy. In the last decade, a discussion
*Corresponding Author: Gregory E Peoples, Graduate School of Medicine, University of Wollongong, Australia, peoples@uow.edu.au
has emerged as to the role of long chain omega-3 polyunsaturated fatty acids (LCn-3PUFA) intake in athletic populations (Lewis et al., 2020), especially eicosapentaenoic acid (EPA) and docosahexaenoic acid (DHA) in ‘physically trained’ cohorts according to dose, duration and physiological outcomes (Anthony, et al., 2024b; Anthony et al., 2021). For athletes in general, LCn-3PUFA have been listed as a potential benefit in terms of ‘supporting’ effective training and competition (Rawson et al., 2018) although the vast majority of research on this topic has not included elite athletes (Thielecke & Blannin, 2020). Nonetheless, in the case of elite contact sport, supplementing with high doses of combined DHA and EPA has been reported to reduce exercising heart rate of Australian Football League athletes (Buckley et al., 2009), alleviate muscle soreness of rugby union athletes (Black et al., 2018) and attenuate the seasonal brain inflammation markers of college football players (Heileson et al., 2021; Heileson et al., 2024). These observations support a theory of multi-cellular nutritional preconditioning for physiological strain, especially in the context of recovery such as delayed onset muscle soreness (Anthony et al., 2021).
Nutritional intake of preformed EPA and DHA is the most effective way of increasing cell membrane incorporation in the context of physical training (Peoples & McLennan, 2016). Yet, athletes generally exhibit low to moderate levels of membrane EPA and DHA, as measured via a blood biomarker known as the Omega-3 Index (O3I) (Harris & Polreis, 2016). The O3I is derived from a measurement of the erythrocyte membrane phospholipid content and specifically the relative quantification of EPA and DHA that comprise the bilipid layer. An ideal target of > 8% based on cardiovascular outcomes is also reflective of consistent LCn-3PUFA intake (Harris, 2010) and therefore also relevant in cohorts such as athletes to describe and affirm membrane incorporation (Anthony, et al., 2024b). In practice, a recent study reported only 15% of North American college football athletes regularly use LCn-3PUFA supplements, resulting in low O3I levels in this cohort (Ritz et al., 2020). Earlier studies confirm this tendency, with only 33% of male and 20% of female athletes having adequate LCn-3PUFA intake, leading to generally low overall O3I in these North American centric groups (Wilson & Madrigal, 2016). In fact, specific to this current study, a Canadian Rugby 7s squad was reported to have a group mean O3I < 5% (Armstrong et al., 2021) and therefore deemed to be below the daily recommendations for LCn-3PUFA intake for healthy adults (~500 mg / day EPA + DHA; Vannice & Rasmussen, 2014). In turn, Armstrong et al. (2021) also reported an elevated whole blood arachidonic acid (AA) to EPA ratio (AA/EPA), which is a marker of inflammation potential and ideally should be < 11. Excessively high AA/EPA has also been previously reported in a cohort of college NFL athletes by Larkin et al. (2024), which was underpinned by a combination of elevated whole blood AA (omega-6) and low EPA (Larkin et al., 2024).
Australia is also categorised with a population O3I range from 4–6% (Schuchardt et al., 2024) and therefore indicative of partially meeting recommendations, such as the European Food Safety Authority, of a minimum 250 mg of DHA per day (European Food Safety Authority, 2012). Reflecting the disperse range of current guidelines, the population level intake is more likely equivalent to the Australian and New Zealand adequate
intake (medium) values for summed EPA, DHA and docosapentaenoic acid (DPA) which is 90 mg / day for females and 160 mg /day for males (National Health and Medical Research Council, 2006). In contrast, the International Olympic Committee has previously recommended 2000 mg per day of ‘omega-3 fatty acids’, which may be interpreted to includealphalinoleic acid (ALA) alongside EPA and DHA (Maughan et al., 2018). Notably, there are limited Australian studies describing the omega-3 status of young, healthy and physically active individuals (Sullivan et al., 2006) and include a cohort of Australian military recruits that returned a mean O3I between 5–6% (Peoples et al., 2022). Furthermore, there is currentlyonly one Australian study of elite male Australian Rules Football athletes, published more than a decadeearlier, that also reported avery low meanO3Iof3.6%(Buckleyetal.,2009).Itisthereforereasonable to hypothesise that an elite rugby professional football cohort, including both males and females, residing in Australia would also have an O3I reflective of a low LCn-3PUFA intake, but with a scarcity of O3I data of elite athletes residing in Australia, this has yet to be confirmed.
While these findings highlight a suboptimal omega-3 status in athletes of both sexes, the increasing participation and professional opportunities for female athletes in elite rugby football reaffirm that understanding the intake LCn-3PUFA should have equal representation of males and females. Importantly, the dose (or intake) of LCn-3PUFA explains 68% of the final O3I status in response to an omega-3 supplement containing EPA and DHA. In contrast sex, body mass, baseline O3I, age and physical activity together account for 10% of the O3I response to an LCn-3PUFA intervention (Flock et al., 2013). Certainly, body mass is likely to be lower on average in female rugby athletes compared to their male equivalents, and this would in theory favour females to be higher in omega-3 status, for the same given nutritional exposure or intake of LCn-3PUFA. Notwithstanding this theoretical advantage, it is predicted that usual intake over the longer period (whole food or supplement) will be the primary determinant of difference and not sex or anthropometry per se and this may indeed result in differences between males and females depending on their performance environment. The second objective of this study was to consequently have an equal and equivalent representation of male and female rugby football athletes with the aim of being able to describe both the sexes.
Therefore, this cross-sectional study of elite professional rugby athletes in Australia, aimed to evaluate the O3I which is indicative of sustained EPA and DHA intake and therefore membrane incorporation of these LCn-3PUFAs. As this cohort resided in Australia, it was hypothesised that their overall omega-3 status would be reflective of the background population with only a minority of the athletes achieving an O3I > 8% and furthermore there would be no difference between the males and females.
2. Methods
2.1. Study design and participants
The study was a cross-sectional design completed during 2023. The volunteer participants were professional athletes as part of
Rugby Australia (RA) and the National Rugby League (NRL), which represented the national and international status of the playing group. Male and female athletes were recruited from within their training environment, prior to or just at the commencement of their competition period specific to their team. The study details were presented to the entire squads with exclusion criteria set for those that were currently not competing due to injury. The study was reviewed and approved by the University of Wollongong Human Research Ethics Committee (HE_2023/147) and was conducted in accordance with the Declaration of Helsinki. Accordingly, each participant provided informed written consent.
2.2. Fatty acid profile and Omega-3 Index
Each athlete provided a blood sample (non-fasted) using the finger prick method. They were instructed not to consume any form of omega-3 supplement on the day of blood collection. A drop of blood was spotted onto the commercially available collection card for independent analysis (Fatty Acid Labs, Victoria, Australia). Each fatty acid in this whole blood sample was individually identified using high quality standards and then described as a relative percentage (%) of all the fatty acids. The O3I, a marker of heart muscle, skeletal muscle and brain membrane incorporation, was then calculated according to a validated algorithm (r = 0.96) (Harris & Polreis, 2016). Furthermore, the AA/EPA ratio was calculated from whole blood, with the premise of reducing this ratio to < 11 and in turn the production of inflammatory prostanoids (Wada et al., 2007), most commonly linked to reduced systemic inflammation (Rupp et al., 2004).
2.3. Diet survey
Each athlete was asked to independently respond to several questions regarding usual LCn-3PUFA intake in the 3 months prior to the blood sample. These survey questions were sent directly the participant using and electronic survey tool (REDcap, project-redcap.org) to limit influence from performance team expectations. These were derived from a previously validated Australian survey (Dickinson et al., 2015) and consisted of two components which sought to capture LCn3PUFA intake from; (i) dietary supplementation, and (ii) dietary food intake. The first component on supplement intake included additional questions on supplement brand, duration of supplementation, frequency of consumption and quantity consumed. From these questions, a daily intake of mg EPA + DHA was calculated. The second component on dietary food intake asked about how many portions of fish were consumed per week and included a follow up question on most common type of fish consumed (multiple selections were allowed). The EPA + DHA content of each serve (85 g) of fish type was obtained from the Australian Food Composition Database. Where multiple fish types were selected by participants, the EPA + DHA content was averaged. Finally, the total daily intake of mg EPA + DHA from supplementation and food intake was determined for each participant.
2.4. Statistical analysis
It was determined that a total sample size of n = 32 would allow comparison based upon equal representation of rugby code and sex (50/50), whereby a minimum detectable difference in the O3I of 2.0% (population mean O3I = 4.8%; SD = 1.0%) would be detectable (power calculation0.80; p <0.05). Atwo-way repeated measures analysis of variance (ANOVA) was used, with sex (male, female) and code (NRL, RA) main effects, and sex × code interaction (α = 0.05; Prism 10.3, GraphPad). Where a significant interaction was established, a post hoc Tukey analysis was conducted for comparisons of individual means.
The relationship between EPA + DHA intake (mg/d) and blood fatty acid levels were analysed categorically and continuously by simple linear regression. Self-reported intake categories were defined as; (i) < 100 mg/d; (ii) 100–500 mg/d and (iii) > 500 mg/d, corresponding to common descriptions of (i) not meeting the Australian Adequate Intake (medium) recommendations (National Health and Medical Research Council, 2006); (ii) meeting the Australian Adequate Intake (medium) recommendations but not exceeding the Academy of Nutrition and Dietetics (Vannice & Rasmussen, 2014) and (iii) exceeding recommendations for healthy adults proposed by most authoritative bodies, including Academy of Nutrition and Dietetics. A one-way ANOVA was used for categorical analysis (α = 0.05). Where a significant difference was established, a post hoc Tukey analysis was conducted for comparisons of individual means. Data are reported as means (95% confidence intervals).
3. Results
3.1. Participants
A total of 100 athletes (NRL, n = 53, 45% female; RA, n = 47, 64% female) were recruited (90% recruitment rate) into the study and included in the analysis. There was no difference in the age of the male (25 years; 95% CI [24, 26]) and the female participants (24 years; 95% CI [23, 25]), p = 0.324. However, the males were heavier in body mass (103 kg; 95% CI [100, 106]) compared to the females (78 kg; 95% CI [75, 81], p < 0.001.
3.2. Fatty acid profile and Omega-3 Index
The combined cohort O3I mean was 5.38% (95% CI [5.15, 5.60]) and the median O3I was 5.16% (95% CI [4.92, 5.51]). In addition, the whole blood mean and median AA:EPA ratio was 13.21 (95% CI [12.28, 14.14]) and 13.50 (95% CI [11.60, 14.40]), respectively. Independent of sex, there were no significant differences between rugby codes for O3I (NRL 5.58%; 95% CI [5.20, 5.76] vs. RA 5.25%; 95% CI [4.90, 5.61], p = 0.983) or AA/EPA ratio (NRL 12.57; 95% CI [11.34, 13.80] vs. RA 13.94; 95% CI [12.51, 15.37], p =0.375) Notably, only two athletes (2%) in the entire cohort returned anO3I above 8%. In terms of specific individual fatty acids, a main effect of sex was evident for linoleic acid(LA),AA,alpha-linolenicacid(ALA),EPAandDHA(Table 1). As a consequence, this main effect of sex included the total sum of omega-6 and omega-3 fatty acids but not saturated fatty acids or monounsaturated fatty acids (Table 1)
Table 1: Whole blood fatty acids (abbreviation, chemicalnotation) of National Rugby League (n = 53, 45% female) and Rugby Australia (n = 47, 64% female) athletes according to sex.
National Rugby League
Rugby Australia
Omega-6 fatty acids
acid (LA, 18:2n6)
[33.19, 35.14]
Arachidonic acid (AA, 20:4n6) 9.25 [8.90, 9.61] 8.88 [8.33, 9.43] 9.98 [9.06, 10.91] 9.19 [8.79, 9.59] 0.024
[6.22,
Omega-3 ratio 5.30 [5.00, 5.61] 6.93 [6.46, 7.40] 5.68 [5.02, 6.33] 6.99 [6.70, 7.28] <
With rugby codes combined, male athletes had a significantly higher O3I compared to female athletes (male, 6.06%; 95% CI [5.89, 6.23]; female, 4.79%; 95% CI [4.56, 5.02], p < 0.001) and the male athletes had a significantly lower AA/EPA ratio compared to female athletes (male, 11.44; 95% CI [1.48, 21.40]; female, 14.90; 95% CI [14.76, 15.04], p = 0.001) (Figure 1).
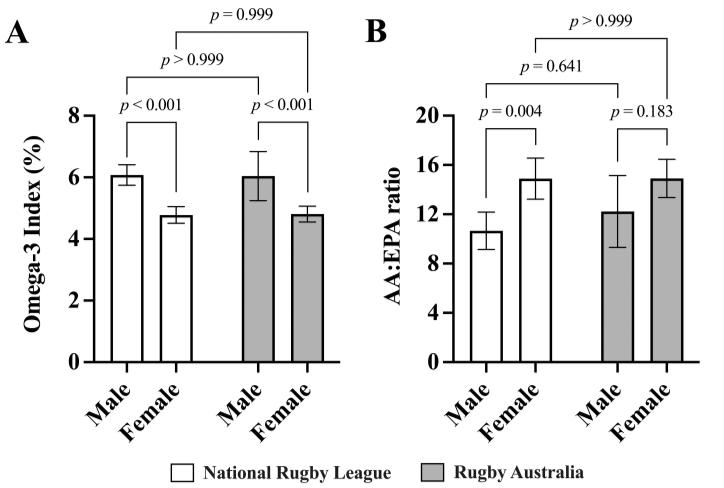
Figure 1: The Omega-3 Index (A) and whole blood Arachidonic acid to Eicosapentaenoic acid (AA/EPA) ratio (B) of elite National Rugby League (n = 53; 45% female) and Rugby Australia (n = 47; 64% female) athletes. Two-way repeatedmeasures ANOVA (corrected for multiple comparisons using the Tukey procedure). Bar graphs represent means. Error bars indicate the upper and lower limits of the 95% confidence intervals (CI).
3.3. Self-reported omega-3 intakeand supplement use
Four participants did not successfully complete the omega-3 intake survey, resulting in n = 96 (56% female) for self-reported analysis. During the 3 months prior to the blood sample, 36% of male athletes and 28% of female athletes self-reported consuming fish on a weekly basis, whereas 74% of male athletes and 4% of female athletes self-reported consuming an omega-3 supplement, also on a weekly basis.
Self-reported EPA + DHA intake (mg/d) was correlated with O3I (R2 = 0.458, p < 0.001), whole blood EPA % (R2 = 0.463, p < 0.001) and whole blood DHA % (R2 = 0.353, p < 0.001), but not with whole blood AA % (R2 = 0.005, p = 0.513). Independent of rugby code, the self-reported daily intake of LCn-3PUFA (median, inter-quartile range [IQR]) was higher in males (median = 493 mg/day; IQR = 343,1095) compared to females (median = 18 mg / day; IQR = 1,180) (p < 0.001). When blood values were compared to self-reported intake according to recommendation categories, there were no significant differences between the < 100 mg/d (n = 42) and 100–500 mg/d (n = 30) categories for any fatty acid (Figure 2). O3I, whole blood EPA % and whole blood DHA % were significantly higher in the > 500 mg/d (n = 24) category compared to < 100 mg/d and 100–500 mg/d (Figure 2). There were no differences in whole blood AA across any of the intake categories.
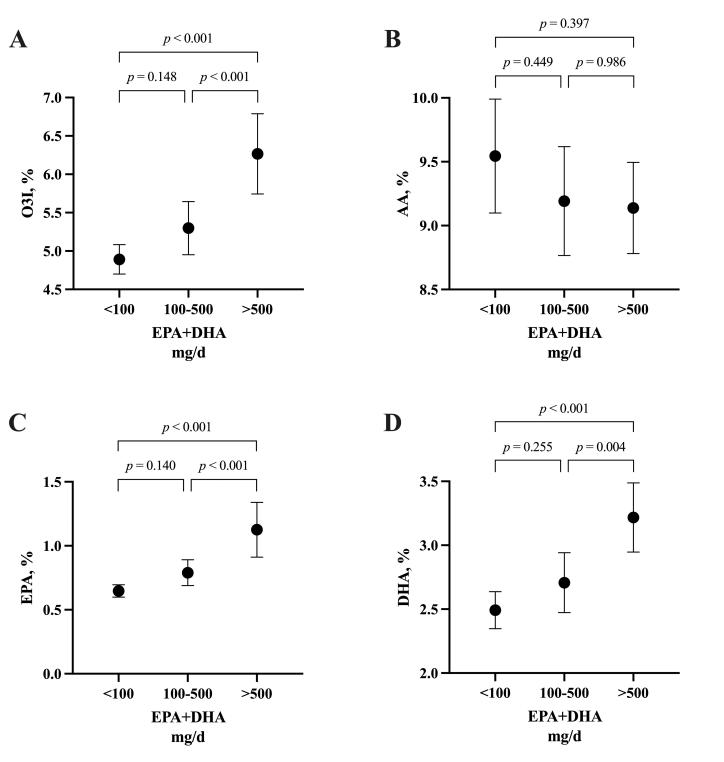
Figure 2: The Omega-3 Index (A) and Arachidonic acid (B), Eicosapentaenoic acid (C) and Docosahexaenoic acid (D) according to self-reported EPA+DHA intake categories (< 100 mg/day; n = 42, 100–500 mg/day; n = 30, > 500 mg/day; n = 24) from a total of n = 96 elite National Rugby League and Rugby Australia athletes. One-way ANOVA (corrected for multiple comparisons using the Tukey procedure). Filled dots represent means. Error bars indicate the upper and lower limits of the 95% confidence intervals (CI).
4. Discussion
This is the first observational study to describe the omega-3 status of Australian elite rugby football athletes which included an equivalent representative sample of female players. The fatty acid profile of this cohort was representative of the LCn-3PUFA dietary intake in the 3 months to when blood sampling took place at the commencement of their competition cycle. There were several key themes to emerge from this cross-sectional study that are contextually important for physiological durability and health requirements of these contact sport athletes.
Regardless of rugby football code, this study revealed that these elite Australian athletes had a suboptimal O3I of 5.38% (mean) and 5.16% (median) where the recognised target, in terms of cardiac tissue is > 8% (Harris, 2010) and also indicative of consistent LCn-3PUFA intake over the long term (Anthony et al., 2024b).
In line with our first hypothesis, it was clear from the O3I biomarker that only a small proportion of these professional athletes were consuming LCn-3PUFA as recommended by Academy of Nutrition and Dietetics (Vannice & Rasmussen, 2014). Notwithstanding, the Australian and New Zealand adequate intake values for summed EPA, DHA and docosapentaenoic acid (DPA) is much lower at 90 mg / day for
females and 160 mg /day for males (National Health and Medical Research Council, 2006) and likely explains why the O3I is low across the Australian population (Schuchardt et al., 2024).
Indeed, there is minimal athlete specific advice, such as the International Olympic Committee generalised recommendations for 2000 mg per day of ‘omega-3 fatty acids’, which may be interpreted to also include alpha-linoleic acid (ALA) alongside EPA and DHA (Maughan et al., 2018). Certainly, only a small proportion (~5%) of this rugby cohort self-reported LCn-3PUFA intake in excess of 2,500 mg per day, and none were above 3000 mg per day maximum intake, as recommended by the Australian and New Zealand adequate intake guidelines meaning that all athletes were well below the European Food Safety Authority (5000 mg per day) (European Food Safety Authority, 2012).
Studiesofeliteathletes,priortofishoilordietaryintervention, are limited but consistently demonstrate a similar mean O3I of between 4–5% in North American Collegiate Athletes (Anzalone et al., 2019; Drobnic et al., 2017; Ritz et al., 2020) and a smaller sample of Canadian national level rugby 7s players (Armstrong et al., 2021). The present study, in an Australian sample of rugby football athletes, also demonstrated similar O3I distribution (independent of sex) albeit with the mean and median O3I now above 5%. Notably, only two athletes had an O3I above 8%, the well-recognised cardioprotective threshold (Harris & von Schacky, 2004) and indicative of elevated incorporation of LCn3PUFA across tissues such as skeletal muscle in animal (Macartney et al., 2019) and human (McGlory et al., 2014). This distribution of theO3I was reflective of the original German study of O3I scores in elite winter sport athletes where only one athlete achieved an O3I of > 8%. In our current study, this achievement of > 8% was ascribed to self-reported supplemental intake of fish oil supplements by these two individuals, on a near daily basis. At the lower end of this rugby football cohort the O3I was reflective of a minimal intake of LCn-3PUFA via the diet. This is in line with athletes who follow a vegan diet which ultimately eliminates all intake of animal seafoods and results in low O3I scores (Craddock et al., 2022). Low LCn-3PUFA intake minimises the potential of skeletal muscle and cardiac DHA incorporation (Macartney etal.,2019),whereastheprovisionofthesefattyacids is demonstrated (via biopsy) to elevate LCn-3PUFA in human skeletal muscle (McGlory et al., 2014).
Contrary to our second hypothesis, a significant group effect of sex was observed whereby the female athletes, independent of rugby football code, presented with a lower O3I and higher AA/EPA ratio compared to male athletes. Noteworthy, was also the observation that the females in the current study were higher for the precursor fatty acids LA and ALA but lower in AA, EPA and DHA compared to their male counterparts. Previous studies in elite male and female athletes reported no sex differences (Drobnic et al., 2017; Ritz et al., 2020) including the study of the National Canadian Rugby 7s athletes (Armstrong et al., 2021). Females are reported to have higher rates of enzymatic desaturation compared to males (Decsi & Kennedy, 2011), which in combination with lower body size, as confirmed in our current study, may eventually result in different recommendations for LCn-3PUFA intake. Nevertheless, this potential for elevated EPA and DHA status was not observed in our cohort of elite female contact sportathletes fromrugby football,rathertheopposite. The most obvious reason would lie with the more powerful impact of nutritional intake of these specific fatty acids, especially EPA and
DHA (Flock et al., 2013) and the low conversion rate of LA and ALA with sex only explaining 2% of the plasma DHA difference between men andwomen (Decsi & Kennedy, 2011). Itwouldthen make sense that the environment for the intake of LCn-3PUFA, via whole foods and supplements, is the more likely explanation for our observations in this study, as supported by the very low self-reported medium intake in our female cohort, although should now be followed up with precise dietary analysis in these athlete cohorts. Although speculative, this may even be related to the differential allocation of support structures between male and female teams, even at this professional level of sport.
Notwithstanding, the overall sex differences for the O3I and the AA/EPA in the present study, we would argue, is more likely in part to the provision of, and access to fish oil supplements in these elite male team environments, which accounts for 68% of the variability in O3I elevation (Flock et al., 2013). In fact, we observed that 74% of male athletes self-reported consuming an omega-3 supplement on a weekly basis compared to only 4% of female athletes. In terms of whole foods, the proportion of males reporting some form of dietary fish intake during a usual week was also higher, with their intake of tinned tuna usually selfascribed to the primary purpose of protein consumption (reported anecdotally to the authors). In combination, supplement access and food sources went some way to explaining the medium intake differences between the males and females in this cohort. A similar low intake of supplemental EPA and DHA was recently reported in a small cohort female soccer players, also accounting for their relatively low omega-3 status (Hooks et al., 2023). Furthermore, elite female athletes also experience breaks in their career for birthing and raising children, and during this time the importance of DHA is well recognised as a critical fatty acid for bothmotherandthedevelopingbaby(Vafaietal.,2023),meaning that a returning female athlete may be more susceptible to very low omega-3 status unless they are educated on the appropriate whole food and supplemental sources of EPA and DHA. Therefore, we would recommend that these links between omega3 status, dietary behaviours and barriers for compliance of contact sport athletes should be further investigated using detailed food and supplemental records along with their blood biomarkers, and across an entire competition cycle (pre-season, competition, offseason) which would likely uncover barriers to LCn-3PUFA intake.
In terms of elite contact sport athletes, omega-3 fatty acids and specifically EPA and DHA are reported to modify some aspects of their physiological health. Studies show that male Australian Football players, New Zealand rugby players and American footballers experienced reduced exercising heart rate (Buckley et al., 2009), muscle soreness (Black et al., 2018), and markers of brain inflammation (Heileson et al., 2021), respectively, after supplementing with high doses (> 1000 mg) of combined DHA and EPA. In fact, this raises an important point that elite athletes may indeed require higher than average daily intake of LCn3PUFA to sustain an O3I above that of 8% and possibly more beneficial between 10–12%. For example, preliminary evidence in a cohort of elite professional cyclist observed consistent daily EPA + DHA of ~1500 mg per day resulted in the most consistent O3I scores > 8% for the athletes across a competitive cycling season, including the Tour de France (Macartney et al., 2023). These findings, coupled with our observations that most elite rugby football players in Australia have the potential to
incorporate LCn-3PUFA to much higher levels in the tissues, highlights the need for educating these athletes about whole food and supplemental sources of EPA and DHA to support their physiological health, particularly female athletes. Of note, we have recently piloted and omega-3 education session for elite female rugby players, which included advice for daily intake and ad libitum fish oil supplement access with target EPA + DHA goals. As a team, there was significant overall improvements in both the O3I and the AA/EPA over the season; however, some athlete’s omega-3 status was not modified, most likely due to consistency of intake (Anthony, et al., 2024a). This highlights the challenge of translating optimal LCn-3PUFA intake into professional athletes’ diets, most likely attested to compliance factors linked to individual dietary and supplementation preferences.
There are several limitations to this study that deserve acknowledgment. First, our study is focused on elite rugby football athletes which limits the generalisability of the findings to other elite athlete groups residing in Australia. Given that there was a tendency for the O3I in this current study to be higher on average that those studies from North America, there is a valid reason for screening a large cohort Australian athletes across a wide range of sports to confirm this current observation. Second, we had to rely upon self-reported dietary data from a series of validated although brief questions, that may increase the potential for recall and reporting biases where our outcomes are related to diet and supplement behaviour. Although our choice of questions were derived from validated questionnaires, there is some opportunity to explore these questions relative to athlete populations in a Delphi-style analysis or indeed food records. Finally, our sample was collected at only one time point in the competition year, albeit at an equivalent period of the competition cycle, meaning that there may be some further variation to the overall omega-3 status if they were sampled, for example, in the off-season and this would provide opportunity for sports dietitians to time the duration of the omega-3 program to ensure sustained incorporation over the season.
In conclusion, using blood biomarker testing, it has been revealed that elite Australian rugby football athletes, including an equivalent representation of females, typically are suboptimal for their LCn-3PUFA intake, reflective of the wider Australian population. Most importantly, the increasing participation and professional opportunities for female athletes across the globe, coupled with the physical demands of high-intensity contact sports like rugby football, underscore the necessity of engaging both male and female athletes in a program that emphasises EPA and DHA intake via whole food and/or supplementation. For all athletes, monitoring of the O3I blood biomarker is a unique and emerging opportunity in the performance nutrition environment to support their long-term physiological durability and health.
Conflict of Interest
The authors declare no conflict of interests.
Acknowledgment
The authors thanktheathletesand team supportstaff for theirtime and contribution to this study.
References
Anthony, R., Jaffrey, N., Byron, C., Peoples, G. E., & Macartney, M. J. (2024a). Omega-3 status evaluation in Australian female rugby league athletes: Ad libitum fish oil provision results in a varied Omega-3 Index. International Journal of Sport Nutrition and Exercise Metabolism, 34(4), 218–222. https://doi.org/10.1123/ijsnem.2023-0257
Anthony, R., Macartney, M. J., Heileson, J. L., McLennan, P. L., & Peoples, G. E. (2024b). A review and evaluation of study design considerations for omega-3 fatty acid supplementation trials in physically trained participants. Nutrition Research Review, 37(1), 1–13. https://doi.org/10.1017/S095442242300001X
Anthony, R., Macartney, M. J., & Peoples, G. E. (2021). The Influence of long-chain omega-3 fatty acids on eccentric exercise-induced delayed muscle soreness: Reported outcomes are compromised by study design issues. International Journal of Sport Nutrition and Exercise Metabolism, 31(2), 143–153. https://doi.org/10.1123/ijsnem.2020-0238
Anzalone, A., Carbuhn, A., Jones, L., Gallop, A., Smith, A., Johnson, P., Swearingen, L , Moore, C , Rimer, E , McBeth, J , Harris, W , Kirk K M , Gable, D , Askow, A , Jennings, W , Oliver, J. M. (2019). The Omega-3 Index in National Collegiate Athletic Association division I collegiate football athletes. Journal of Athletic Training, 54(1), 7–11. https://doi.org/10.4085/1062-6050-387-18
Armstrong, A., Anzalone, A. J., Pethick, W., Murray, H., Dahlquist, D. T., Askow, A. T., Heileson, J. L., Hillyer, L. M., Ma, D W L , Oliver, J. M. (2021). An evaluation of omega-3 status and intake in Canadian elite rugby 7s players. Nutrients, 13(11), 1–10 https://doi.org/10.3390/nu13113777
Black, K. E., Hindle, C., McLay-Cooke, R., Brown, R. C., Gibson, C., Baker, D. F., & Smith, B. (2019). Dietary intakes differ by body composition goals: An observational study of professional rugby union players in New Zealand. American Journal of Mens’ Health, 13(6), 1557988319891350. https://doi.org/10.1177/1557988319891350
Black, K. E., Witard, O. C., Baker, D., Healey, P., Lewis, V., Tavares, F., Christensen, S , Pease, T , Smith, B. (2018). Adding omega-3 fatty acids to a protein-based supplement during pre-season training results in reduced muscle soreness and the better maintenance of explosive power in professional rugby union players. European Journal of Sport Science, 18(10), 1357–1367. https://doi.org/10.1080/17461391.2018.1491626
Buckley, J., Burgess, S., Murphy, K., & Howe, P. (2009). DHArich fish oil lowers heart rate during submaximal exercise in elite Australian Rules footballers. Journal of Science and Medicine in Sport, 12, 503–507.
Craddock, J. C., Probst, Y. C., Neale, E. P., & Peoples, G. E. (2022). A cross-sectional comparison of the whole blood fatty acid profile and Omega-3 Index of male vegan and omnivorous endurance athletes. Journal of the American College of Nutrition, 41(3), 333–341. https://10.1080/07315724.2021.1886196
Decsi, T., & Kennedy, K. (2011). Sex-specific differences in essential fatty acid metabolism. American Journal of Clinical
Peoples et al. / The Journal ofSport and Exercise Science, Journal Vol. 9, Issue 1, 12-20 (2025)
Nutrition, 94(6 Suppl), 1914s–1919s. https://doi.org/10.3945/ajcn.110.000893
Dickinson, K. M., Delaney, C. L., Allan, R., Spark, I., & Miller, M. D. (2015). Validation of a brief dietary assessment tool for estimating dietary EPA and DHA intake in Australian adults at risk of cardiovascular disease. Journal of the American College of Nutrition, 34(4), 333–339. https://doi.org/10.1080/07315724.2014.962191
Drobnic, F., Rueda, F., Pons, V., Banquells, M., Cordobilla, B., & Domingo, J. C. (2017). Erythrocyte omega-3 fatty acid content in elite athletes in response to omega-3 supplementation: A dose-response pilot study. Journal of Lipids, 1–7. https://doi.org/10.1155/2017/1472719
European Food Safety Authority. (2012). Scientific opinion on the tolerable upper intake level of eicosapentaenoic acid (EPA), docosahexaenoic acid (DHA) and docosapentaenoic acid (DPA). EFSA Journal, 10(7), 1–48 https://doi.org/10.2903/j.efsa.2012.2815
Flock, M., Skulas-Ray, A., Harris, W., Etherton, T., Fleming, J., & Kris-Etherton, P. (2013). Determinants of erythrocyte omega-3 fatty acid content in response to fish oil supplementation: A dose–response randomized controlled trial. Journal of American Heart Association, 2, 1–13
Harris, W. S. (2010). The Omega-3 Index: Clinical utility for therapeutic intervention. Current Cardiology Reports, 12(6), 503–508. https://doi.org/10.1007/s11886-010-0141-6
Harris, W. S., & Polreis, J. (2016). Measurement of the Omega-3 Index in dried blood spots. AnnalsofClinicaland Laboratory Research, 4(4), 1–7
Harris, W. S., & von Schacky, C. (2004). The Omega-3 Index: A new risk factor for death from coronary heart disease? Preventive Medicine, 39(1), 212–220. http://doi.org/10.1016/j.ypmed.2004.02.030
Heileson, J. L., Anzalone, A. J., Carbuhn, A. F., Askow, A. T., Stone, J. D., Turner, S. M., Hillyer, S. M., Ma, D. W. L., Luedke, J. A., Jagim, A. R., Oliver, J. M. (2021). The effect of omega-3 fatty acids on a biomarker of head trauma in NCAA football athletes: A multi-site, non-randomized study. Journal of the International Society of Sports Nutrition, 18(1), 65. https://doi.org/10.1186/s12970-021-00461-1
Heileson, J. L., Macartney, M. J., Watson, N. L., Sergi, T. E., Jagim, A. R., Anthony, R., & Peoples, G. E. (2024). Nutritional optimization for brain health in contact sports: a systematic review and meta-analysis on long-chain ω-3 fatty acids and neurofilament light. Current Developments in Nutrition, 8 (1), 1–13 https://doi.org/10.1016/j.cdnut.2024.104454
Hooks, M. P., Madigan, S. M., Woodside, J. V., & Nugent, A. P. (2023). Dietary intake, biological status, and barriers towards omega-3 intake in elite level (Tier 4), female athletes: Pilot study. Nutrients, 15(13), 1–12. https://doi.org/10.3390/nu15132821
Larkin, T. A., McKay, B., Sampson, J. A., Delaney, J., Murray, A., Pedlar, C. R., Lewis, N. A., Peoples, G. E. (2024). A low Omega-3 Index and high AA/EPA ratio in American College football players are both improved following 5 weeks of DHA-rich algae oil supplementation. Journal of Science in Sport and Exercise https://doi.org/10.1007/s42978-02300272-7
Lewis, N. A., Daniels, D., Calder, P. C., Castell, L. M., & Pedlar, C. R. (2020). Are there benefits from the use of fish oil supplements in athletes? A Systematic Review. Advances in Nutrition, 11(5), 1300–1314. https://doi.org/10.1093/advances/nmaa050
Macartney, M. J., Hesseling, M., Ortolano, R., McLennan, P. L., & Peoples, G. E. (2023). Assessing the Omega-3 Index of a professional cycling team and the influence of ad libitum provision of fish oil during the competitive season. The Journal of Sport and Exercise Science, 7(2), 38–45. https://doi.org/10.36905/jses.2023.02.05
Macartney, M. J., Peoples, G. E., Treweek, T. M., & McLennan, P. L. (2019). Docosahexaenoic acid varies in rat skeletal muscle membranes according to fibre type and provision of dietary fish oil. Prostaglandins Leukotrienes and Essential Fatty Acids, 151, 37–44. https://doi.org/10.1016/j.plefa.2019.08.006
Maughan, R. J., Burke, L. M., Dvorak, J., Larson-Meyer, D. E., Peeling,P.,Phillips,S.M., Rawson,E S ,Walsh,N P ,Garthe, I., Geyer, H., Meeusen, R., van Loon, L., Shirreffs, S. M., Spriet, L L , Stuart, M , Vernec, A , Currell, K , Ali, V M , Budgett, R. G. M., Ljungqvist, A., Mountjoy, M., Pitsiladis, Y , Soligard, T , Erdener, U , Engebretsen, L. (2018). IOC consensus statement: Dietary supplements and the highperformance athlete. BritishJournalofSportsMedicine, 52(7), 439–455. https://doi.org/10.1136/bjsports-2018-099027
McGlory, C., Galloway, S. D. R., Hamilton, D. L., McClintock, C., Breen, L., Dick, J. R., Bell, J. G., Tipton, K. D. (2014). Temporal changes in human skeletal muscle and blood lipid composition with fish oil supplementation. Prostaglandins Leukotrienes and Essential Fatty Acids, 90(6), 199–206. https://doi.org/10.1016/j.plefa.2014.03.001
National Health and Medical Research Council. (2006). Nutrient reference values for Australia and New Zealand: Executive summary Australian Government, Department of Health and Ageing https://www.nhmrc.gov.au/sites/default/files/images/Nutrient -reference-aus-nz-executive-summary.pdf
Peoples, G. E., Larsen, P., Bowes, H. M., Coombes, J., Drain, J. R., Groeller, H., & McLennan, P. L. (2022). The influence of a basic military training diet on whole blood fatty acid profile and the Omega-3 Index of Australian Army recruits. Applied Physiology, Nutrition, and Metabolism, 47(2), 151–158. https://doi.org/10.1139/apnm-2021-0459
Peoples, G. E., & McLennan, P. L. (2016). Fish oil for physical performance in athletes. In S. Raatz, & D. Bibus (Eds.), Fish and Fish Oils in Health and Disease (pp. 119–136). Elsevier Inc.
Rawson, E. S., Miles, M. P., & Larson-Meyer, D. E. (2018). Dietary supplements for health, adaptation, and recovery in athletes. InternationalJournalofSportNutritionandExercise Metabolism, 28(2), 188–199. https://doi.org/10.1123/ijsnem.2017-0340
Ritz, P. P., Rogers, M. B., Zabinsky, J. S., Hedrick, V. E., Rockwell, J. A., Rimer, E. G.,Kostelnik, S. B., Hulver, M.W., Rockwell, M. S. (2020). Dietary and biological assessment of the omega-3 status of collegiate athletes: A cross-sectional analysis. PLoS ONE, 15(4), 1–16. https://doi.org/10.1371/journal.pone.0228834
Peoples et al. / The Journal ofSport and Exercise Science, Journal Vol. 9, Issue 1, 12-20 (2025)
Rupp, H., Wagner, D., Rupp, T., Schulte, L. M., & Maisch, B. (2004). Risk stratification by the "EPA+DHA level" and the "EPA/AA ratio" focus on anti-inflammatory and antiarrhythmogenic effects of long-chain omega-3 fatty acids. Herz, 29(7), 673–685. https://doi.org/10.1007/s00059-0042602-4
Schuchardt, J. P., Beinhorn, P., Hu, X. F., Chan, H. M., Roke, K., Bernasconi, A., Hahn, A , Sala-Vila, A , Stark, K D , Harris, W. S. (2024). Omega-3 world map: 2024 update. Progress in Lipid Research, 1–17 https://doi.org/10.1016/j.plipres.2024.101286
Sullivan, B. L., Williams, P. G., &Meyer,B. J.(2006). Biomarker Validation of a Long-chain omega-3 polyunsaturated fatty acid food frequency questionnaire Lipids, 41(9), 845–850. Thielecke, F. & Blannin, A. (2020). Omega-3 fatty acids for sport performance are they equally beneficial for athletes and amateurs? A Narrative Review. Nutrients, 12(12), 1–28 https://doi.org/10.3390/nu12123712
Vafai, Y., Yeung, E., Roy, A., He, D., Li, M., Hinkle, S. N., Grobman, W. A., Newman, R., Gleason, J. L., Tekola-Ayele, F , Zhang, C , Grantz, K. L. (2023). The association between first-trimester omega-3 fatty acid supplementation and fetal
growth trajectories. American Journal of Obstetrics and Gynecology, 228(2), 224 e1–224.e16 https://doi.org/10.1016/j.ajog.2022.08.007
Vannice, G., & Rasmussen, H. (2014). Position of the Academy of Nutrition and Dietetics: Dietary fatty acids for healthy adults. Journal of the Academy of Nutrition and Dietetics, 114(1), 136–153. https://doi.org/10.1016/j.jand.2013.11.001
Wada, M., DeLong, C. J., Hong, Y. H., Rieke, C. J., Song, I., Sidhu, R. S., Yuan, C., Warnock, M., Schmaier, A. H., Yokoyama, C , Smyth, E M , Wilson, S J , FitzGerald, G A , Garavito, R. M.,Suide, X.,Regan, J.W., Smith, W. L.(2007). Enzymes and receptors of prostaglandin pathways with arachidonic acid-derived versus eicosapentaenoic acidderived substrates and products. Journal of Biological Chemistry, 282(31), 22254–22266. https://doi.org/10.1074/jbc.M703169200
Wilson, P. B., & Madrigal, L. A. (2016). Associations between whole blood and dietary omega-3 polyunsaturated fatty acid levels in collegiate athletes. International Journal of Sport Nutrition and Exercise Metabolism, 26(6), 497–505. https://doi.org/10.1123/ijsnem.2015-0316
The Journal ofSport and Exercise Science, Vol. 9, Issue 1, 21-33 (2025) www.jses.net
Physical demands and positional requirements of semi-elite female netball players through GPS unit-based accelerometers
Josh H. Gascoigne1,2 , Russ Best1 , Rhys W. Macpherson1 , Suzanne C. Belcher3, Frans H. van der Merwe1*
1Wintec Centre for Sport Science and Human Performance, Waikato Institute of Technology, New Zealand
2KX Pilates, New Zealand
3Wintec Centre for Health and Social Practice, Waikato Institute of Technology, New Zealand
A R T I C L E I N F O
Received: 04.03.2025
Accepted: 19.05.2025
Online: 10.10.2025
Keywords:
Netball
Position-specific metrics
Physical demands
A B S T R A C T
The primary purpose of this study was to investigate the physical demands and positional requirements placed upon semi-elite female netball players during match-play and, secondly, to determine the match-to-match variability of these measures throughout a single six-game netball season. The GPS unit-based accelerometry data were collected from12semi-elitefemalenetballplayers(22±1.77years;179±3cm;80±6kg)competing in six competitive matches. The GPS units enabled the measurement of the total distance (TD; m), max velocity (maxV; m/s), jump count (JC; n), and max jump height (MJH; cm). Data was exported into Microsoft Excel, where between-position comparisons were assessed using an analysis of covariance (ANCOVA) test. Tukey's honestly significant difference (HSD) was used post hoc to identify and highlight statistically meaningful differences between the seven playing positions (p ≤ 0.05). Effect size comparisons were calculated using Cohen's d as described by Cohen (2013), with confidence intervals set at 95%andinterpretedaccordingtoHopkins'methods.TheCentre(C)coveredasignificantly higher TD (4671 ± 254.7 m) than all other positions, except for Goal defence (GD). Conversely,Goalshooter(GS)andGoalkeeper(GK)werebothsignificantlylowerthanall positions for TD (3246.3 ± 200.4 m and 2250 ± 258.8 m, respectively). GK had a significantly higher JC and MJH (45.0 ± 8.4 n, 0.7 ± 0.1 jumps/min and 48.2 ± 7.7 cm, respectively) than all positions, except for GS. No significant differences were found between any positions for maxV. Results from this study suggest the physical demands between these positions differ significantly, necessitating specialised position-specific strength and conditioning programmes for adequate match preparation and to optimise athletic performance
1. Introduction
Netball is an intermittent team sport involving high-intensity bouts of gameplay integrated between repeated low-intensity periods of active or passive recovery (Chandler et al., 2014; Cormack et al., 2014). Netball imposes significant physical demands that require the execution of technical and tactical skills, both with and without ball possession, supported by a combination of aerobic and anaerobic energy systems and fullbody strength (van Gogh et al., 2020). Netball also requires multidirectional speed and agility with explosive accelerations and sudden decelerations in the linear, lateral, and vertical planes,
further underpinning dynamic strength and power (Bardzinski et al., 2021; Shaw et al., 2020). Separating netball from other courtbased team sports is the rule that permits players to run when in possession of the ball. Instead, they must stop within one step once in possession of the ball, resulting in several sharp decelerations throughout match play (van Gogh et al., 2020). Match-play at a semi-elite level consists of 15-minute quarters and is played on an indoor court (30.5 m in length, 15.25 m in width) split into the attacking goal third, middle third, and defensive goal third. Traditionally, the attacking and defensive goalthirdsalsocontainahalf-circle(4.9minradius),representing where the attacking shooters must shoot within to score points. A
*Corresponding Author: F.H. van der Merwe, Waikato Institute of Technology, New Zealand, Frans.vanderMerwe@wintec.ac.nz
traditional netball team comprises seven players with specific court-restricted positions (Figure 1). Goal-based positions (Goal shooter [GS] and Goalkeeper [GK]) are restricted to the attacking and defensive goal third, respectively, but can also compete in the goal circles at their respective ends. Goal attack (GA) and Wing attack (WA) are restricted to the attacking goal third and the middle third, where the GA can also compete within the goal circle to score points. Goaldefence (GD) and Wingdefence(WD) are restricted to the defensive goal third and middle third, where the GD is additionally responsible for defending in the goal circle. The centre (C) can compete in all three thirds but cannot enter either goal circle. Due to the tactical requirements of the sport and court restrictions, each position has different physical demands, consequently affecting each player's skill and conditioning programme requirements (Chandler et al., 2014; Davidson & Trewartha, 2008; Graham et al., 2020).
al., 2014; Fox et al., 2013; Graham et al., 2020; Young et al., 2016). Typically, previous literature has separated each position into defenders (GK and GD), midcourters (WA, C, and WD), and attackers (GS and GA) based on positional tactics (Bruce et al., 2012; Cormack et al., 2014; van Gogh et al., 2020; Yong et al., 2015). However, this does notaccurately represent each position's physical demands, as players in the same positional group compete with different court restrictions and must undertake differing attacking and defensive actions (Graham et al., 2020; Thomas et al., 2017).
For strength and conditioning coaches working with netball players, the following physical demands have been identified as some of the key measures of performance: total distance (TD; m), max velocity (maxV; m/s), jump count (JC; n), and max jump height(MJH;cm)(Tayloretal.,2017).Quantifyingthesephysical demands in netball becomes important when developing positionspecific training programmes and analysing individual athletic performance (Taylor et al., 2017). Current research agrees that the C position produces the highest TD (3500–8000 m) throughout match play compared to all others (Brooks et al., 2020; Chandler et al., 2014; Shaw et al., 2020; van Gogh et al., 2020). Whereas GA, WA, GD, and WD positions cover similar TD to each other (2500–5500 m), all of which elicit higher TD than GK and GS (1500–4500 m and 35.12–49.98 m/min, respectively; Brooks et al., 2020; Chandler et al., 2014; Shaw et al., 2020; van Gogh et al., 2020).
Those positioned in two or three thirds (C, GA, GD, WA, and WD) must work for extended periods without recovery, often transitioning immediately from attack to defence, resulting in a higherTD(Shawetal.,2020).When attacking,themainobjective for these positions is to evade defenders and create space to move the ball into the attacking goal third for scoring opportunities, demonstrating high levels of speed and agility, relying primarily on aerobic power (van Gogh et al., 2020). When defending, these positions must anticipate opposition movements through off-ball and on-ball guarding, resisting opposition attackers from making advancements down the court and attempting to regain possession of the ball (Shaw et al., 2020). Conversely, restricted to one third, goal-based positions (GS and GK) are required to perform short, high-intensity efforts with longer recovery periods, relying mainly on anaerobic power (van Gogh et al., 2020). The GS needs to move away from defenders quickly and into a scoring position, while the GK is required to move with the GS and is often tactically required to keep themselves between the GS and the ball to stop any passes into the goal circle (Shaw et al., 2020).
Note The shaded area represents the designated area of the court for the respective netball positions.
Figure 1: Designated areas of play for the seven netball playing positions on a netball court Note: The shaded area represents the designated area of the court for the respective netball positions.
Previous research has indicated that greater physical demands, mainly measured as some form of distance covered, occur in the netball positions that can cover a greater percentage of the court due to fewer court restrictions (Brooks et al., 2020; Chandler et
Similar to TD, positions restricted to two or three thirds (C, GA, WA, GD, and WD) record higher maxV (5.0–6.67 m/s), whereasgoal-basedpositionshavelesscourtspacetoreachhigher speeds (4.11–5.83 m/s; Brooks et al., 2020; Shaw et al., 2020; van Gogh et al., 2020). However, goal-based positions are tactically required to move more vertically to compete for rebounds and higher passes into the goal circle, displaying high levels of strength, power, and speed. This suggests that based on their tactical roles within the team, their jump count and jump height may be higher than all other positions (Cormack et al., 2014; Shaw et al., 2020; van Gogh et al., 2020). Monitoring and evaluating the match-play physical demands in netball can provide a rationale for position-specific strength and conditioning programmes and can help strength and conditioning coaches understand the physical qualities required to increase athletic
performance at a semi-elite level (Brooks et al., 2020; Gabbett et al., 2017; Thomas et al., 2017; Thornton et al., 2019).
The complex and intermittent nature of movements within competitive netball matches means that measures of positional physical demands may vary from match to match throughout a season (Kempton et al., 2014). However, the current use of technology in netball is limited (Mackay et al., 2024), resulting in a paucity of research investigating the match-to-match variability of the physical demands between each position in netball competed at the semi-elite and elite levels. Since the introduction of accelerometers, GPS units with in-built accelerometers now provide in-depth data for analysis to help understand the physical demands and positional requirements placed uponathletes and the match-to-match variation across multiple games in intermittent sports such as netball (Cummins et al., 2013; van Gogh et al., 2020). Earlier studies in sports such as soccer, rugby league, and AFL have reported that variation in physical demands and positional requirements may be related to internal factors (physical fitness and match preparation) and external factors (game tactics, strength of the opposition andmatch outcome).The magnitude of variability between matches may also be influenced by playing position and the level of competition (Kempton et al., 2015). To perform at the higher levels, players must be able to consistently cope with the internal and external demands of the sport placed upon them during training and competition (Thomas et al., 2017). A better understanding of the variation of these demands can be useful for position-specific training programmes, selecting reliable performance measures during match-play and interpreting worthwhile changes in performance (Kempton et al., 2014).
Acquiring an in-depth understanding of the position-specific physical demands of netball during match-play and the variation across multiple games becomes a significant contributing factor to effective position-specific training programmes, match preparation, athletic performance, and injury prevention (Fox et al., 2013; Graham et al., 2020; Shaw et al., 2020; Thomas et al., 2017). However, previous research outlining these physical demands of female netball players has widely focused on athletes competing at youth, amateur, and elite levels (Brooks et al., 2020; Davidson & Trewartha, 2008; Chandler et al., 2014; Cormack et al., 2014; Fox et al., 2013; Graham et al., 2020; Shaw et al., 2020; van Gogh et al., 2020), with little investigation into the semi-elite level. For netball players progressing from the amateur or youth level to thesemi-elite andelite levels, it is important to understand and develop the physical qualities essential to perform at the required intensities (Thomas et al., 2017). Therefore, the primary purpose of the current study is to investigate the position-specific physical demands placed upon semi-elite female netball players during match-play. This will enable coaches and practitioners to implement effective strength and conditioning programmes between each position and help administer long-term athlete development (LTAD) pathways for youth/amateur athletes pushing to be accepted to compete at the elite level. Secondly, the current study aims to determine the match-to-match variability of these measures throughout a single netball season and the effect these variations might have on performance. It is hypothesised that positions competing with the fewest court restrictions will accumulate the highest physical demands during match-play. Secondly, that match-to-match variation will be seen between all metrics measured for all positions due to differing technical and
tactical requirements. Finally,a largervariation will likely beseen across higher-speed activities such as maxV and jumping metrics (JC and MJH).
2. Methods
2.1. Research design
A cross-sectional observational study design was used to quantify the physical demands between all positions in semi-elite netball players competing in the New Zealand National Netball League (NNL) competition. The study was carried out to accumulate, measure, and analyse GPS unit-based accelerometry data during six competition matches over a single NNL season. Institutional ethical approval was granted before the commencement of the study, ethics number FE1512062019.
2.2. Participants
The GPS unit-based accelerometry (GPS units) data was collected from 12 semi-elite female netball players (22 ± 1.77 years; 179 ± 3 cm; 80 ± 6 kg) from one NNL team. Data was accumulated over six competitive matches across a two-month period, with all games played on indoor courts. Depending on competition fixtures, games were separated by six or seven days for athletes to recover and appropriately prepare for the next competition match. Complete game data was collected per position regardless of substitutions or stoppages, totalling 60 minutes of match play per game, consisting of data from up to two players per position (van Gogh et al., 2020). Positional game files were excluded if a portion of a game was played by an elite player released down from the elite competition to gain more game time. Elite player data was omitted due to these players not having an assigned and calibrated GPS unit, resulting in an incomplete game file for their selected position, which impacts the validity of the accumulated data (McGuiness et al., 2020). Therefore, 33 game files were analysed during this study, representing 79% of all game files (GK: 6 [100%]; GD: 5 [83%]; WD: 4 [67%]; C: 5 [83%]; WA: 5 [83%]; GA: 4 [67%]; GS: 4 [67%]). Before the commencement of the study, participants were familiarised with all procedures and were given four trainings to familiarise themselves with wearing the GPS units. All participants provided verbal and written consent before the commencement of the study.
2.3. Procedures
Physical game loads were collected during competition matches using GPS units (VX350b Log, Visuallex Sports International Ltd, Lower Hutt, New Zealand), sampling at 10 Hz for the duration of each game.The GPS units alsocontained a tri-axial accelerometer sampling at 104 Hz, working independently of the satellite GPS to record indoor movements not attainable through GPS technology. Previous literature concludes that accelerometers within the VX Sport GPS units demonstrate high validity and inter-unit reliability when tracking the intermittent activity of an athlete over multiple training sessions or competition matches (Wylde et al., 2018). The coefficient of variation (CV%) of the VX Sport accelerometers has been recorded as < 10% (Wylde et al., 2018). The respective units were housed in the manufacturer's
GPS sports vest (VX Sport SmartVest, Visuallex Sport International Ltd, Lower Hutt, New Zealand) between the athletes' scapulae in the upper thoracic-spine region. Each player was assigned the same GPS unit for the entirety of the data collection period to minimise inter-unit variability (Best et al., 2019;Delves et al.,2021; McGuinness et al., 2019). All GPS units were calibrated for indoor environments as instructed by the manufacturer's indoor calibration methodology before collecting and accumulating data. The GPS units measured TD (m), maxV (m/s), JC (n), and MJH (cm). The GPS units were turned on 15 minutes before the pre-match warm-up to ensure GPS units were working correctly (Jennings et al., 2010). The GPS units were inserted into sports vestsimmediately after the warm-up andworn until each competition game's end. The researchers noted down each quarter's start and end times and positional interchanges, and any data recorded outside these times were excluded post-match only to include time-on-court obtaining a more accurate representation of data for both distance-related and time-related metrics (White et al., 2013). After each match, the data was downloaded from each GPS unit to an institute-issued computer using the manufacturer's proprietary software (VX Sport, Visuallex Sport International Ltd, Lower Hutt, New Zealand). The data was then exported into Microsoft Excel (Microsoft, Redmond, USA, Version 16.54) for statistical analysis.
2.4.
Statistical analysis
Between-position comparisons for all GPS data metrics were assessed using an analysis of covariance (ANCOVA) test.
Significance was set at p < 0.05, and all data were reported as mean ± SD with confidence intervals set at 95% unless otherwise stated. Tukey's honestly significant difference (HSD) was used post hoc to identify and highlight statistically meaningful differences. Effect size comparisons were calculated using Cohen's d as described by Cohen (2013), with confidence intervals set at 95% and interpreted according to the methods of Hopkins et al. (2009). Threshold values for Cohen’s d statistics were ≤ 0.20 (trivial), 0.21–0.60 (small), 0.61–1.20 (moderate), 1.21–2.00 (large), and ≥ 2.01 (very large). Between-match variability for each metric between all positions was measured via the typical error of measurement expressed as coefficient of variation (CV%), calculated by dividing the SD of repeated performance data by the corresponding mean value of each position (Gregson et al., 2010; Kempton et al., 2015).
3. Results
Table 1 shows all GPS unit-based accelerometer metrics compared between the seven positions, including significant differences between positions for TD, JC, and MJH. The significant differences between positions are analysed further across each metric in Tables 2 to 7 through confidence intervals, effect sizes and p-values. However, no significant differences were found between any positions for maxV, and visual inspection of the data showed no notable variation between positions (4.1–4.7 m/s; p > 0.5). Therefore, results for maxV were not tabled.
Table 1: Normative GPS unit-based accelerometer data for the different playing positions in netball, including95% confidence intervals
Goalkeeper
Goal Defence 4155.2 ± 355.7ag [3713.5, 4596.9]
Wing Defence
Centre
Wing Attack
Goal Attack
[60.4, 72.6]
3813.8 ± 179.8adg [3527.7, 4099.8] 59.5 ± 1.2adg [57.6, 61.4] 1.0 ±
4671.4 ± 254.7acefg [4355.2, 4987.6]
4032.0 ± 296.1adg [3664.3, 4399.7]
74.4 ± 3.9abcefg [69.6, 79.2] 1.2 ±
63.9 ± 3.4adg [59.7, 68.1] 1.0 ±
[1.0, 1.2]
3818.8 ± 258.8adg [3406.9, 4230.6] 61.5 ± 4.7adg [54.1, 68.9] 1.0 ± 0.1
Goal Shoot 2250.0 ± 258.8abcdef [1992.8, 2507.2]
± 2.0abcdef [31.0, 41.0]
± 0.0abcdef [0.6, 0.6]
± 0.7 [2.6, 5.8]
± 3.0 [30.5, 45.5]
[0.2, 0.6]
[0.3, 0.6]
Note: Data presented as mean ± SD, with 95% confidence intervals in square brackets. p-values are adjusted using Tukey’s Honestly Significant Difference (HSD) test. aSignificantly different to GK; bSignificantly different to GD; cSignificantly different to WD; dSignificantly different to C; eSignificantly different to WA; fSignificantly different to GA; gSignificantly different to GS.
Table 2: Comparison of the total distance (m) according to playing position in netball
Positions Mean difference 95% CI
GK vs GD -908 9 [-1404 8, -413.1]
WD
[-1095 9, 38 9]
-1425 1 [-1920 9, -929 3]
large WA -785 7 [-1281.5, -289 9]
GA -572.4 [-1100 9, 43.9]
GS 996 3 [417.4, 1575 3]
GD vs WD
5 [-207.8, 890 7]
-516 2 [-1034 1, 1 65]
WA 123.2 [-394.7, - 641.1]
GA 336 5 [-212 8, 885 7]
GS 1905 2 [1307 2, 2503.2]
WD vs C -857.6 [-1406 9, -308 4]
-218 3 [-767 5, 331 0]
-5.0 [-584.0, 574 0]
GS 1563.8 [938 4, 2189.1]
[121 5, 1157 3]
7 [303 4, 1401 9]
2421.4 [1823.4, 3019.4] <
[-336.0, 762.5]
1782.0 [1184.0, 2380.0]
vs GS
large
[943 4, 2194.1]
Note: Mean difference values presented with 95% CI in square brackets. p-values are adjusted using Tukey’s Honestly Significant Difference (HSD) test: *p ≤ 0.05 ES = effect size (Cohen’s d).
Table 3: Comparison of distance rate (m/min) according to playing position in netball
[-22.3, -8.6]
[-15.8, -1.2]
[-30.2, -16.6]
[-19.7, -6.1]
[-17.8, -3.2]
[7.0, 23.0]
vs
6.9 [-0.7, 14.5]
-8.0 [-15.1, 0.9]
2.5 [-4.6, 9 7]
[-2.7, 12.5]
[21.2, 38.6]
vs C -14.9 [-22.5, -7.3]
[-12.0, 3.2]
[-10.0, 6 0]
[14.9, 32.1]
-0 51
large C vs WA 10.5 [3.4, 17.6]
large GA 12.9 [5.3, 20.5] < 0.001* 2.69
GS 38.4 [30.2, 46.6] < 0.001* 9 85
WA vs
2.4 [-5.2, 9 7]
GS 27.9 [19.7, 36.1] < 0.001* 8 06 Very large
GA vs GS 25.5 [16.9, 34.1] < 0.001* 5 56 Very large
Note: Mean difference values presented with 95% CI in square brackets. p-values are adjusted using Tukey’s Honestly Significant Difference (HSD) test: *p ≤ 0.05. ES = effect size (Cohen’s d).
Table 4: Comparison of average speed (m/s) according to playing position in netball
Positions
vs
GS
[-0.4, -0.1]
[-0.3, 0.0]
[-0.5, -0.3]
[-0.3, -0.1]
[-0.3, -0.0]
[0.1, 0.4]
[-0.0, 0.3]
[-0.3, 0.0]
[-0.1, 0.2]
[-0.0, 0.2]
[0.4, 0.7]
[-0.4, -0.1]
[-0.2, 0.1]
[-0.2, 0.1]
[0.2, 0.6]
[0.0, 0.3]
0.23 [0.1, 0.3]
[0.5, 0.8]
0.06 [-0.1, 0.2]
[0.3, 0.6]
[0.2, 0.6]
Note: Mean difference values presented with 95% CI in square brackets. p-values are adjusted using Tukey’s Honestly Significant Difference (HSD) test: *p ≤ 0.05. ES = effect size (Cohen’s d).
Table 5: Comparison of jump count (n) according to playing position in netball
[6.1,
[5 0, 30.2]
[5.4, 30.6]
[8 6, 35.4]
[-0.4, 29.0]
[-11.4, 16.4]
[-12.5, 13 7]
[-12.1, 14.1]
[-8.9, 18.9]
-2 7 [-17 8, 12 5]
vs C
[-15.8, 12.0]
[-15.4, 12.4]
[-12.1, 17.2]
[-21.0, 10.7]
[-12.7, 13.5]
4.4 [-9.5, 18.3]
[-18.4, 11.9]
[-9.9, 17 9]
-3 7 [-18 8, 11.5]
vs GS -7.7 [-23 5, 8 2]
Note: Mean difference values presented with 95% CI in square brackets. p-values are adjusted using Tukey’s Honestly Significant Difference (HSD) test: *p ≤ 0.05. ES = effect size (Cohen’s d).
Table 6: Comparison of jump rate (jump/min) according to playing position in netball
Positions
[0.1, 0.5]
[0.1, 0.5]
[0.1, 0.5]
[0.1, 0.5]
[0.1, 0.6]
0.2 [-0.01, 0.5]
[-0.2, 0.3]
[-0.2, 0.2]
[-0.2, 0.2]
[-0.1, 0.3]
[-0.3, 0.2]
[-0.2, 0.2]
[-0.2, 0.2]
[-0.2, 0.1]
[-0.3, 0.2]
[-0.2, 0.3]
[-0.3, 0.2]
[-0.4,0.1]
Note: Mean difference values presented with 95% CI in square brackets. p-values are adjusted using Tukey’s Honestly Significant Difference (HSD) test: *p ≤ 0.05. ES = effect size (Cohen’s d).
Table 7: Comparison of max jump height (cm) according to playing position in netball
[-0.2, 23 9]
[2 4, 27 7]
[4.9, 28 6]
[3 0, 26 7]
[6 0, 31.3]
[-3.7, 24.0]
[-10.2, 16.1]
[-7 7, 17.1]
[-9.6, 15.2]
[-6.6, 19 8]
[-16.2, 12.4]
vs
[-11.4, 14 9]
[-13.3, 13.0]
[-10.2, 17.5]
[-19.9, 10.1]
[-14.3, 10.5]
1.9 [-11.3, 15.1]
[-20 9, 7 7]
[-9.4, 17.0]
[-19.0, 9 6]
vs GS -8.5 [-23.5, 6 5]
Note: Mean difference values presented with 95% CI in square brackets. p-values are adjusted using Tukey’s Honestly Significant Difference (HSD) test: *p ≤ 0.05. ES = effect size (Cohen’s d).
Table 2 shows the comparisons and confidence intervals for mean differences across the seven positions for TD. The GS had a significantly lower TD than all other positions, with a Cohen's d rangingbetween -5.76and4.97. The GK had a significantly lower TD than all other positions except for GS; the TD GK position remained significantlyhigherthan theGSposition.ExceptforGD, the C had a significantly higher TD than all other positions (Cohen's d = -5.76 to 9.72).
Tables 5 and 7 show the comparisons and confidence intervals for mean differences across the seven positions for JC and MJH, respectively. The GK had a significantly higher JC (Cohen's d =2.28to3.07)andMJH(Cohen's d =1.78to2.43)thanallpositions except GS. Mean differences were also found when comparing JC and MJH across all other positions. However, the analysis indicated that these mean differences were not statistically significant.
Table 8 shows the CV% between all metrics and games played across all positions. Results show that the CV% of all positions for TD falls below 9%. Results show that WD, C, and GA had a CV% below 8% for maxV, whereas GK, GD, WA and GS range between 11–18%. The GD, WD, and GS had a CV% below 10% for MJH, while all other positions had a higher CV% ranging between 12–34%. The GD was the only position with a CV% lower than 10% for JC, whereas all other positions had higher CV% ranging from 16–28%.
semi-elite level are required to understand better the transitional long-term athlete development (LTAD) needs of youth and U19 players required to reach elite level and guide strength and conditioning coaches (Gabbett et al., 2017; Thornton et al., 2019). For athletes to progress from lower to higher standards of competition, they likely require position-specific training to develop the physical qualities needed to perform at the required intensity (Cormack et al., 2014). The current study shows high variability in the physical demands between positions in netball. Therefore, the findings of this study also have implications for position-specific training programmes, match preparation, and performance enhancement strategies for netball players competing at a semi-elite level.
The GPS-based accelerometer results suggest that the court restrictions and tactical requirements determine the physical demands of each position during match-play, confirming the primary hypothesis. Competing with the fewest court restrictions, Ccovered asignificantlyhigherTDthanallotherpositionsexcept GD (Table 1), which is in line with previous literature (Brooks et al., 2020; Davidson & Trewartha, 2008; Chandler et al., 2014; Cormack et al., 2014; Fox et al., 2013; Graham et al., 2020; Shaw et al., 2020; van Gogh et al., 2020). The current study revealed that C demonstrated a lower TD than previously reported at the senior elite level, where TD from the senior elite level ranges between 5462 ± 169.4 m to 7984 ± 290 m (Brooks et al., 2020; Davidson & Trewartha, 2008). However, the C in the current study recorded a similar TD tothe youth level (4724 ± 290 m; van Gogh et al., 2020) and a higher TD compared to the U19 level (3276.3 m; Shaw et al., 2020). Alternatively, goal-based positions were significantly lower than all positions when comparing TD (Table 1), which is also in line with previous literature (Brooks et al., 2020; Davidson & Trewartha, 2008; Chandler et al., 2014; Cormack et al., 2014; Fox et al., 2013; Graham et al., 2020; Shaw et al., 2020; van Gogh et al., 2020). However, the current study concluded that GK and GS were significantly different when comparing TD, the first study to the author's knowledge that identified such differences.
Note: Data presented as a percentage of the coefficient of variation (CV%) for each metric in each position.
4. Discussion
The current study describes the position-specific physical demands and the match-to-match variability of semi-elite female netball players across a single NNL season. To the author's knowledge, the current study was the first to investigate the match-play positional physical demands and the match-to-match variability of netball competed by semi-elite female netball players across a single season. Previous studies investigating the physical demands of netball have been contested at youth, U19 or senior elite levels (Brooks et al., 2020; Davidson & Trewartha, 2008;Chandleretal.,2014;Cormacketal.,2014;Foxetal.,2013; Graham et al., 2020; Shaw et al., 2020; van Gogh et al., 2020). However, position-specific physical demands of match-play at a
The current study revealed that GK and GS covered a lower TD than previously reported by Davidson and Trewartha (2008) at the senior elite level (4283 ± 261 m and 4210 ± 477 m, respectively). However, in more recent research at the senior elite level, GK and GS demonstrated a lower TD (3040.5 ± 216.9 m and 2134.0 ± 102.6 m, respectively; Brooks et al., 2020) compared to the current study. Similarly, GK and GS in the current study covered a notably higher TD compared to the youth (1651 ± 205 m and 1650 ± 287 m, respectively; van Gogh et al., 2020) and U19 levels (1761.1 m and 1800.4 m, respectively; Shaw et al., 2020).
Investigations into the elite-level running demands by Davidson and Trewartha (2008) are based on data collected using notational analysis and timing gates. However, recent research at the elite level suggests that Davidson and Trewartha (2008) may have overestimated the distance players covered (Brooks et al., 2020). Davidson and Trewartha (2008) used timing gates in a training setting to determine each locomotor activity's speeds, then used these times to estimate the distance travelled during match-play from recorded video timing (speed × time = distance; Brooks et al., 2020). In some situations, testing speeds of straightline running in a controlled setting would provide faster sprinting times than straight-line running in match conditions during
match-play, resulting in an overestimated total distance travelled (Brooks et al., 2020). This would explain the substantial difference between the investigations into the elite and the current study.
Netball is experiencing rapid advancements in professionalism, involving technical and tactical application and execution and changes to players' physical conditioning (Russell et al., 2020). Past literature concludes that higher-standard players accumulate higher physical demands during match-play (Bardinski et al., 2021; Cormack et al., 2014). However, higherstandard players must maintain higher intensities, accumulating greater physical demands through sport-specific movements. In contrast, lower-standard players perform high-intensity movements less often and accumulate more physical demands by covering higher distances (Cormack et al., 2014). The investigations done by Davidson and Trewartha (2008) were carried out in 2008, suggesting that perhaps playing tactics and individual abilities have changed since then. These factors may explain why there aredifferences seen in TDbetween theelite and the current study, especially between goal-based positions in the elite studies versus the current study. However, further research is recommended to investigate how technical and tactical application and execution can be more economical to an athlete’s overall physical demandsorplayer loadduring match-play.While there is an evident variation in physical demands seen across semi-elite compared to the youth and elite levels, the age difference, playing experience, level of competition, and the technical and tactical strategies used could also explain these differences (Shaw et al., 2020). Understanding the differences in physical demands for each position at the semi-elite level compared to other competition levels gives practical implications to help administer LTAD pathways, providing a benchmark for athletes pushing to progress from youth and U19 levels to the elite level.
Differences were also found when comparing the maxV of each position. However, the analysis indicated that these differences were not statistically significant. This is expected as speed-related metrics can be linked to the surface area in which athletes can compete (Kempton et al., 2015; Shaw et al., 2020). It takes field athletes between 30 and 40 m to reach maxV (Spencer et al., 2004), suggesting that based on the size of a netball court (30.5 m in length, 15.25 m in width), the positional court restrictions and the sport-specific movements (acceleration, deceleration, and change of direction) required in netball, maxV will rarely be reached. It is accepted that speed is a vitally important aspect between all positions when it comes to netball performance, but measurements of accelerations, decelerations and change of direction should be prioritised instead of measuring maxV (Paradisis et al., 2019; Standing & Maulder, 2017). Future research is required, looking into each position's acceleration and deceleration requirements during match-play at a semi-elite level.
The mean differences in TD shown in Table 2 suggest high variability between each position, further supporting the fact that court restrictions and tactical requirements determine the running metrics of each position. The C must cover the entire court length, transitioning from defence to attack with little stationary time, resulting in a higher TD (van Gogh et al., 2020). The C's role is critical to stopping the opposition's progression of the ball on defence while ensuring quality ball delivery from the defensive positions to the attacking shooters (van Gogh et al., 2020). The
more consistent running demands of the C suggest that higher aerobic capacities are essential for players to physically cope with the position’s tactical requirements (van Gogh et al., 2020). Competing with more court restrictions, GA, WA, GD, and WD covered TDs similar to each other and were not significantly different (Table 2). The technical and tactical roles required of these positions are similar to those of the C but carried out in a smaller court area, resulting in lower TD (Table 2). Restricted to only one third, GK and GS spend considerable time in low-speed activity preparing for the play to reach the third they are allowed to compete in, resulting in a significantly lower TD compared to all other positions (van Gogh et al., 2020). Physical demands placed upon these positions are due to the accumulation of specific tactical roles required of each goal-based position (Bailey et al., 2017). To create scoring opportunities, GS are required to execute short, high-intensity sprints to move away fromdefenders (Shaw et al., 2020), while GK demonstrates the highest off-ball guarding and defending actions compared to all other positions and is more likely to defend their direct opponent (GS) for extended periods (Fox et al., 2013). According to Bailey et al. (2017), on and off-ball guarding has the highest mean player load per instance, suggesting that GK performs the most energetically demanding activity most frequently. This may indicate that GK covers a significantly higher TD than the GS based on tactical requirements despite having the same court restrictions, which aligns with the current study (Table 2). The more intermittent nature of goal-based positions suggests that higher anaerobic capacities are required from athletes competing in these positions (Thomas et al., 2017; van Gogh et al., 2020). These results confirm that the specific tactical role and court restrictions determine the running demands of each position and highlight the implications for position-specific training programmes (Gabbett et al., 2017; Thornton et al., 2019). Previous studies have used maximal aerobic speed (MAS) training, repeated sprint ability (RSA) training, small-sided games (SSG), high-intensity training (HIT), and strength training as successful training mechanisms to develop aerobic and anaerobic capacities in athletes (Thomas et al., 2017).
Although the current study's running demands for GK and GS may not result in a high TD, goal-based positions accumulate more physical demands in the vertical plane (Cormack et al., 2014). Overall, the GK had a significantly higher JC and MJH than all positions except for GS (Table 1). This is not supported by previous investigations at the elite and youth level, wherein in thesestudiestheGShad thehighestJCbetween allpositions (82.7 ± 6.8; Brooks et al., 2020; 55.0 ± 14.5; van Gogh et al., 2020). In the same studies, GK had the second-highest JC at the elite level (61.0 ± 6.5; Brooks et al., 2020) and the second-lowest JC at the youth level (33.3 ± 16.0; van Gogh et al., 2020) between all positions. In the current study, the same player was selected to play GK for 89% of the analysed game files for that position, suggesting that the playing style of the participant may explain these differences between past literature and the present study.
The mean differences in JC and MJH shown in Table 5 and Table 7, respectively, suggest high variability in the jumping metrics between GK andall other positions, exceptforGS, further supporting that positional tactics determine the jumping metrics of each position. Tactically, goal-based positions are required to move more vertically, displaying high levels of strength, power, and agility (Cormack et al., 2014). To create scoring opportunities,
the GS will often jumpvertically intotheair to receive apassfrom an attacking teammate or to recover a rebound after a missed attempt at scoring a goal (Shaw et al., 2020). However, the GK's primary tactical role is to stop the GS from any scoring opportunities, particularly in preventing the ball from entering the goal circle and getting into a position to recover the rebounds before the opposition GS (Foxet al., 2013; van Gogh et al., 2020). Therefore, the GK must attempt to move with the GS, either in the linear, lateral, or vertical plane, to prevent the GS from receiving the ball and has previously been reported to successfully deflect or intercept the ball the most out of all positions (van Gogh et al., 2020). This suggests that the jumping demands are critical to executing the tactical requirements for GK and should be prioritised for athletes competing in this position. Past research has used continuous strength and power development, regular countermovement jump (CMJ) testing, Olympic lifting, and plyometric exercises to successfully develop jumping abilities in athletes (Thomas et al., 2017).
To the author's knowledge, this is the first study to investigate the match-to-match variability of the physical positional demands in netball. Table 8 shows that TD was very stable, with CV% falling below 9%. However, maxV and jumping metrics (JC and MJH) displayed greater variability within each position, with CV% ranging from 2% to 34%, confirming the secondary hypothesis. Previous research in soccer, AFL, and rugby league has supported these findings and has reported that measures such as TD, DR, and average velocity are relatively stable, while higher-speed activities show larger variability between matches (Gregsonet al., 2010; Kempton et al., 2015; Rampinini et al., 2007). Running demands are often used as reliable performance measures in netball, as match-play demands similar TD expectations from match to match for each position. However, higher-speed activities show more variation between matches because these activities are all based on the performance and execution of sportspecific movements such as jumping and sprinting (Kempton et al., 2015). Sport-specific movements are hugely influenced by the “flow of play”, which is likely to vary from match to match (Kempton et al., 2015). For example, if the GA and GS collectively score above 90% of all attempts at goal in one match but 60% during the next match, then the result will be a variation in JC and MJH. This is because there are more rebounds for the goal-based positions to compete for after the missed attempts at the goal,resultingin ahigher JC and MJH for thesepositions. Past literature also concluded that players in the same positional groups have similar match-to-match variation, where a difference is seen between each positional group (Kempton et al., 2015; Rampinini et al., 2007). In netball, even players competing in the same positional group are uniquely different to each other based on court restrictions and tactical requirements and whether they are primarily attackers or defenders (Chandler et al., 2014; Davidson & Trewartha, 2008; Graham et al., 2020; Shaw et al., 2020;van Goghetal.,2020).Therefore,thefindingsinthecurrent study suggest that match-to-match performance variation for each position may be based on internal (physical fitness and match preparation) and external factors (game tactics, strength of opposition, and match outcome) and can vary between each positionandplayer(Kemptonetal.,2015;Rampininietal.,2007). Ensuring adequate match preparation and physical fitness strategies are vital to optimising athletic performance throughout match-play (Shaw et al., 2020; van Gogh et al., 2020). However,
a possible internal factor for match-to-match performance variability might be due to physical and psychological fatigue (Rampinini et al., 2007). If a player is not prepared to handle the physical or psychological demands throughout a netball match, match-to-match performance will likely vary (Rampinini et al., 2007). Therefore, further research should investigate the effects of adequate recovery protocols and athlete monitoring strategies that track physical and psychological load and fatigue and their impact on the variability of key performance measures between netball matches competed at a semi-elite level. External factors such as game tactics, strength of opposition, and match outcome may also affect match-to-match performance variability. Teams playing sports at a competitive level will often change game tactics depending on the playing style of who is competing, on a team level and at a positional level (Gregson et al., 2010; Rampinini et al., 2007). For example, a team might decide to play a 'man-to-man' defence, where defenders will defend their opposing player for the entire time the opposition team has possession of the ball, suggesting defenders might require travelling further throughout a match to stay with their opposition attacker. Conversely, game tactics might change to eithertheteam or an individual defending in a zone defence, where players will defend the court space around them instead of directly defending the attacking players, which may mean defenders cover smaller TD throughout match-play. This may result in a variation in performance across different running and jumping metrics from one match to another. Playing against stronger opposition and match outcome pressure may also impact the match-to-match variation throughout a season (Gregson et al., 2010; Rampinini et al., 2007). Past research in soccer concluded that players had a higher TD and completed more high-intensity running when playing against better-quality opposition (Rampinni et al., 2007). For example, when the competition is balanced, and the match outcome is undecided, players are more likely to push themselves to win the game, increasing the physical demands of each position. Alternatively, if the competition is uneven and one team dominates the contest, players are less likely to put in the extra effort, resulting in lower physical demands. In the current study, participants competed at a semi-elite level, all pushing to progress to the elite level, resulting in a high standard of competition in every match (Kempton et al., 2015). The importance was put on achieving and maintaining optimal performance each match to impress elite coaches rather than the importance of winning. Physical demands would likely remain stable throughout the season as performances were often consistent. Further research on the difference in match-to-match variation between competition levels is required to understand fully the impact of internal and external factors on performance.
4.1. Limitations
Netball is a sport involving many impacts that result in an accumulative body load, which measures the number and intensity of sport-specific movements, such as accelerations, decelerations and changes of direction (van Gogh et al., 2020).
The GPS-based accelerometers used for the current study were not indoor-designed accelerometers, which meant they could only accumulate data on metrics measured in the current study. While the GPS-based accelerometers utilised in this study offered
promising insights into the physical demands and positional requirements of each position, using accelerometers designed to measure accelerations, decelerations and change of direction and the extent of these sport-specific movements would offer a more accurate representation of each position's physical demands and accumulative body load during match-play. Using wearable technologythatcanalsomeasureinternaldemands(e.g.,heartrate) alongside physical demands would offer greater insights into the physiological load placed upon each player and whether these demands match the reported physical demands throughout matchplay.
The current study investigated one team competing in an NNL competition, suggesting that itonly represents one team's physical demands and positional requirements and often only one or two players per position. The physical demands reported may be affected by the individual playing style of players competing in each position or game tactics implemented by the coach for each match.Furthermore,eliteplayerswhowerereleased fromtheelite competition to gain more games competed without a GPS, meaning game files for that position were incomplete and excluded from the study. This resulted in some positions having fewer game files to analyse throughout the study, potentially impacting the validity of the accumulated data (McGuiness et al., 2020; Davidson & Trewartha, 2008).
5. Practical applications
The results of this study provide beneficial insights for netballand strength and conditioning coaches, describing both the running and jumping demands during match play and the match-to-match variation of all seven positions for semi-elite female netball players. In addition, information from this study can be used to implement position-specific strength and conditioning programmes for adequate match preparation and to optimise athletic performance.
Based on the findings of this study, position-specific training prescription only needs to be adjusted for running metrics involving TD, except for specific programming for JC, JR, and MJH for players competing in the GK position. All other metrics are more likely to be a general prescription across a team based on each position's court restrictions and positional tactics. For example, C must cover 4700 m across a 60-minute match. For goal-based positions across a 60-minute match, GS must be able to cover 2250 m and GK. However, GK must also jump more times than other positions.
Strength and conditioning programmes should increase position-specific aerobic and anaerobic capacities, perhaps by incorporating maximal aerobic speed training (MAS) for positions restricted to two or three-thirds and interval-based highintensity training (HIIT) for goal-based positions restricted to only one third. Repeated sprint ability training (RSA) should also be incorporated to promote high-speed-running activities and optimal recovery between high-intensity bouts. Countermovement jump tests and repeated countermovement jump initiatives should be implemented into strength and conditioning programmes, especially for the GK. The introduction of recovery strategies and athlete monitoring protocols to promote adequate recovery between matches should be utilised to optimise performance.
6. Conclusion
The current study describes the position-specific physical demands and the match-to-match variability of semi-elite female netball players across a single season. Team coaches and strength and conditioning coaches will be able to use the information from this study to help develop position-specific training programmes to ensure athletes are adequately prepared to handle the physical demands of netball at the semi-elite level and to enhance the athletic performance of these athletes. Strength and conditioning coaches will also be able to select reliable and accurate performance measures during match-play and interpret meaningful changes in performance through the match-to-match variation presented in this study. This will allow a better replication of match-play demands in training, adequately preparing athletes for competition, and set accurate performance measures or key performance indicators to optimise performance from match to match. This study also provides valuable insights into the physical demands required for netballers competing at the youth and U19 levels to progress to the semi-elite level as a stepping-stone en route to the elite level.
Conflict of Interest
The authors declare no conflict of interest
References
Bailey, J. A., Gastin, P. B., Mackey, L., & Dwyer, D. B. (2017). The player load associated with typical activities in elite netball. International Journal of Sports Physiology and Performance, 12(9), 1218–1223. https://doi.org/10.1123/ijspp.2016-0378
Bardzinski, T., Dwyer, D., Young, C., Piromalli, L., & Bruce, L. (2021). Load variations in high-performance netballers across seasons and competition levels. International Journal of Performance Analysis in Sport, 21(4), 589–599. https://doi.org/10.1080/24748668.2021.1929794
Best, R., & Standing, R. (2019). Feasibility of the global positioning system to assess the spatiotemporal characteristics of polo performance. Journal of Equine Veterinary Science, 79, 59–62.
Brooks, E. R., Benson, A. C., Fox, A. S., & Bruce, L. M. (2020). Physical movement demands of elite-level netball match-play as measured by an indoor positioning system. Journal of Sports Sciences, 38(13), 1488–1495. https://doi.org/10.1080/02640414.2020.1745504
Bruce, L., Farrow, D., & Raynor, A. (2012). How specific is domain specificity: Does it extend across playing position? Journal of Science and Medicine in Sport, 15(4), 361–367. https://doi.org/10.1016/j.jsams.2011.11.255
Chandler,P.T.,Pinder,S.J.,Curran,J.D.,&Gabbett,T.J.(2014). Physical demands of training and competition in collegiate netball players. Journal of Strength and Conditioning Research, 28(10), 2732–2737. https://doi.org/10.1519/jsc.0000000000000486
Cohen, J. (2013). Statistical power analysis for the behavioral sciences (2nd ed.). Routledge.
Cormack, S. J., Smith, R. L., Mooney, M. M., Young, W. B., & O’Brien, B. J. (2014). Accelerometer load as a measure of activity profile in different standards of netball match play. International Journal of Sports Physiology and Performance, 9(2), 283–291. https://doi.org/10.1123/ijspp.2012-0216
Cummins, C., Orr, R., O’Connor, H., & West, C. (2013). Global positioning systems (GPS) and microtechnology sensors in team sports: A systematic review. Sports Medicine, 43(10), 1025–1042. https://doi.org/10.1007/s40279-013-0069-2
Davidson, A., & Trewartha, G. (2008). Understanding the physiological demands of netball: A time-motion investigation. International Journal of Performance Analysis in Sport, 8(3), 1–17. https://doi.org/10.1080/24748668.2008.11868443
Delves, R. I., Bahnisch, J., Ball, K., & Duthie, G. M. (2021). Quantifying mean peak running intensities in elite field hockey. JournalofStrengthandConditioningResearch,35(9), 2604–2610. https://doi.org/10.1519/jsc.0000000000003162
Fox, A., Spittle, M., Otago, L., & Saunders, N. (2013). Activity profiles of the Australian female netball team players during international competition: Implications for training practice. Journal of Sports Sciences, 31(14), 1588–1595. https://doi.org/10.1080/02640414.2013.792943
Gabbett, T. J., Nassis, G. P., Oetter, E., Pretorius, J., Johnston, N., Medina, D., Rodas, G., Myslinski, T., Howells, D., Beard, A., & Ryan, A. (2017). The athlete monitoring cycle: A practical guide to interpreting and applying training monitoring data. British Journal of Sports Medicine, 51(20), 1451–1452. https://doi.org/10.1136/bjsports-2016-097298
Graham, S., Zois, J., Aughey, R., & Duthie, G. (2020). The peak PlayerLoad™ of state-level netball matches. Journal of Science and Medicine in Sport, 23(2), 189–193. https://doi.org/10.1016/j.jsams.2019.09.014
Gregson, W., Drust, B., Atkinson, G., & Salvo, V. (2010). Matchto-match variability of high-speed activities in Premier League soccer. International Journal of Sports Medicine, 31(4), 237–242. https://doi.org/10.1055/s-0030-1247546
Hopkins, W. G., Marshall, S. W., Batterham, A. M., & Hanin, J. (2009). Progressive statistics for studies in sports medicine and exercise science. Medicine & Science in Sports & Exercise, 41(1), 3–12. https://doi.org/10.1249/mss.0b013e31818cb278
Jennings, D., Cormack, S., Coutts, A. J., Boyd, L., & Aughey, R. J. (2010). The validity and reliability of GPS units for measuring distance in team sport-specific running patterns. International Journal of Sports Physiology and Performance, 5(3), 328–341. https://doi.org/10.1123/ijspp.5.3.328
Kempton, T., Sirotic, A. C., & Coutts, A. J. (2014). Betweenmatch variation in professional rugby league competition. Journal of Science and Medicine in Sport, 17(4), 404–407. https://doi.org/10.1016/j.jsams.2013.05.006
Kempton,T., Sullivan, C., Bilsborough,J. C., Cordy, J.,& Coutts, A. J. (2015).Match-to-match variation inphysical activity and technical skill measures in professional Australian football. Journal of Science and Medicine in Sport, 18(1), 109–113. https://doi.org/10.1016/j.jsams.2013.12.006
Mackay, L., Jones, B., Owen,C., Sawczuk, T., White, R., Denton, K., & Whitehead, S. (2024). Movement characteristics of international and elite domestic netball players during matchplay. International JournalofPerformance Analysis in Sport,
25(1), 144–161. https://doi.org/10.1080/24748668.2024.2303893
McGuinness, A., Malone, S., Petrakos, G., & Collins, K. (2019). Physical and physiological demands of elite international female field hockey players during competitive match play. Journal of Strength and Conditioning Research, 33(11), 3105–3113. https://doi.org/10.1519/jsc.0000000000002158
McGuinness, A., Passmore, D., Malone, S., & Collins, K. (2020). Peak running intensity of elite female field hockey players during competitive match play. Journal of Strength and Conditioning Research, 36(4), 1064–1070. https://doi.org/10.1519/jsc.0000000000003582
Paradisis, G. P., Bissas, A., Pappas, P., Zacharogiannis, E., Theodorou, A., & Girard, O. (2019). Sprint mechanical differences at maximal running speed: Effects of performance level. Journal of Sports Sciences, 37(17), 2026–2036. https://doi.org/10.1080/02640414.2019.1616958
Rampinini, E., Coutts, A., Castagna, C., Sassi, R., & Impellizzeri, F. (2007). Variation in top-level soccer match performance. InternationalJournalofSportsMedicine,28(12), 1018–1024. https://doi.org/10.1055/s-2007-965158
Russell, S., Jenkins, D., Halson, S., & Kelly, V. (2020). Changes in subjective mental and physical fatigue during netball games inelitedevelopmentathletes. JournalofScienceandMedicine in Sport, 23(6), 615–620. https://doi.org/10.1016/j.jsams.2019.12.017
Shaw, M. L., Coetzee, F. F., Schall, R., & Kraak, W. J. (2020). Time-motion analysis of elite under-19 female netball players using GPS. South African Journal for Research in Sport, Physical Education & Recreation, 42(1), 57–70. http://hdl.handle.net/11660/8704
Spencer, M., Lawrence, S., Rechichi, C., Bishop, D., Dawson, B., & Goodman, C. (2004). Time–motion analysis of elite field hockey, with special reference to repeated-sprint activity. Journal of Sports Sciences, 22(9), 843–850. https://doi.org/10.1080/02640410410001716715
Standing, R. J., & Maulder, P. S. (2017). The biomechanics of standing start and initial acceleration: Reliability of the key determining kinematics. Journal of Sports Science & Medicine, 16(1), 154–162. https://www.ncbi.nlm.nih.gov/pmc/articles/PMC5358026/
Taylor, J. B., Wright, A. A., Dischiavi, S. L., Townsend, M. A., & Marmon, A. R. (2017). Activity demands during multidirectionalteam sports:Asystematicreview. SportsMedicine, 47(12), 2533–2551. https://doi.org/10.1007/s40279-0170772-5
Thomas, C., Comfort, P., Jones, P. A., & Dos’Santos, T. (2017). Strength and conditioning for netball: A needs analysis and training recommendations. Strength & Conditioning Journal, 39(4), 10–21. https://doi.org/10.1519/ssc.0000000000000287
Thornton, H. R., Delaney, J. A., Duthie, G. M., & Dascombe, B. J. (2019). Developing athlete monitoring systems in team sports: Data analysis and visualisation. International Journal of Sports Physiology and Performance, 14(6), 698–705. https://doi.org/10.1123/ijspp.2018-0169
van Gogh,M. J., Wallace, L.K., & Coutts, A. J. (2020).Positional demands and physical activity profiles of netball. Journal of Strength and Conditioning Research, 34(5), 1422–1430. https://doi.org/10.1519/jsc.0000000000002388
Gascoigne et al. / The Journalof Sport and Exercise Science, Journal Vol. 9, Issue 1, 21-33 (2025)
White, A. D., & MacFarlane, N. (2013). Time-on-pitch or fullgame GPS analysis procedures for elite field hockey? International Journal of Sports Physiology and Performance, 8(5), 549–555. https://doi.org/10.1123/ijspp.8.5.549
Wylde, M. J., Lee, B. C., CheeYong, L., & Callaway, A.J. (2018). Reliability and validity of GPS-embedded accelerometers for the measurement of badminton-specific player load. Journal of Trainology, 7(2), 34–37. https://doi.org/10.17338/trainology.7.2_34
Yong, L. C., Wylde, M. J., Choong, G. C., & Lim-Prasad, D. (2015). Activity profiles in adolescent netball: A combination
of global positioning system technology and time-motion analysis. Journal of Human Sport and Exercise, 10(Special Issue 2), S86–S95. https://doi.org/10.14198/jhse.2015.10.proc2.10
Young, C. M., Gastin, P. B., Sanders, N., Mackey, L., & Dwyer, D. B. (2016). Player load in elite netball: Match, training, and positional comparisons. International Journal of Sports Physiology and Performance, 11(8), 1074–1079. https://doi.org/10.1123/ijspp.2015-0156
The Journal ofSport and Exercise Science, Vol. 9, Issue 1, 34-42 (2025)
www.jses.net
Riskoflowenergyavailabilityandlevelofnutritionknowledgeinrecreational trail runners in Aotearoa/New Zealand
Tina Buch1 , Kathryn L. Beck1 , Ryan Tam2, Janelle Gifford3, Claire E. Badenhorst1*
1Schoolof Sport, Exercise and Nutrition, Massey University, New Zealand
2Faculty of Health Sciences, Australian Catholic University, Australia
3Faculty of Medicine and Health, The University of Sydney, Australia
Received: 16.04.2025
Accepted: 29.05.2025 Online: 10.10.2025
Keywords:
Energy Availability
Sports Performance
Nutrition Knowledge
1. Introduction
Researchonlowenergyavailability(LEA)hasprimarilybeenundertakenintrackandfield and cross-country endurance runners, but not specifically in trail runners. The aim of this studywastodeterminetheriskofproblematicLEAprevalenceinrecreationaltrailrunners in Aotearoa/New Zealand and investigate associations with nutrition knowledge. Risk of problematic LEA and nutrition knowledge were assessed using validated questionnaires: the Low Energy Availability in Females Questionnaire (LEAF-Q), the Low Energy Availability in Males Questionnaire (LEAM-Q), and the Platform for Evaluating Athlete Knowledge in Sports Nutrition Questionnaire (PEAKS-NQ). Demographics and trailrunningexperiencequestionswereintegratedintothesurvey.Comparisonsbetweengroups (e.g., ‘low LEA risk’ vs. ‘LEA risk’) were performed using a chi-square testforcategorical variables,andanindependentsamplest-testforcontinuousvariables.Thefinalsamplewas 217 (140 females,42.0 ± 10.7 years; 77 males,47.9 ± 12.1 years) forthe LEAF-Q, LEAMQ, and trail running questions; and 152 for the PEAKS-NQ. Thirty-one percent of females were classified as ‘LEA risk’. Twenty-three percent of males were identified as having low sex drive, a marker of LEA risk. There was no difference between nutrition knowledge scores and risk of problematic LEA in both sexes. Sports nutrition knowledge sections in which participants scored poorly included the use of supplements, strategies for gaining lean mass, and fuelling during events. The findings suggest that recreational trail runners are at risk of problematic LEA and nutrition results showed that our cohort might benefit from more sports-specific nutrition education.
Trail running is increasing in popularity with an annual growth in participation of 15% since the mid-1990s (World Athletics, 2021). This endurance sport is characterised by high exercise energy expenditure (EEE) which can be exacerbated as events often take place in extreme environments and have long event durations (e.g., 171 km and 10,000 m of positive elevation gain in Ultra-Trail du Mont-Blanc) (Scheer et al., 2020). Distance runners including trail runners, tend to have high training volumes and participate in multiple events throughout the year (Melin et al., 2019). Trail runners therefore need to ensure they have sufficient energy intake (EI)tosupportbothtrainingandphysiologicalfunctionsandensure
adequateenergyavailability(EA)(Melin etal.,2019).Failure todo so may result in the athlete entering a state of low energy availability (LEA) which if severe or prolonged may lead to an increased risk of problematic LEA. Unlike adaptable LEA, problematic LEA can have a multitude of health, physiological and performance consequences as defined by the syndrome, Relative Energy Deficiency in Sport (REDs) (Mountjoy et al., 2023).
Athletes who participate in weight-sensitive sports like running may be at increased risk of problematic LEA because leanness is seen as favourable for performance (Kuikman & Burke, 2023). Therefore, trail running athletes may feel pressure to maintain a leanphysiquewhichcanleadtointentionalunderfuelling.Distance runners, such as trail runners, also frequently have periods of
*Corresponding Author: Claire Badenhorst, School of Sport, Exercise and Nutrition, Massey University, New Zealand, c.badenhorst@massey.ac.nz
intensetrainingthroughouttheyearwheretheymayunintentionally fail to meet their required EI (Kuikman & Burke, 2023) and may experience exercise induced appetite suppression resulting in inadequate EI around training (Loucks, 2007). These factors put trail runners at a higher risk of problematic LEA.
Previous research in runners has reported the prevalence of problematic LEA of 19–80% in females (Jesus et al., 2021; Karlsson et al., 2023) and 10–54% in males (Høeg et al., 2022; Jesus et al., 2021). While most research has been undertaken with elite athletes, the risk of problematic LEA prevalence has also been evidenced in recreational runners (Dervish et al., 2023; Karlsson et al., 2023). Other studies have similarly reported that recreational exercisersmaybeatanincreasedriskofproblematicLEAwithrisk prevalence rates of 40–45% (Logue et al., 2019; Slater et al., 2016). Previous research has identified possible risk factors for problematic LEA in athletes including but not limited to age, education, body mass index (BMI), weekly training volume, level of experience, and nutrition knowledge (Dervish et al., 2023; Jesus et al., 2021; Magee et al., 2020; Slater et al., 2016). Having appropriate knowledge and skills to optimise nutrition for training and performance may help reduce the risk of problematic LEA (Kuikman & Burke, 2023); however, recreational athletes do not have the same access to support staff such as coaches and nutritionists as elite athletes (Slater et al., 2016; Stellingwerff et al., 2021).
Few studies have investigated the relationship between problematic LEA risk and nutrition knowledge in recreational athletes, with results inconclusive (Burger et al., 2024; Magee et al., 2020), and to our knowledge have not been investigated in recreational trail runners. Therefore, this study aims to (a) determine the prevalence of recreational trail runners at risk of problematic LEA in Aotearoa/New Zealand; (b) describe associations between risk of problematic LEA and demographic factors (e.g., age, education, BMI, weekly training hours, and level of experience); and (c) determine the association between general/sports nutrition knowledge and problematic LEA risk.
2. Methods
2.1.
Participants and recruitment
This study was conducted with recreational trail runners in Aotearoa/NewZealand.Recruitmentwasdonewiththeassistanceof two key New Zealand trail organisations: Total Sport and Wild Things who shared the recruitment advertising through email newslettersandsocialmediaplatforms.Data werecollectedbetween JuneandDecember2022.Participantscompletedanonlinescreening questionnaire to determine eligibility, and if eligible, they then were asked to read an information sheet and complete an online consent form. Eligibility criteria included being 16 years or over, based in Aotearoa/New Zealand, and training for trail running or walking at least 2½ hours per week (including running/walking and other exercise such as strength training). This cut-off was based on the minimal physical activity recommendations for adults (Ministry of Health, 2023). After signing the consent form, participants were asked to complete two anonymous online surveys, hosted on the QualtricsXM Survey Software (Qualtrics, Provo, UT). The study received ethics approval from the Massey University Human Ethics Committee: Northern (22/24).
2.2. Study design and questionnaires
This cross-sectional study used two online surveys comprised of validated questionnaires that assessed problematic LEA risk (Lundy et al., 2022; Melin et al., 2014) and general and sports nutrition knowledge (Tam et al., 2021a). The anonymous online surveys were in two parts: Part 1 was comprised of demographic and general trail running questions (e.g., weekly training hours, level of experience) and concluded with the Low Energy Availability in Females/Males Questionnaires (LEAF-Q/LEAMQ), and Part 2 consisted of the Platform for Evaluating Athlete Knowledge in Sports Nutrition Questionnaire (PEAKS-NQ). All responses collected were anonymous and no personal identification data were collected from participants.
2.3. Low Energy Availability in Females Questionnaire
The LEAF-Q is a validated 25-item questionnaire to assess the relative risk of problematic LEA in female athletes (Melin et al., 2014). The LEAF-Q consists of three sections, (i) injuries; (ii) gastrointestinal function; and (iii) menstrual function and use of contraceptives.TheLEAF-Qshouldonlybeusedtoidentifythose at low risk of problematic LEA (Rogers et al., 2021). Participants scoring < 8 were considered to have a low risk of consequences associated with problematic LEA (i.e., ‘low LEA risk’). Participants scoring ≥ 8 were classified as ‘LEA risk. Minor edits to sentence structure were made to enhance the readability and understanding of the questionnaire.
2.4. Low Energy Availability in Males Questionnaire
The LEAM-Q is a 42-item questionnaire developed based on the LEAF-Q to measure symptoms of problematic LEA in males (Lundy et al., 2022). Questions cover those related to dizziness, gastrointestinal function, thermoregulation, injury and illness, wellbeing,recovery(including fatigue,fitness,sleep,andrecovery), energy levels, and sex drive. A multi-country validation study with males from different sports; however, found that thermoregulation and sleep were not related to any clinical markers, and only the sex drive questions were able to distinguish between problematic LEA cases and controls (Lundy et al., 2022). The sex drive section included four questions about general sex drive and morning erections and were ranked on a 4-point Likert scale. Low sex drive was identified as scoring ≥ 2 on “sex drive in general” or ≥ 2 on “the number of morning erections” and ≥ 1 for “morning erections compared to normal” (a higher score indicated lower sex drive). These results were then grouped into either low or normal libido andservedasanindicatorofsymptomsofproblematicLEA.Inthis study, we included all sections apart from thermoregulation and sleepintheonlinequestionnaire,andusedonlythesexdrivesection to assess the risk of problematic LEA as per Lundy et al.’s (2022) scoring criteria.
2.5. Platform for Evaluating Athlete Knowledge in Sports Nutrition Questionnaire
The PEAKS-NQ is a 50-item online instrument measuring general and sports nutrition knowledge which has been validated in Australian and New Zealand athletes (Tam, et al.,2021a).It has
a maximum scoreof75 across the two sections. The questionnaire is unique in that it visually uses pictures and food photography to improve understanding of the questions (https://sportsnutritionassessment.com/peaks-nq).
2.6. Statistical analysis
Forthisstudy,asamplesizeof194wascalculatedwithanexpected power of 80% and an alpha level of p < 0.050 (Hopkins, 2006). DatawasexportedtoSPSSversion29(IBMStatistics)foranalysis. NormaldistributionofdatawasassumedbasedontheCentralLimit Theorem. Descriptive statistics are presented as mean ± standard deviation. Independent samples t-tests were used to compare betweengroups(e.g.,‘lowLEArisk’vs.‘LEArisk’)forcontinuous variables, and chi-square tests to compare categorical variables. Statistical significance was set at a level of p < 0.050.
3. Results
Two hundred and fifty-nine trail runners completed the survey of which 42 responses were excluded due to duplicate or incomplete responses. The sample characteristics of 217female and maletrail runners by categorisation of either low LEA risk or LEA risk are presented in Table 1. Participants were predominantly of New Zealand European ethnicity (female 81.2%; male 92.2%), and most participants (97.0% of females; 90.2% of males) had completed tertiary education. The majority of female (91.4%) and male (83.1%) participants regularly did other training activities such as strength training (81.0%) and flexibility (50.4%) for females, and strength training (68.3%) and cycling (65%) for males.
Level of trail runner: Beginner Beginner-Intermediate
Years trail running: < 1 year
1 year to 4 years 11 months
5 years to 9 years 11 months 10
Usual trail event distances†:
Short (5–9 km)
Mid (10–15 km)
Long (16–21 km)
Super long (21.1–42.2 km)
Ultra (42.3+ km)
100 km
100 miler
24-hour races
Other
Notes: Values are presented as mean ± standard deviation; frequencies (percentages) †Multiple response option; # Missing data for PEAKS-NQ resulting in n = 101 female, n = 51 male *Difference between low LEA risk and LEA risk (p < 0.050)
A total of 43 female participants (30.7%) and 18 male participants (23.4%) were classified with LEA risk according to the LEAF-Q/LEAM-Q scoring systems. Table 2 shows the total scores of each LEAF-Q/LEAM-Q section for female and male participants. The percentage of females with LEA risk did not differ greatly when females on hormonal contraception were
2: Risk of low energy availability (LEAF-Q/LEAM-Q).
Overall scores:
Sectional scores:
excluded from the analysis (30.2%). Females with low LEA risk had significantly lower mean scores on all three sections of the LEAF-Q. For males with low LEA risk, significantly lower scores on the LEAM-Q were found in the gastrointestinal, fatigue, recovery, energy levels, and sex drive sections.
Note: Values are presented as mean ± standard deviation; HC = hormonal contraception LEAF-Q score: Low LEA risk < 8; LEA risk ≥ 8; LEAM-Q score: LEA risk = low sex drive score (≥ 2 on “Sex drive in general” or ≥ 2 on “The number of morning erections” and ≥1 for “Morning erections compared to normal”) *Difference between low LEA risk and LEA risk (p < .05); **Difference between low LEA risk and LEA risk (p < 0.001).
Education, BMI, weekly training hours, and level of trail running experience did not differ between trail runners with LEA risk or low LEA risk. Compared to females with low LEA risk, females with LEA risk were younger (38.0 ± 12.6 vs. 43.6 ± 9.5, p = 0.038) and more likely to report a weight change in the last six months (75.9% vs. 40.3%, p = 0.001). Males with low LEA risk more readily reported a chronic illness (23.5% vs. 6.8%, p = 0.047) or food allergy/intolerance (27.7% vs. 8.6%, p = 0.036), when compared to male participants with LEA risk.
A total of 101 female and 51 male participants completed PEAKS-NQ (Part 2). Nutrition knowledge scores are presented in
Table 3. Female participants were more likely to have received previous nutrition education (52.5%) compared to their male counterparts (27.5%). There were no differences found between LEA risk and general/sports nutrition knowledge scores for either females (p = 0.283) or males (p = 0.194). Participants scored highestonidentifyingtherolesofmicronutrients,foodgroupsand training/competing in hot environments and lowest on understanding the roles of fat, and fuel for during events (Figure 1 and 2).
Note. Values are presented as mean ± standard deviation
Identifying the roles of micronutrients
Food groups
Identifying the roles of macronutrients
Identifying macronutrients in food
Identifying food sources of iron
Identifying food sources of calcium
Understanding the roles of fat
by participants
Training/competing in hot environments
Strategies for decreasing body fat
Consequences of low carbohydrate availability
Selecting recovery meals & nutrients
Identifying signs of dehydration
Safe use of vitamins, minerals and supplements
Strategies for gaining lean mass
Fuel for during events
4. Discussion
To our knowledge, this is the first study to investigate the prevalence of recreational trail runners at risk of problematicLEA in Aotearoa/New Zealand and associations between nutrition knowledge and problematic LEA risk. Approximately one-third (30.7%) of female and one-quarter (23.4%) of male participants were classified with problematic LEA risk when assessed through LEAF-Q and LEAM-Q respectively. Yet despite this high risk of problematic LEA, there was no difference between LEA risk and nutrition knowledge scores.
When comparing our results on problematic LEA risk to other studies in female athletes using the LEAF-Q, results vary. There were a higher proportion of female athletes in the present study with problematic LEA risk than the 19% recently reported in recreational female runners by Karlsson et al. (2023) and lower than the 45% reported by Dervish et al. (2023) in recreational female endurance runners. Similarly to Dervish et al. (2023), this current study recruited participants based on the volume of training hours which may help explain the difference between the results of these two studies and Karlsson et al. (2023) which did not have a weekly training cut-off. Endurance runners are often suggested to be at the highest risk of problematic LEA due to the high EEE(Folscher et al., 2015; Loucks,2007). However, itcould be expected that trail runners are at an even higher risk of problematic LEA due to the added challenges of extended race and training duration and environmental extremes (Scheer et al., 2020). Differences in training volume may have influenced prevalence rates between studies. Both the current study and Dervish et al. (2023) where higher prevalence rates were reported included runners who were training for longer events and therefore may be expected to have higher training volumes vs. the Karlsson et al. (2023) study where a lower prevalence was reported with participants in group running sessions and potentially lower training volumes.
The prevalence of problematic LEA risk has been more extensively investigated in females compared with males making direct comparisons for our results on male trail runners difficult. Additionally, a key difference is the age of the participants in the original validation study (Lundy et al, 2022; 27.9 ± 6.9 years) and the three published studies to date using the LEAM-Q (Lichtenstein et al., 2024; Mathisen et al., 2022; Vardardottir et al., 2023; mean age approximately 20–24 years old), whereas the participants in the current study were older (47.9 ± 12.1 years).
Increasing age could affect the LEAM-Q sex drive scores as older males may be more likely to experience erectile dysfunction and lowered libido (Hackney et al., 2017). However, results in the current study indicated a similar prevalence of male trail runners at risk of problematic LEA based on low sex drive (23.4%) was almost identical to that reported in the LEAM-Q validation where 23.7% of participants in both weight sensitive and non-weight sensitive sports were categorised as having low sex drive (Lundy et al., 2022). The other studies have reported problematic LEA risk prevalence rates of 16% (15 sporting disciplines, n = 300 elite/sub-elite), 93% (professional dancers, n = 14) and 33% (5 sporting disciplines, n = 27 elite/sub-elite), respectively. Lichtenstein et al. (2024) and Vardardottir et al. (2023) included a wide range of disciplines in their studies, including aesthetic, weight category, power and endurance sports which would
account for the wide variation in prevalence. Two studies had relatively small sample sizes which may not have been sufficiently powered to effectively capture problematic LEA risk. This current investigation found that education, BMI, weekly training hours and level of trail running experience did not differ between trail runners with LEA risk or low LEA risk in bothsexes. Females with LEA risk were younger, an outcomethat alignswith Dervish et al. (2023) who reported that LEAF-Q scores differed based on age. In this previous research, a higher proportion of female athletes in the 18–24 years age group presented with a risk of problematic LEA compared to older age groups. Many studies have also failed to show an association between age and problematic LEA risk in recreational female athletes (Karlsson et al., 2023; Logue et al., 2019; Slater et al., 2016). However, the LEAF-Q was originally validated in a cohort of younger female athletes aged 26.6 ± 5.4 years (Melin et al., 2014) and it is worth noting that gynaecological age has been found to be associated with occurrence of ovulatory cycles, with the highest rates observed in individuals 12+ years post menarche (Liu et al.,2020). Thus, age could be a factor that affects the LEAF-Q results, specifically results related to menstrual cycle disruption. It is possiblethatthehighermeanage(likely12+yearspostmenarche) of female participants in this current study (42.0 ± 10.7 years) and Karlsson et al.’s (2023) study (32.4 ± 4.3 years) could partially explain the lower risk prevalence rates when compared to other studies in recreational exercisers with a lower mean age (approximately 23–24 years, approximately 10 years post menarche) (Black et al., 2018; Slater et al., 2016). The authors did note that 43% of the participants were over the age of 45 years. During peri- and post-menopause (average age 45–55 years), natural declines in reproductive function and reproductive hormones will reduce theoccurrenceofmenstrualbleeds andalter menstrual function (Sims, et al., 2023) which may mean that problematic LEA is over-represented when using the LEAF-Q in this group. Folscher et al. (2015) reported that menstrual dysfunction was not a useful screening tool for many older female ultramarathon athletes (mean age 39.5 ± 7.8 years) due to Mirena (hormonal intrauterine device) use or postmenopausal status. Results of problematic LEA risk in this study may need to be interpreted with caution as LEAF-Q may not be sensitive in determining LEA risk in older females.
Recent weight change may signal LEA risk. Our female participants with LEA risk were more likely to report a weight change in the last six months (75.9% vs. 40.3%). Similarly, Jesus et al. (2021) reported that athletes (male and female) reporting a weight change in the previous three months were more likely to be at risk of problematic LEA when compared to those whose weight did not change (70.8% vs. 57.4%). While the direction of weight change was not reported in both these studies, a strong motivation for an individual’s involvement in endurance running can be weight control in females (Folscher et al., 2015). Female endurance athletes are also recognised to be at a higher risk for eating disorders (ED)/disordered eating (DE) (Karlsson et al., 2023), factors that may contribute to the association between problematic LEA risk and weight change. Of note, the risk of ED/DE was not assessed in this present study; however, the addition of ED/DE to future research may need to be considered when assessing problematic LEA risk in female athletes/runners.
Our results showed that male participants with LEA risk more readily reported a chronic illness (23.5% vs. 6.8%) or food
allergy/intolerance (27.7% vs. 8.6%) compared to males with low LEA risk. Research on problematic LEA risk and associations with chronic diseases and/or food allergies/intolerances are limited (Fahrenholtz et al., 2022). It is possible that the risk of problematic LEA increases in athletes with food allergies/intolerances as these conditions commonly result in dietary restriction and hence increase the risk of under fuelling for sports performance (Lis et al.,2016). In this current study, itcould be speculated that athletes who reported food allergies or intolerances are not familiar with finding suitable dietary alternatives to compensate for potential nutritional deficiencies resulting in unintentional under fuelling. However, the causality between the risk of problematic LEA and food allergies/intolerances cannot be determined in a cross-sectional study. Future research may be needed in this area.
In this current study, we found no difference between problematic LEA risk and nutrition knowledge scores for either females or males. Similar results have been reported in other studies investigating the relationship between problematic LEA risk and nutrition knowledge in female cross-country runners and team sport athletes (Olcott & Anstrom, 2020; Pai, 2023). Magee et al. (2020) reported that female collegiate soccer athletes with problematic LEA scored lower on the sports nutrition knowledge questions compared to athletes without problematic LEA (40.9 ± 10.4% vs. 52.4 ± 9.8%), suggesting that lower nutrition knowledge may influence the adequacy of nutrition intake in collegiate female soccer players. A more recent pilot study found that female collegiate athletes at risk of problematic LEA had higher nutrition knowledge scores compared to athletes classified as low risk (47.1% vs 41.2%) (Burger et al., 2024). Here the authors speculated that female athletes at risk of problematic LEA purposefully increase their nutrition knowledge to be able to intentionally restrict their food intake to manipulate body composition. Intention for engagement with programs that may increase nutrition knowledge has not been well investigated in previous research investigating problematic LEA risk.
Levels of nutrition knowledge between studies vary due to the range of assessment tools that have been used (Tam et al., 2019). In this current study of recreational trail runners, the mean overall nutrition knowledge score was 70.9% ± 11.0% which is comparable to the 70.7% ± 10.5% reported by Tam et al. (2021b) in a cohort of elite athletes from a variety of sports. While studies have shown that education can increase sports nutrition knowledge (Fahrenholtz et al., 2023; Tam et al., 2019), a higher level of sports nutrition knowledge only has a weak positive association with better diet quality (Fahrenholtz et al., 2023; Janiczak et al., 2022). Kuikman and Burke (2023) reported that athletes (such as trail runners) may unintentionally reduce EA. There are likely to be changes to EEE throughout training and the competitive seasons which if not accounted for with changes to EI can increase risk of problematic LEA (Kuikman & Burke, 2023). This is maybe further supported by a recent study by Henninger et al. (2023) which showed that 47.6% of trail runners failed to meet fuelling recommendations for events longer than 2.5 hours. Therefore, the findings from this current study that trail runners had lower sports nutrition knowledge scores specific to how to fuel during events, could be a key factor in helping to prevent under fuelling in recreational trail runners. However, with no differencebetween generalor sportnutritionknowledge scores and risk of problematic LEA future research on whether
nutritional knowledge is associated with EI and subsequently problematic LEA risk is required.
The strengths of the study include the use of three previously validated instruments (i.e., LEAF-Q, LEAM-Q, and PEAKS-NQ) In addition, the study was sufficiently powered, and the large sample comprised a single sport discipline (i.e., trail runners) However, the study does have certain limitations which must be acknowledged. First, the participants were self-selected via online recruitment which is subject to selection bias since people with greater interest in the topic may choose to participate. The online survey was self-administered which is subject to memorybias and underreporting and could influence answers to questions of a more sensitive nature (e.g., around menstrual dysfunction and morning erections and sex drive). The study used two separate, but linked surveys which may have contributed to the drop-off of some responses on the PEAKS-NQ. The nutrition knowledge questions in the PEAKS-NQ were developed without problematic LEA risk in mind. The survey period was following the Covid-19 lockdown period in Aotearoa/New Zealand which was known to affect training volume and type in many sports (Washif et al., 2022). Finally, while this study did use validated instruments to assess problematic LEA risk, these instruments have only been validated in younger athletes (Lundy et al., 2022; Melin et al., 2014; Rogers et al., 2021) and so may lack sensitivity to assess problematic LEArisk in the older populationof this current study. Future research may consider the development of an instrument to measure LEA in older athletes. In addition, the LEAM-Q has only recently been developed and currently only the sex drive section is validated for determining problematic LEA risk. Hence, the findings from this current study on problematic LEA risk in males should be interpreted with caution.
In conclusion, female and male recreational trail runners are a group of active individuals who present as being at higher risk of problematic LEA. In females, problematic LEA risk was associated with being younger and reporting a weight change in the last six months, whereas for males’ problematic LEA risk was associated with reporting a chronic illness or food allergy/intolerance. There was no difference found between problematicLEAriskandnutritionknowledgescoresineithersex. Recreational trail runners may benefit from more sports-specific nutrition education that focuses on the performance implications of appropriately fuelling for trail events of varying distances.
Conflict of Interest
The authors declare no conflict of interests.
Acknowledgment
We thank Total Sport and Wild Things for their assistance with participant recruitment, and Dr Bronwen Lundy for supporting us with the LEAM-Q. We thank the contributions of all participating athletes for taking the time to participate
References
Black, K., Slater, J., Brown, R. C., & Cooke, R. (2018). Low energy availability, plasma lipids, and hormonal profiles of recreational athletes. Journal of Strength & Conditioning
Buch et al. / TheJournal of Sport and Exercise Science, Journal Vol. 9, Issue 1, 34-42 (2025)
Research, 32(10), 2816–2824. https://doi.org/10.1519/JSC.0000000000002540
Burger, S., Bray, A., & Kim, B. (2024). The relationship between nutrition knowledge and low energy availability risk in collegiate athletes. Journal of Science and Medicine in Sport, 27(7), 451–453. https://doi.org/10.1016/j.jsams.2024.03.010
Dervish, R. A., Wilson, L. J., & Curtis, C. (2023). Investigating the prevalence of low energy availability, disordered eating and eating disorders in competitive and recreational female endurance runners. EuropeanJournalofSportScience,23(5), 869–876. https://doi.org/10.1080/17461391.2022.2079423
Fahrenholtz, I. L., Melin, A. K., Garthe, I., Hollekim-Strand, S. M., Ivarsson, A., Koehler, K., Logue, D., Lundström, P., Madigan, S., Wasserfurth, P., & Torstveit, M. K. (2023). Effects of a 16-week digital intervention on sports nutrition knowledge and behavior in female endurance athletes with risk of relative energy deficiency in sport (REDs). Nutrients, 15(5), 1–20. https://doi.org/10.3390/nu15051082
Fahrenholtz, I. L., Stenling, A., Torstveit, M. K., Melin, A. K., Wasserfurth, P., Koehler, K., Logue, D., Madigan, S., Garthe, I., Gräfnings, M., & Lichtenstein, M. B. (2022). Risk of low energy availability, disordered eating, exercise addiction, and food intolerances in female endurance athletes. Frontiers in Sports & Active Living, 4, 1–11. https://doi.org/10.3389/fspor.2022.869594
Folscher, L.-L., Grant, C. C., Fletcher, L., & Janse van Rensberg, D. C. (2015). Ultra-marathon athletes at risk for the female athlete triad. Sports Medicine - Open, 1(1), 1–8. https://doi.org/10.1186/s40798-015-0027-7
Hackney, A. C., Lane, A. R., Register-Mihalik, J., & OʼLeary, C. B. (2017). Endurance exercise training and male sexual libido. Medicine & Science in Sports & Exercise, 49(7), 1383–1388. https://doi.org/10.1249/mss.0000000000001235
Henninger, K., Pritchett, K., Brooke, N. K., & Dambacher, L. (2023). Low energy availability, disordered eating, exercise dependence, and fueling strategies in trail runners. International Journal of Exercise Science, 16(2), 1471–1486. https://doi.org/10.70252/FFDK5934
Hopkins, W. G. (2006). Estimating sample size for magnitudebased inferences. Sportscience 10, 63–70. https://www.sportsci.org/2006/wghss.htm
Høeg, T. B., Olson, E. M., Skaggs, K., Sainani, K., Fredericson, M., Roche, M., & Kraus, E. (2022). Prevalence of female and male athlete triad risk factors in ultramarathon runners. Clinical Journal of Sport Medicine, 32(4), 375–381. https://doi.org/10.1097/JSM.0000000000000956
Janiczak, A., Devlin, B. L., Forsyth, A., & Trakman, G. L. (2022). A systematic review update of athletes' nutrition knowledge and association with dietary intake. British Journal of Nutrition, 128(6), 1156–1169. https://doi.org/10.1017/S0007114521004311
Jesus, F., Castela, I., Sousa, M., Silva, A. M., & Branco, P. A. (2021). Risk of low energy availability among female and male elite runners competing at the 26th European crosscountry championships. Nutrients, 13(3), 1–11. https://doi.org/10.3390/nu13030873
Karlsson, E., Alricsson, M., & Melin, A. (2023). Symptoms of eating disorders and low energy availability in recreational active female runners. BMJ Open Sport and Exercise
Medicine, 9(3), 1–6. https://doi.org/10.1136/bmjsem-2023001623
Kuikman, M. A., & Burke, L. M. (2023). Low energy availability in athletes: Understanding undereating and its concerns. Nutrition Today, 58(2), 51–57. https://doi.org/10.1097/nt.0000000000000603
Lichtenstein, M. B., Hertz, S. P. T., Johansen, K. K., Rytter, J., Sundgot-Borgen, J., Torstveit, M. K., Holm, L., & Melin, A. K. (2024). Are sub-elite athletes at higher risk of eating disorders, exercise addiction, depression, and low energy availability compared with elite athletes? Clinical Journal of Sport Medicine 34(6), 572–577 https://doi.org/10.1097/jsm.0000000000001257
Lis, D. M., Fell, J. W., Ahuja, K. D. K., Kitic, C. M., & Stellingwerff, T. (2016). Commercial hype versus reality: Our current scientific understanding of gluten and athletic performance. Current Sports Medicine Reports, 15(4), 262–268. https://doi.org/10.1249/jsr.0000000000000282
Liu, A. Y., Petit, M. A., & Prior, J. C. (2020). Exercise and the hypothalamus: Ovulatory adaptations. In A. C. Hackney & N. W. Constantini (Eds.), Endocrinologyofphysicalactivity and sport (3rd ed., pp. 123–152). Humana Press.
Logue, D. M., Madigan, S. M., Heinen, M., McDonnell, S.-J., Delahunt, E.,& Corish,C. A.(2019). Screeningforriskoflow energy availability in athletic and recreationally active females in Ireland. EuropeanJournal ofSport Science, 19(1), 112–122. https://doi.org/10.1080/17461391.2018.1526973
Loucks, A. B. (2007). Low energy availability in the marathon and other endurance sports. Sports Medicine, 37(4–5), 347–352. https://doi.org/10.2165/00007256-200737040-00019
Lundy, B., Burke, L.M.,Torstveit, M. K.,Stenqvist, T.B., Garthe, I., Slater, G. J., Ritz, C., & Melin, A. K. (2022). Screening for low energy availability in male athletes: Attempted validation of LEAM-Q. Nutrients, 14(9), 1–19. https://doi.org/10.3390/nu14091873
Magee, M. K., Jones, M. T., Lockard, B. L., Jagim, A. R., Zabriskie, H. A., Schaefer, A. Q., Luedke, J. A., & Erickson, J. L. (2020). Prevalence of low energy availability in collegiate women soccer athletes. Journal of Functional Morphology and Kinesiology, 5(4), 1–9 https://doi.org/10.3390/jfmk5040096
Mathisen, T. F., Sundgot-Borgen, C., Anstensrud, B., & SundgotBorgen, J. (2022). Intervention in dance students to increase mental health-and nutrition literacy. A controlled trial with follow up. Frontiers in Sports and Active Living, 4. https://doi.org/10.3389/fspor.2022.727048
Melin, A., Tornberg, Å. B., Skouby, S., Faber, J., Ritz, C., Sjödin, A., & Sundgot-Borgen, J. (2014). The LEAF questionnaire: A screening tool for the identification of female athletes at risk for the female athlete triad. BritishJournalofSportsMedicine, 48(7), 540–545. https://doi.org/10.1136/bjsports-2013093240
Melin,A.K.,Heikura,I.A.,Tenforde,A.,&Mountjoy,M.(2019). Energy availability in athletics: Health, performance, and physique. InternationalJournalofSportNutrition&Exercise Metabolism, 29(2), 152–164. https://doi.org/10.1123/ijsnem.2018-0201
Ministry of Health. (2023). How much activity is recommended? https://www.health.govt.nz/your-health/healthy-living/food-
activity-and-sleep/physical-activity/how-much-activityrecommended
Mountjoy, M., Ackerman, K. E., Bailey, D. M., Burke, L. M., Constantini, N., Hackney, A. C., Heikura, I. A., Melin, A., Pensgaard, A. M., Stellingwerff, T., Sundgot-Borgen, J. K., Torstveit, M. K., Jacobsen, A. U., Verhagen, E., Budgett, R., Engebretsen, L., & Erdener, U. (2023). 2023 International Olympic Committee’s (IOC) consensus statement on relative energy deficiency in sport (REDs). British Journal of Sports Medicine, 57(17), 1073–1097. https://doi.org/10.1136/bjsports-2023-106994
Olcott, A., & Anstrom, C. (2020). The impact of sports nutrition knowledge on the physical effects of low energy availability in female cross country runners. Journal of the Academy of Nutrition and Dietetics, 120(9, Supplement), A87 https://doi.org/https://doi.org/10.1016/j.jand.2020.06.099
Pai, N. N. (2023). Low energy availability in females: Risk, knowledge and education [Doctoral thesis, University of Otago]. Otago University Research Archive. http://hdl.handle.net/10523/15665
Rogers, M. A., Drew, M. K., Appaneal, R. N., Lovell, G., Lundy, B., Hughes, D., Vlahovich, N., Waddington, G., & Burke, L. M. (2021). The utility of the low energy availability in females questionnaire to detect markers consistent with low energy availability-related conditions in a mixed-sport cohort. International Journal of Sport Nutrition & Exercise Metabolism, 31(5), 427–437. https://doi.org/10.1123/ijsnem.2020-0233
Scheer, V., Basset, P., Giovanelli, N., Vernillo, G., Millet, G. P., &Costa,R. J.S.(2020). Definingoff-roadrunning:Aposition statement from the Ultra Sports Science Foundation. International Journal of Sports Medicine, 41(5), 275–284. https://doi.org/10.1055/a-1096-0980
Sims, S. T., Kerksick, C. M., Smith-Ryan, A. E., Janse de Jonge, X. A. K., Hirsch, K. R., Arent, S. M., Hewlings, S. J., Kleiner, S. M., Bustillo, E., Tartar, J. L., Starratt, V. G., Kreider, R. B., Greenwalt, C., Rentería, L. I., Ormsbee, M. J., VanDusseldorp, T. A., Campbell, B. I., Kalman, D. S., & Antonio, J. (2023). International society of sports nutrition position stand: Nutritional concerns of the female athlete. Journal of the International Society of Sports Nutrition, 20(1), 390–429. https://doi.org/10.1080/15502783.2023.2204066
Slater, J., McLay-Cooke, R., Brown, R., & Black, K. (2016). Female recreational exercisers at risk for low energy availability. International Journal of Sport Nutrition & Exercise Metabolism, 26(5), 421–427. https://doi.org/10.1123/ijsnem.2015-0245
Spronk, I., Kullen, C., Burdon, C., & O'Connor, H. (2014). Relationship between nutrition knowledge and dietary intake. British Journal of Nutrition, 111(10), 1713–1726. https://doi.org/10.1017/S0007114514000087
Stellingwerff, T., Heikura, I. A., Meeusen, R., Bermon, S., Seiler, S., Mountjoy, M. L., & Burke, L. M. (2021). Overtraining Syndrome (OTS) and Relative Energy Deficiency in Sport (RED-S): Shared pathways, symptoms and complexities. Sports Medicine, 51(11), 2251–2280. https://doi.org/10.1007/s40279-021-01491-0
Tam, R., Beck, K. L., Manore, M. M., Gifford, J. A., Flood, V. M., & O’Connor, H. (2019). Effectiveness of education interventions designed to improve nutrition knowledge in athletes: A systematic review. SportsMedicine,49(11), 1769–1786. https://doi.org/10.1007/s40279-019-01157-y
Tam, R., Beck, K. L., Scanlan, J. N., Hamilton, T., Prvan, T., Flood, V. M., O'Connor, H., & Gifford, J. A. (2021a). The platform to evaluate athlete knowledge of sports nutrition questionnaire: A reliable and valid electronic sports nutrition knowledge questionnaire for athletes. British Journal of Nutrition, 126(4), 561–571. https://doi.org/10.1017/S0007114520004286
Tam, R., Flood, V. M., Beck, K. L., O'Connor, H., & Gifford, J. A. (2021b). Measuring the sports nutrition knowledge of elite Australian athletes using the Platform to Evaluate Athlete Knowledge of Sports Nutrition Questionnaires. Nutrition & Dietetics, 78(5), 535–543. https://doi.org/ https://doi.org/10.1111/1747-0080.12687
Vardardottir, B., Olafsdottir, A. S., & Gudmundsdottir, S. L. (2023). Body dissatisfaction, disordered eating and exercise behaviours: Associations with symptoms of REDs in male and female athletes. BMJ Open Sport and Exercise Medicine, 9, 1–10. https://doi.org/10.1136/bmjsem-2023-001731
Washif, J.A., Farooq, A., Krug, I., Pyne, D.B., Verhagen, E., Taylor, L., Wong, D.P., Mujika, I., Cortis, C., Haddad, M., Ahmadian, O., Jufaili, M.A., Al-Horani, R.A., Al-Mohannadi, A.S., Aloui, A., Ammar, A., Arifi, F., Aziz, A.R., Batuev, M., … Chamari, K. (2022). Training during the COVID-19 lockdown: Knowledge, beliefs, and practices of 12,526 athletes from 142 countries and six continents. Sports Medicine 52, 933–948. https://doi.org/10.1007/s40279-02101573-z
World Athletics. (2021). Trail Running https://worldathletics.org/disciplines/trail-running/trailrunning
The Journal ofSport and Exercise Science, Vol. 9, Issue 1, 43-51 (2025)
www.jses.net