
ARTICULATION & TRANSFER IN TENNESSEE HIGHER EDUCATION


Ms. Tara Scarlett | Chair | Nashville | Middle Tennessee
Mr. Tre Hargett | Vice Chair | Secretary of State
Dr. Mike Ragsdale | Vice Chair | Dandridge | East Tennessee
Ms. Whitney Allmon | Secretary | Dyersburg | West Tennessee
Mr. Jimmy Matlock | Lenoir City | East Tennessee
Mr. Gadson W. Perry | Memphis | West Tennessee
Mr. John Rader | Nashville | Middle Tennessee
Dr. Robert Smith | Franklin | Middle Tennessee
Mr. Vernon Stafford, Jr. | Collierville | West Tennessee
Mr. Charles Wood | Chattanooga | East Tennessee
Mr. David H. Lillard, Jr. | State Treasurer
Mr. Jason E. Mumpower | State Comptroller
Dr. Sara Heyburn Morrison | Executive Director, State Board of Education
Ms. Julia Dieter | University of Tennessee, Knoxville | Student Member
Overview of the Articulation and Transfer Report
The 2025 Articulation and Transfer Report provides an update on the progress made toward full articulation between public institutions in Tennessee. The report presents an update on the implementation of the articulation and transfer mandate through three primary sections:
1) Section I provides information on the composition and charge of the Articulation and Transfer Council, as well as an update on the current activities of the Council.
2) Section II examines the demographics, transfer behavior, and credential outcomes for the fall 2018 first-time freshmen cohort who enrolled at Tennessee public community colleges or universities. This section follows these students in the six years after their initial enrollment to provide a longitudinal view of their transfer behavior and resulting credential outcomes.
3) Section III examines the demographics, transfer behavior, and credential outcomes of those students in the fall 2018 cohort who ever enrolled in a Tennessee Transfer Pathway (TTP) associate degree program. TTPs are designed to facilitate a seamless transfer between Tennessee’s public community colleges and four-year colleges and universities.
Transfer students are defined as any student who attended more than one institution during the six years following first enrollment, which covers fall 2018 through summer 2024 for the fall 2018 cohort. Highlights of the report’s findings include:
• In the fall 2018 cohort, 31.0% of students attended more than one institution in six years (Figure 1). A vertical transfer from a two-year institution to a four-year institution, categorized here as a “24” transfer, remains the most common transfer pattern for those students who do transfer in the fall 2018 cohort, representing over 46% of all transfers (Figure 8).
• Transfer students have higher six-year graduation rates (64.2%) than non-transfer students (45.5%) in the cohort. This gap is driven by many students who begin enrollment at a two-year institution, do not transfer, and do not graduate (Figure 7).
• Students who complete a “24” transfer are more likely than all other transfer patterns in the fall 2018 cohort to earn any type of credential within six years. These students also earn a wide variety of credentials. Of students in this transfer pattern, 74.5% graduated in six years, including 36.3% of students who earned both an associate and a bachelor’s degree (Figure 11).
• Of the 9,053 students in the fall 2018 cohort who ever enrolled in a TTP, 46.4% transferred (Figure 13). TTP students completing a “24” transfer were most likely of all TTP transfer patterns to have a credential after six years.
• Of the cohort students who enrolled in a TTP, 20.7% obtained an associate degree in a TTP major (Appendix F). Overall, 40.8% of TTP participants earned any credential in the six years following initial enrollment (Figure 19).
Tennessee students take many paths to and through higher education. For those encountering higher education for the first time with aspirations to earn a bachelor’s degree, efforts like Tennessee Promise and Tennessee Transfer Pathways support these students as they start their education at a community college and then transfer to a university. The data (see Figure 8) show that a transfer from a community college to a four-year institution is the most common transfer pattern among students who do transfer, and students who complete this transfer pattern are the most likely to earn a bachelor’s degree (see Figure 11). However, many students who enroll at a community college with the intention of transferring to a university never do so. THEC is committed to creating a cohesive higher education enterprise in Tennessee that enables students to move between institutions with minimal barriers. The following recommendations are designed to improve THEC’s support of students as they navigate higher education in pursuit of their goals.
• THEC should find a statewide technology solution that can streamline articulation and transfer programs, including maintenance of course equivalencies and articulable credit, to improve transfer practices across the state.
• THEC should continue to foster collaboration among secondary and postsecondary partners by hosting relevant trainings, professional development, and statewide convenings, leveraging expertise to equip institutions with the best practices to improve credit articulation and student transfer.
• Institutions should continue work with the Articulation & Transfer Council to revise Tennessee Transfer Pathways to eliminate exceptions to articulation agreements. These exceptions, where institutions detail additional course specifications beyond the standard TTP agreement, hinder students from taking full advantage of the TTPs. In the last review cycle, 22 exceptions were eliminated across eight Health Sciences programs.
• THEC should work in partnership with the Tennessee State Board of Education, the Tennessee Department of Education, and other K-12 partners to develop dual enrollment strategies. These strategies include the establishment of pathways or the alignment of course offerings that facilitate the ease of transferring to a postsecondary institution and reduction in time to degree.
• THEC should develop ways to recognize institutions that are intentional about creating a culture that supports transfer students, ensuring that barriers are removed for credit mobility, decreasing credit loss, and creating an overall positive transfer experience in and out of the classroom.
• THEC should research the feasibility and potential impact of the development of a transfer scholarship from a community college to a four-year institution. Coordinating board peers in other Southern Regional Education Board (SREB) states such as Maryland, Texas, and Virginia have all implemented programs that assist academically qualified, low-income community college students who transfer from in-state two-year institutions to in-state four-year institutions. See the section on Transfer Aid Programs in SREB States for more information about these financial aid programs.
The annual Articulation and Transfer Report is prepared pursuant to Tennessee Code Annotated (T.C.A.) § 49-7-202 (r)(5), which directs the Tennessee Higher Education Commission (THEC) to: “…report… on the progress made toward full articulation between all public institutions.” See Appendix A for full text of T.C.A. § 49-7-202 (r)(1-5).
Throughout this report, THEC complies with the federal Family Educational Rights and Privacy Act (FERPA) requirements to protect students’ personally identifiable information. Therefore, when tables are presented, individual cells containing fewer than 10 observations are suppressed. Adjacent cells may also be suppressed to prevent unmasking via subtraction (i.e., complementary suppression). The suppressed information is included in table totals.
Data Sources
• This report uses enrollment and credential outcomes data from the National Student Clearinghouse Student Tracker (NSC) to examine the fall 2018 first-time freshmen cohort, supplemented by demographic and academic details sourced from the Tennessee Higher Education Commission’s Student Information System (THECSIS). Using NSC data provides a broad picture of a student’s enrollment history, including at institutions outside of Tennessee. However, the Tennessee Colleges of Applied Technology (TCATs) 1 are not currently part of the NSC data. Financial aid information is available through the Financial Aid System of Tennessee (FAST). Financial aid information is missing for students who did not file the Free Application for Federal Student Aid (FAFSA) or for whom THEC does not receive a FAFSA record (e.g., non-residents) during the six years of enrollment. Missing FAFSA information impacts 9.3% of records; subsequent figures and notes clarify how missing data are handled
• The third section of the report examines enrollment and credential outcomes of a subset of the fall 2018 cohort who ever enrolled in a Tennessee Transfer Pathway (TTP) at one of Tennessee’s public community colleges. This section matches the NSC and THECSIS data with additional data on TTP enrollment and completions from the Tennessee Board of Regents (TBR). This section also includes financial aid information from THEC’s FAST database.
Definitions
• A transfer student is defined as any student who attended more than one institution during the six years following first enrollment, which covers fall 2018 through summer 2024 for the fall 2018 cohort.
• A transfer pattern codes each sector (two-year or four-year) in which a student was enrolled, chronologically. The transfer pattern does not include information about when a student transferred, only the order of institutions attended. Using NSC data, these transfer patterns include non-public and out-of-state institutions in addition to Tennessee public institutions,
1 TCAT Chattanooga is considered an academic division within Chattanooga State Community College. As a result, several technical diplomas conferred by TCAT Chattanooga are captured as credentials in this analysis.
allowing us to determine the full transfer pattern of a student. There were 100 different transfer patterns within the fall 2018 cohort, demonstrating the many pathways of transfer students. For example:
• A student who first enrolls at University of Tennessee, Knoxville (UTK), subsequently enrolls at Pellissippi State Community College (PSCC), and then returns to take courses at UTK would be shown in the data as enrolled at UTK (a four-year institution), PSCC (two-year), then UTK (four-year), translating to a “424” transfer pattern.
• A student who first enrolls at Southwest Tennessee Community College (a two-year institution) then enrolled at University of Memphis (a four-year institution) student is coded as a “24” transfer.
• A student who began at Middle Tennessee State University (a four-year institution) then enrolled at an out-of-state four-year institution is coded as a “44” transfer.
• A concurrent enrollment is an instance where a student is simultaneously enrolled at multiple institutions. Using previous enrollments, enrollment intensity (i.e., part-time, fulltime, etc.), and length of enrollment at both institutions helps to determine whether a student changed institutions.
• A student taking a full-time course load at University of Tennessee, Knoxville and a part-time course load at Pellissippi State Community College in the same term would be shown as enrolled at UTK with a concurrent enrollment.
• The Complete College Tennessee Act (2010) created Tennessee Transfer Pathways (TTPs) to facilitate seamless transfer between Tennessee’s community colleges and universities. See Appendix E for a complete list of TTPs available to students in the fall 2018 cohort.
Section I: Articulation and Transfer Council


ONE Articulation and Transfer Council
Tennessee expects a more aligned higher education enterprise, which prioritizes credit mobility and continuity for students’ academic experiences throughout the state. THEC is responsible for maintenance and oversight of various elements of a successful transfer culture, including collaboration, TTP maintenance, common course numbering, non-transferable courses, and dual admissions. Improving the culture for transfer students will require all higher education in Tennessee to support students and to put in place a seamless, transparent, and supportive transfer system that promotes completion.
The Articulation and Transfer Council serves as a vehicle for THEC, institutions, and stakeholders to provide consistency in articulation and transfer policies and practices at all levels. The momentum to increase the transferability of courses from traditional transfer students, military students, high school students, and adult learners is critical. The Articulation and Transfer Council is necessary to fulfill the requirements in T.C.A. § 49-7-202(r)(1-5), including collaboration on the development and maintenance of Tennessee Transfer Pathways, Tennessee Reverse Transfer, common course numbering, and dual admissions. See Appendix A for the full text of this section. The current composition of the Articulation and Transfer Council consists of representatives from THEC, TBR, the University of Tennessee System Office, University of Tennessee campuses, the Tennessee Independent Colleges and Universities Association, and Locally Governed Institutions. See Appendix B for complete membership.
Council meetings are held quarterly to focus on improving credit mobility and removing barriers to student transfer across the state. The Articulation and Transfer Council continues to ensure articulation and transfer processes are aligned with provisions in statute. Over the last year, the Council has approved updated TTP curriculums that eliminated articulation exceptions from eight Health Science pathways, updated the Council charter, voted on sub-councils’ membership, and elected officers. The council will continue to ensure that students with transfer credit are successful in their journey.
The five sub-councils were developed by the Articulation and Transfer Council to help address specific objectives or special projects. Sub-councils currently meet on an as-needed basis but will begin meeting quarterly in 2026. A brief overview of each existing sub-council and their work is presented below.
This newly established sub-council will provide expertise related to dual admissions policies. This subcouncil will ensure the efficiency of the dual admissions program for students pursuing a degree program within a transfer pathway. The sub-council will review processes and policies to make recommendations that ensure student success when transitioning between institutions through a dual admissions agreement
This sub-council will facilitate the ease of transfer for community college students from one community college to another and from community colleges to universities, improve program planning, and increase communication among all colleges. The sub-council will identify other state systems that have developed common course numbering and will connect to share best practices for a system in Tennessee.
This sub-council will advance the effectiveness of the Tennessee Reverse Transfer program. The subcouncil will have oversight of the Reverse Transfer program and will review future THEC policies and their
impact annually. The sub-council will focus on establishing a statewide policy as well as increasing student participation. In fiscal year 2025-26, the state of Tennessee distributed nearly $6 million 2 to community colleges and universities based on reverse transfer outcomes. To date, over 7,500 associate degrees have been awarded through Tennessee’s Reverse Transfer program.
This sub-council is working to create a systematic approach to the development, tracking, and stacking of technical pathways similar in structure to the existing TTPs. This work focuses on the transferability of TCAT technical diplomas and certificates and Associate of Applied Science (AAS) degrees to both community colleges and universities. The sub-council is charged with researching other existing or proposed articulation agreements within technical education across the state.
This sub-council is charged with reviewing, updating, and developing transfer policies, principles, and systemwide expectations to ensure legislative compliance. The sub-council will use multiple taskforce groups to develop a continuous improvement plan, ensuring the credits students earn through a TTP program will apply to degree programs at Tennessee’s public universities and participating private universities. The sub-council will focus on establishing a statewide policy to ensure alignment with all pathways in the future. The next curriculum review for 2025-26 will be STEM, Business, and Agriculture.
2 The estimated funding distribution analysis calculates the distribution of state appropriations allocated to institutions via twenty OutcomesBased Funding metrics that are determined based on performance in each outcome metric. Using the total share of weighted outcomes points for the reverse transfer metric, an estimated distribution of state appropriations for reverse transfer is calculated. Due to the nature of the analysis, there is potential for rounding errors. For more information, see the Estimated Funding Distribution documentation here: https://www.tn.gov/thec/data-research-reports/fiscal-policy/o-b-f-formulas-resources/2020-25-obf.html


This year’s report continues the work of previous reports by tracking the transfer behavior of a cohort of students across six years. The report examines transfer behavior and credential outcomes for the cohort of first-time freshmen who enrolled at a Tennessee public university or community college in fall of 2018. 3 By using a cohort view and data from the National Student Clearinghouse Student Tracker (NSC), this report tracks students at most public and private, two-year and four-year, in-state and out-of-state institutions across the United States to see their transfers and credential attainment. 4 The resulting dataset is a robust picture of the transfer behavior and credential outcomes of the students who began in Tennessee public community colleges and universities in fall 2018.
Our dataset consists of 38,375 Tennessee students in the fall 2018 cohort who are captured in NSC enrollment and graduation records. Of these students, 11,913 (31.0%) attended more than one institution in six years; throughout this section, these students are identified as “transfer students,” while the remaining 26,462 (69.0%) are identified as “non-transfer students.” As transfer students are tracked across institutions, their patterns of enrollment are captured and encoded to create transfer patterns. See the Definitions section for further details about transfer patterns.
This section summarizes differences between transfer and non-transfer students in gender, race/ethnicity, economic status, and first-generation status.
Table 1 provides demographic data for the overall fall 2018 cohort. The fall 2018 cohort increased slightly, by just over 200 students, compared to the fall 2017 cohort, but is overall similar in terms of demographics. Students in the fall 2018 cohort are more likely to be White, not Hispanic; Hispanic; or in the “Other” race/ethnicity category compared to the fall 2017 cohort. Students in the fall 2018 cohort were also less likely than students in the fall 2017 cohort to be Pell eligible.
3 The fall 2018 cohort includes first-time freshmen (FTF) who initially enrolled in fall 2018 or who initially enrolled in summer 2018 and returned in fall 2018 across Tennessee public community colleges and universities. The completion data provide credential outcomes through summer 2024 (within six years of initial enrollment). This represents all FTF identified by THECSIS and found in NSC records.
4 In the enrollment years included in this section of the report (2018-2024), between 96.7% and 97.0% of all Title IV, degree-granting institutions reported enrollment and graduation data to the National Student Clearinghouse Student Tracker. Additional information about National Student Clearinghouse data is available on their website at https://www.nscresearchcenter.org/. As of fall 2024, TCATs do not report information to NSC.
Table 1: Demographics of Fall 2018 Cohort
Notes: The “Other” race/ethnicity category includes Alaskan Native, American Indian, Asian or Pacific Islander, and Multiracial. Pell eligibility describes any student who was eligible for the Pell grant at any point during the six-year period following initial enrollment. First-generation status is self-reported on the FAFSA by parent education level and describes any student who was categorized as first-generation at any point in the six-year period. Students who did not file a FAFSA or for whom THEC does not receive a FAFSA record (e.g., non-residents) are categorized as not eligible for the Pell grant and not first-generation in this report.
Figure 1 displays the overall percent of students in the 2018 cohort who transferred at any point in the six-year period following their initial enrollment. In the 2018 cohort, 69.0% of students attended only one institution during this time and are “Non-Transfer”. Transfer students in the cohort attended as few as two unique institutions and as many as seven
Figure 2 displays the proportion of transfer students by gender. Women comprised a majority of the fall 2018 first-time freshmen cohort (56.9%). Women were also more likely to transfer than men.
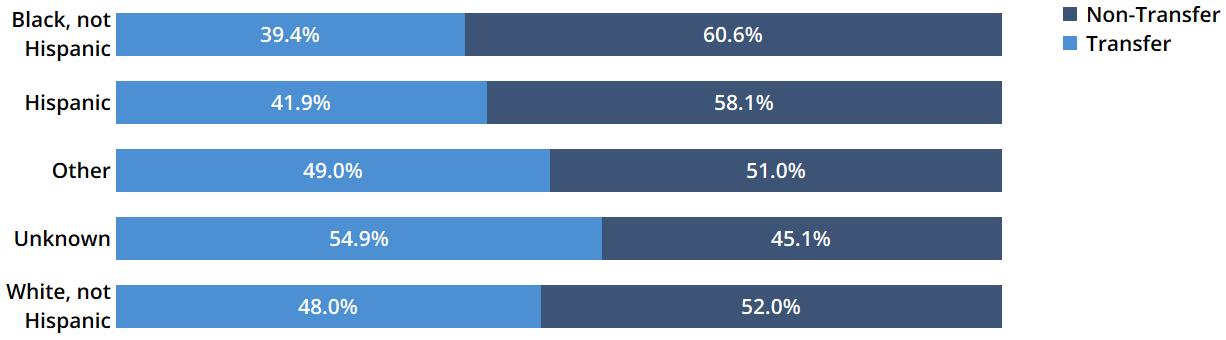
Figure 3 disaggregates transfer behavior by race/ethnicity. The chart shows the percent of each subgroup that transferred at any point in the six-year period following their initial enrollment. Black, not Hispanic and Hispanic students were slightly less likely to transfer than students in other groups.
Figure 3: Overall Transfer Rates of the Fall 2018 Cohort by Race/Ethnicity
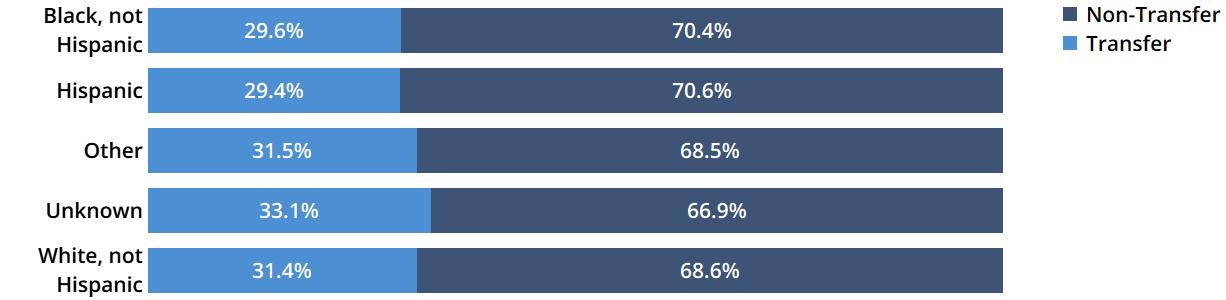
Note: The “Other” race/ethnicity category includes Alaskan Native, American Indian, Asian or Pacific Islander, and Multiracial.
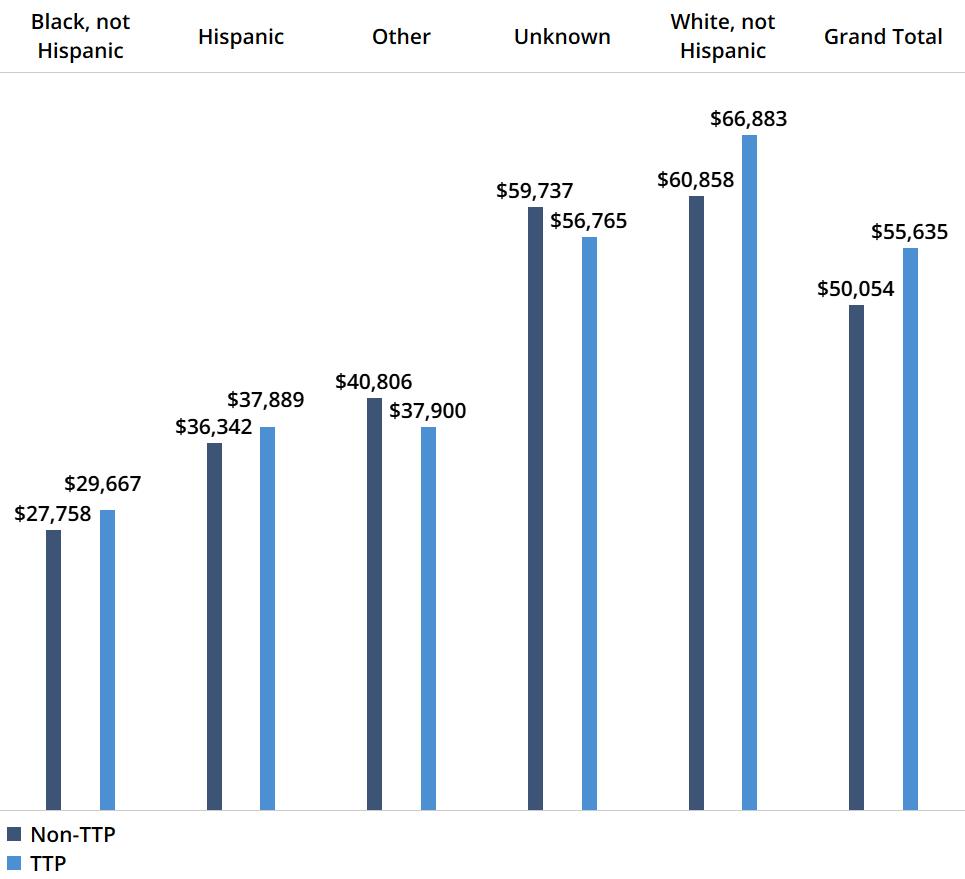
Figure 4 shows the median adjusted gross income (AGI) for the 2018-19 academic year, the first year of enrollment for the cohort, disaggregated by race/ethnicity and transfer status. Transfer students come from higher income backgrounds than their non-transfer peers, on average. Across all racial/ethnic groups, the median AGI for 2018-19 is $67,544 for transfer students and $55,753 for non-transfer students. Income gaps are widest for White, not Hispanic students, and narrowest for students of unknown race/ethnicity.
Figure 4: Median 2018-19 AGI of the Fall 2018 Cohort, by Race/Ethnicity and Transfer Status
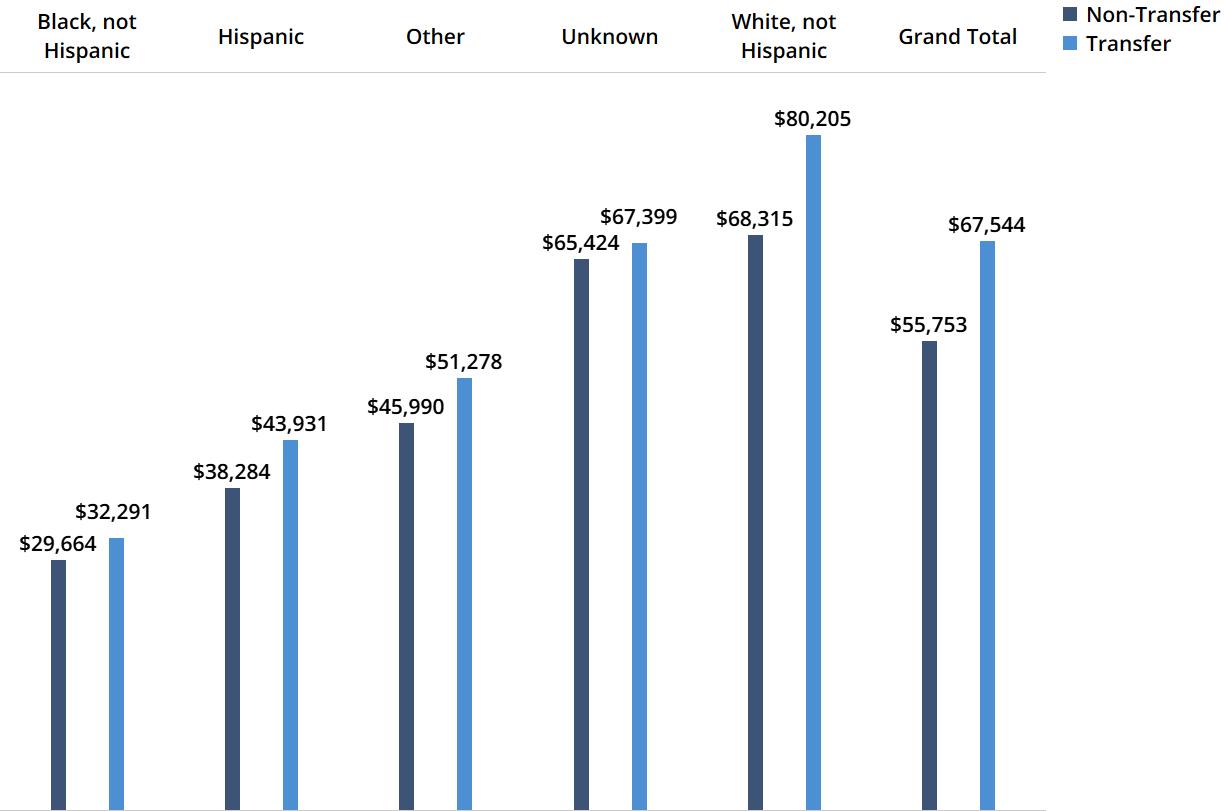
Note: The “Other” race/ethnicity category includes Alaskan Native, American Indian, Asian or Pacific Islander, and Multiracial. AGI is sourced from the FAFSA, so students who did not file a FAFSA or for whom THEC does not receive a FAFSA record (e.g., non-residents) for aid year 2018-2019 are not included in this figure.
Figure 5 displays the breakdown of the unique number of institutions attended for the 2018 cohort within six years of initial enrollment. “Unique” here counts an institution only once, even if a student transfers back to an institution they previously attended. Most students, 69.0%, attended only one institution during the six years immediately following enrollment (i.e., did not transfer). Students who transferred usually attended only two (82.2% of transfer students) or three (15.2% of transfer students) unique institutions during this period. A small number of students attended four or more unique institutions.
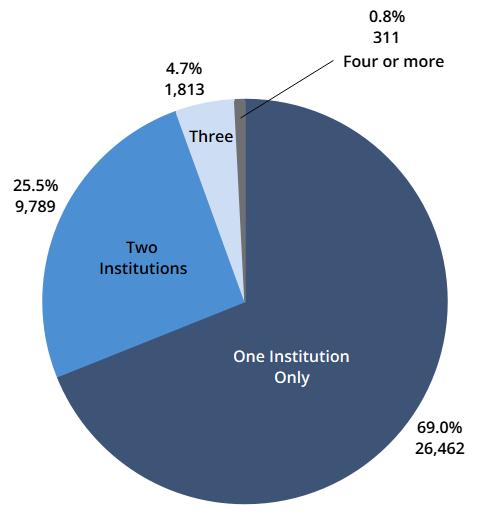
Figure 6 (next page) shows the outmigration of fall 2018 cohort students by the first state to which these students transferred. This map includes all students who began at a Tennessee institution in fall 2018 and ever transferred to an out-of-state institution. Overall, 10.0% of all students in the cohort who began at a Tennessee institution transferred to an out of state institution at some point during the six years following initial enrollment (representing 32.1% of all transfer students). Out-of-state transfer was higher in the fall 2018 cohort (10.0%) than in the fall 2017 cohort (9.6%). These data also show students who enrolled in online programs headquartered elsewhere (e.g. Southern New Hampshire University in New Hampshire or University of Phoenix in Arizona). In these cases, it is likely that the student did not move to the state where the primarily or exclusively online institution is headquartered.
6: Tennessee Transfers to Out-of-State Institutions, Fall 2018 Cohort
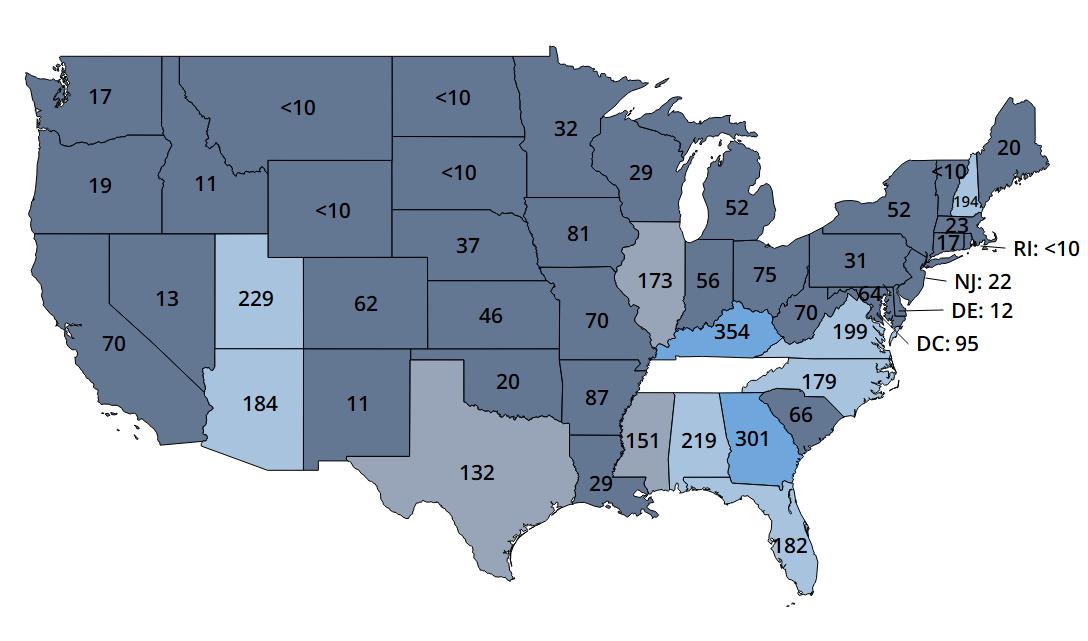
Note: The four colors in the map represent quartiles of the range of values, with dark navy blue representing the lowest quartile values and bright blue as the highest quartile values. Individual cells containing fewer than ten observations are suppressed, in accordance with FERPA requirements. Alaska, Hawaii, and Puerto Rico are not shown, though each did receive students. These counts are not shown in accordance with FERPA requirements.
Figure 7 shows the highest credential earned for students from the fall 2018 cohort, disaggregated by transfer status and sector (two-year or four-year) of initial enrollment. Overall, 64.2% of transfer students earned a credential within six years of initial enrollment, while only 45.5% of non-transfer students earned a credential in the same time frame. This disparity is largely driven by the low attainment rates (19.8%) of non-transfer students students in the two-year sector, which includes students who drop out after the first semester or first year.
Figure 7: Highest Credential Earned by Transfer and Non-Transfer Students and Initial Enrollment Sector, Fall 2018 Cohort
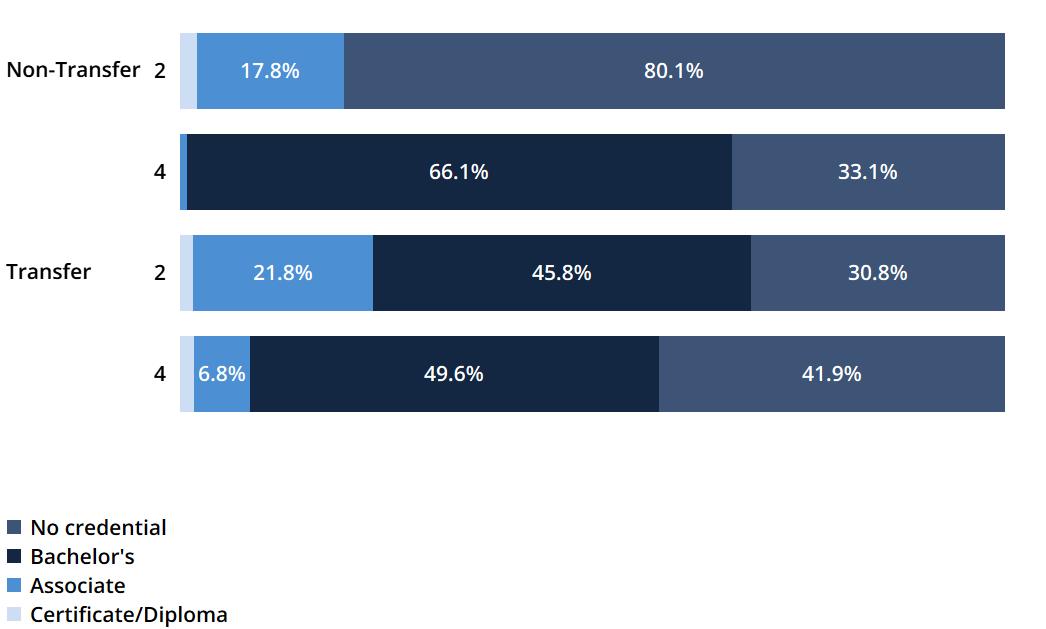
Note: Diplomas are a small portion of credentials; in the fall 2018 cohort, 0.3% (n=98) of students obtained a diploma within six years of initial enrollment. Diplomas are presented here with certificates. A very small number of students (n=32) obtained both a diploma and a certificate; these students are counted only once in the “certificate/diploma” category. Additionally, NSC data shows students who have obtained a credential with no additional details. Where possible, these students (n=216) were matched with THECSIS data to fill in credential information. The remaining students whose credential details were unknown (n=130) were considered as “no credential” in this figure and graduation rate calculations.
Since 2014, the Maryland 2+2 Transfer Scholarship has encouraged Maryland resident community college students to transfer to an in-state four-year institution and complete a bachelor’s degree in a timely manner. In addition to maintaining at least a 2.5 GPA while at a Maryland public two-year institution, students must also demonstrate financial need to be eligible for the scholarship. Students with a Student Aid Index (SAI) of 10,000 or lower are eligible for $1,000 towards tuition and mandatory fees annually for up to three years at eligible four-year institutions. Students pursuing a bachelor’s degree in a science, teaching, engineering, computer science, mathematics, or nursing program are eligible to have the scholarship doubled to $2,000 annually.
The Texas Higher Education Coordinating Board found that only one in four community college students transferred to four-year institutions and approximately 60% of transfer students graduated with a bachelor’s degree. 5 Started as a pilot program in 2022 in response to these findings, the Texas Transfer Grant is need-based aid given to high-achieving in-state transfer students to help mitigate financial barriers to vertical transfer. To be eligible for the grant, students must have earned an associate degree from a public junior college, public state college, or public technical institute while maintaining at least a 2.5 GPA. Students have one year from the receipt of their associate degree to enroll at an eligible Texas four-year institution. Students must have an SAI of 6,514 or less and are eligible for up to $16,287 annually in grant funding for two or three years depending on the length of the baccalaureate program. To maintain the grant, students must meet satisfactory academic progress standards to ensure progression towards a bachelor’s degree.
Established in 2007, the Two-Year College Transfer Grant Program provides an incentive for students to first complete an associate degree at a Virginia public two-year college before transferring to a participating in-state four-year college or university as a means to reduce the overall cost towards completing a bachelor’s degree. To be eligible for the grant, students must receive an associate degree while maintaining a 3.0 GPA before moving to an eligible four-year institution. Students can receive up to $1,000 annually towards tuition and fees. Students must also demonstrate financial need with a SAI of 15,000 or less and can receive an extra $1,000 annually for pursuing a bachelor’s degree in a science, teaching, engineering, computer science, mathematics, or nursing program.
5 See the 2024 MDRC evaluation of the Texas Grant Program.
To further examine transfer behavior of the fall 2018 cohort, this section provides data disaggregated by transfer pattern.
Figure 8 displays the first two institutions attended by transfer and non-transfer students. Most students (69.0%) attended only one institution in the six years following initial enrollment and are considered nontransfer students. Transfer students generally performed a vertical transfer, moving either from a twoyear institution to a four-year (“24”) or a reverse transfer (“42”). More common among transfer students were those students who started at a two-year institution and transferred to a four-year institution (“24”); this pattern is slightly less common in the fall 2018 cohort (46.4%) than it was in the fall 2017 cohort (46.5%). A smaller number of students completed a horizontal transfer, or transfer from one institution to another institution in the same sector (“44” and “22”). Given that 94.5% of students in the cohort attended either one or two total institutions, examining transfer patterns by first two institutions captures most of the variation in transfer behavior. Students who attended more than two total institutions are categorized in this section according to the sectors of the first two institutions they attended.
See Appendix C for a matrix of sending and receiving institutions for students who make a “24” transfer between Tennessee public institutions and Appendix D for students who make a “42” transfer between Tennessee public institutions. These appendices show common transfer patterns for students moving between in-state public institutions.
Figure 9 disaggregates the transfer patterns of the fall 2018 cohort by race/ethnicity. The distribution of racial and ethnic demographics varies across transfer patterns. For example, students identifying as Black, non-Hispanic make up 17.7% of the overall cohort, as shown in the “Overall” column on the right, but only 13.6% of students who completed a “24” transfer; they are over-represented among students who complete a “22” or “44” transfer.
Figure 9: Race/Ethnicity of Fall 2018 Cohort by First Two Transfer Pattern
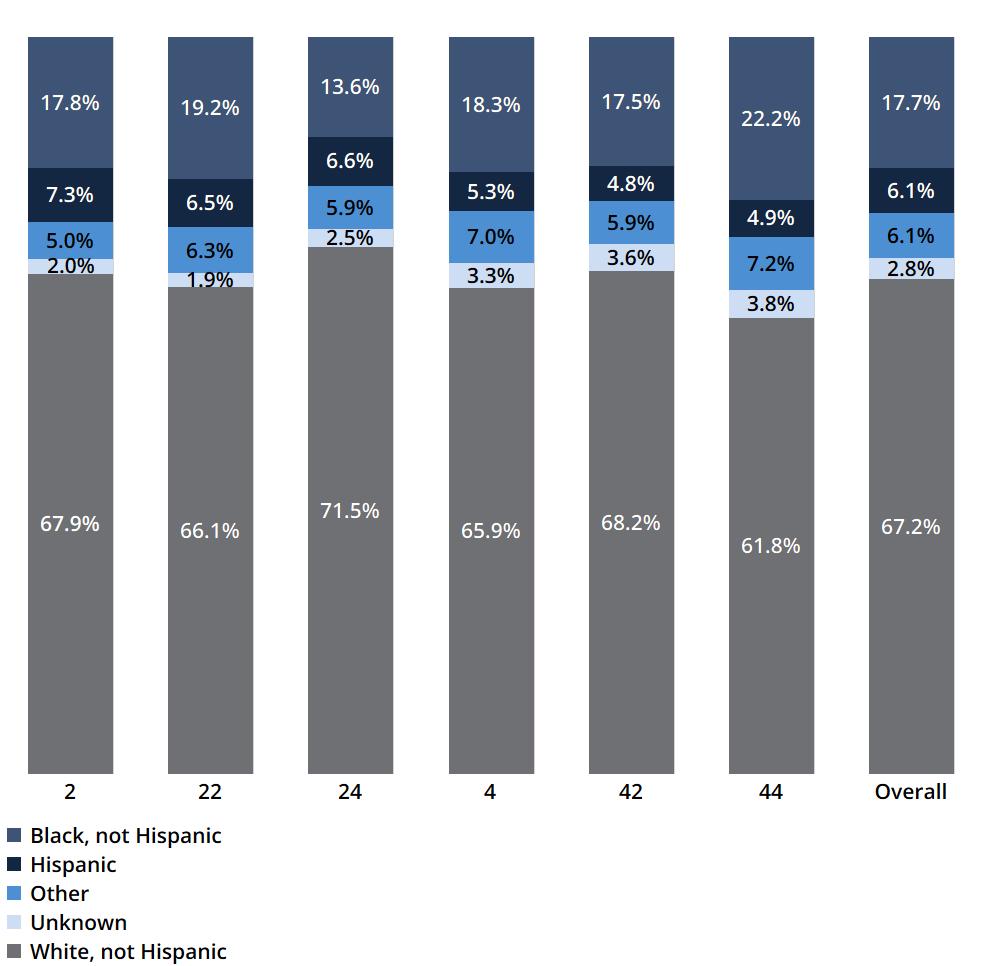
Note: The “Other” race/ethnicity category includes Alaskan Native, American Indian, Asian or Pacific Islander, and Multiracial.
Figure 10 illustrates the proportion of students in each transfer pattern who are Pell eligible, first generation, or both. Students who attended a two-year institution as their first enrollment are more likely to be Pell eligible, first generation, or both when compared to their four-year counterparts. Students who start at a community college and do not transfer are more likely to be Pell eligible, first generation, or both than students who start in the same sector and do transfer. This same disparity does not hold as strongly for students who start at a four-year institution.
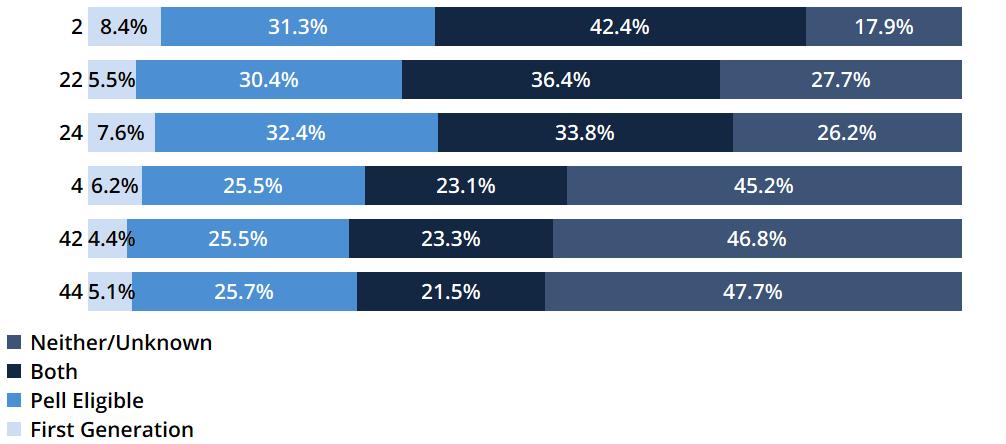
Note: Pell eligibility describes any student who was eligible for the Pell grant at any point during the six-year period following initial enrollment. First-generation status is self-reported on the FAFSA by parent education level and describes any student who was categorized as first generation at any point in the six-year period. Neither/Unknown describes a student who filed a FAFSA and did not meet either criteria or a student who did not file a FAFSA or for whom THEC does not receive a FAFSA record (e.g., non-residents) at any point in the six-year period following initial enrollment. Students who did not file a FAFSA are classified as ineligible for the Pell grant and are not categorized as first generation in this figure.
Figure 11 displays the percentage of students within each transfer pattern who earned a certificate/diploma, associate, or bachelor’s degree. Attainment outcomes vary widely across transfer patterns. Only 19 9% of non-transfer students who began at a two-year institution earned a credential in the six years following enrollment, but 39.3% of students who transferred from one two-year institution to another (“22”) obtained a credential. Students who transferred from one four-year institution to another (“44”) saw similar overall outcomes to non-transfer four-year students. Just over half (52.8%) of students whose first two institutions were a four-year and then a two-year (“42”) earned a credential, lower than students who started at a four-year and did not transfer, who have a 66.9% graduation rate. Students who utilized a “24” transfer had a diverse set of credentials within six years and were most likely of all transfer patterns to have obtained at least one credential. Overall, completion is higher in the fall 2018 cohort (51.3%) than in the fall 2017 cohort (50.4%).
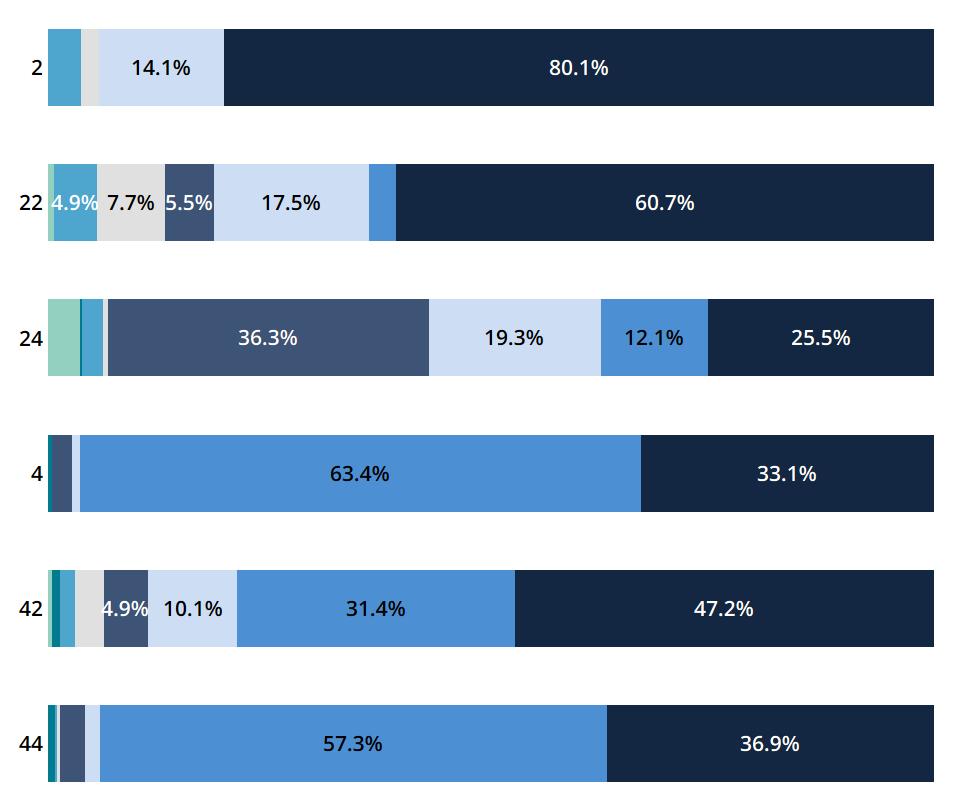
Note: Diplomas are a small portion of credentials; in the fall 2018 cohort, 0.3% (n=98) of students obtained a diploma within six years of initial enrollment. Diplomas are presented here with certificates. A very small number of students (n=32) obtained both a diploma and a certificate; these students are counted only once in the “certificate/diploma” category. Additionally, NSC data shows students who have obtained a credential with no additional details. Where possible, these students (n=216) were matched with THECSIS data to fill in credential information. The remaining students whose credential details were unknown (n=130) were considered as “no credential” in this figure and graduation rate calculations.


This section explores the transfer and success of students within the fall 2018 cohort who utilized a Tennessee Transfer Pathway (TTP) at any point during the six-year period following initial enrollment. Of the 38,375 students identified in the NSC data, 9,053 (23.6%) students enrolled in a TTP at some point during the six-year period following initial enrollment. Throughout this section, these students are identified as “TTP Students”, while the remaining 29,322 students are referred to as “Non-TTP Students”. By definition, all students who never enrolled at a Tennessee two-year public institution are “Non-TTP” students; TTPs are only offered at TBR community colleges and designed to transfer to all public and participating private four-year colleges in Tennessee. This is an increase in TTP participation compared to the 2017 cohort, where 21.8% of students enrolled in a TTP at some point.
In previous iterations of this report, there have been small numbers of students that were identified as having participated in a TTP despite no NSC record of enrollment at a two-year institution. This group of students was generally between 50-75 students. Discrepancies in student matching methodologies between THECSIS, TBR, and NSC are the likely cause. For the fall 2018 cohort, there are 676 students who were identified as having participated in a TTP despite no record of enrollment at a two-year institution according to NSC. Due to differences in TBR and NSC reporting, students were reported as TTP participants in summer or fall of 2020 and do not appear in NSC enrollment records at a two-year institution. This is likely due to increased late withdrawals, administrative withdrawals, and incomplete course enrollments during terms impacted by the COVID-19 pandemic. As with previous reports, these students are removed from the following analyses of the fall 2018 TTP cohort. THEC will monitor this data note in future reports.
TTPs are a creation of the Complete College Tennessee Act (2010) and are provided for in T.C.A. § 49-7202 (r)(1-2), which states that THEC will “require all state institutions of higher education to collaborate and develop a transfer pathway for at least the fifty (50) undergraduate majors for which the demand from students is the highest and in those fields of study for which the development of a transfer pathway is feasible based on the nature of the field of study.” For a complete listing of TTPs, see Appendix E.
According to the TBR, TTPs are advising tools. For community college students who plan to transfer to a Tennessee public university, or to select non-profit private colleges and universities in Tennessee, the TTP provides a guarantee that courses will transfer. TTPs are also an agreement between community colleges and four-year colleges and universities that the community college courses transferred satisfy major preparation requirements. 6
A student who completes all the courses listed on a particular Transfer Pathway will earn an A.A. or A.S. degree at the community college. When the student transfers to a Tennessee public or private college/university the transcript will certify that the pathway has been followed. The student is
6 Tennessee Transfer Pathway. (2014, September 26). Retrieved September 2025, from https://www.tbr.edu/initiatives/tennessee-transferpathway
guaranteed that all the community college courses taken will be accepted at the college/university and the courses will count toward completion of the particular major. 7
Table 2 presents the demographic characteristics of students in the fall 2018 cohort who participated in a TTP (n=9,053) at any point in the six years following initial enrollment (not just in fall 2018) compared to students in the cohort who ever enrolled at a two-year institution, but did not enroll in a TTP (n=12,340). The number of TTP students in the fall 2018 cohort is the largest in over five years and represents a nearly nine percentage point increase over the number of TTP students in the fall 2017 cohort. Compared to the fall 2017 cohort, TTP students in the fall 2018 cohort are slightly less likely to be White, not Hispanic and slightly more likely to be female, but the demographic profile of the TTP students is largely similar year-over-year.
Notes: The “Other” race/ethnicity category includes Alaskan Native, American Indian, Asian or Pacific Islander, and Multiracial. Pell eligibility describes any student who was eligible for the Pell grant at any point during the six-year period following initial enrollment. First-generation status is self-reported on the FAFSA by parent education level and describes any student who was categorized as first generation at any point in the six-year period. Students who did not file a FAFSA or for whom THEC does not receive a FAFSA record (e.g., non-residents) are categorized as not eligible for the Pell Grant and not first generation in this report. This table is limited to students who ever enrolled at a two-year institution, but that two-year institution was not necessarily in Tennessee.
Students are categorized as TTP participants if they have any record of enrollment in a TTP at any point in the six-year period examined. However, the number of terms enrolled in a TTP varies widely. Figure 12 shows the distribution of the number of terms that students are enrolled in a TTP within six years of initial enrollment. Most students (29.9%) are only enrolled in a TTP for one term. Nearly 13% remain enrolled in a TTP for five or more terms, longer than 100% of time to earn an associate degree, which is four terms. Prolonged TTP enrollment may indicate enrollment in summer terms, part-time enrollment, or additional time taken to earn a degree.
7 Tennessee Transfer Pathway. (2014, September 26). Retrieved September 2025, from https://www.tbr.edu/initiatives/tennessee-transferpathway
12: TTP Participation, Number of Terms Enrolled, Fall 2018 Cohort
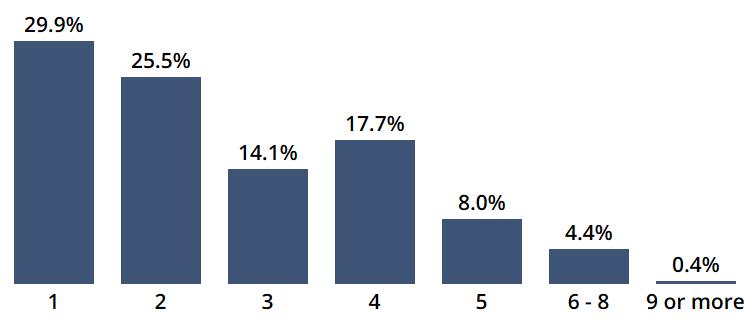
Figure 13 displays the overall transfer rates of students in the fall 2018 cohort who ever participated in a TTP (n=9,053). Less than half of TTP students (46.4%) transferred during the six-year period following initial enrollment. Additionally, TTP students were also more likely than the overall cohort to complete a transfer (see Figure 1).
Figure 14 breaks down transfer of TTP students by gender. As in the overall cohort (see Figure 2), females are slightly more likely to transfer than males, althought the gender gap is much less pronounced for TTP participants.
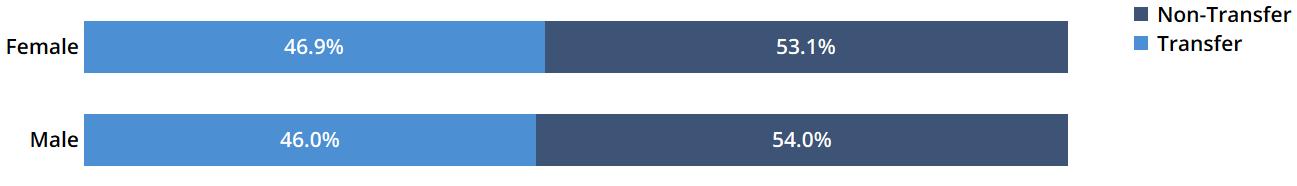
Figure 15 compares the transfer rates of TTP students by race/ethnicity. Similar to the trends observed in the overall cohort (see Figure 3), Black, not Hispanic and Hispanic TTP students are less likely to transfer than White, not Hispanic students. Students whose race/ethnicity is unknown are more likely to transfer than other students, though this is a small group (n=204).
Figure 15: Fall 2018 Cohort TTP Transfer by Race/Ethnicity
Note: The “Other” race/ethnicity category includes Alaskan Native, American Indian, Asian or Pacific Islander, and Multiracial.
Figure 16 disaggregates the median Adjusted Gross Income (AGI) in the students’ first academic year (2018-19) by race/ethnicity and TTP enrollment. TTP students’ economic backgrounds vary by race/ethnicity; however, the income gaps between TTP and non-TTP students are generally small.
Figure 16: Median 2018-19 AGI of the Fall 2018 Two-Year Cohort by Race/Ethnicity and TTP Status
Note: The “Other” race/ethnicity category includes Alaskan Native, American Indian, Asian or Pacific Islander, and Multiracial. AGI is sourced from the FAFSA, so students who did not file a FAFSA or for whom THEC does not receive a FAFSA record (e.g., non-residents) for aid year 2018-2019 are not included in this figure. By definition all students who never enrolled at a two-year are “Non-TTP” students. To provide a reasonable comparison group, this figure shows only “Non-TTP” students who ever enrolled at a two-year institution (n=13,092).
Figure 17 displays the first two institutions attended by TTP students. Over half (53.6%) of TTP students enrolled at a two-year institution and did not transfer during the six-year period following initial enrollment. This is higher than in the 2017 cohort of TTP students, where only 51.6% were non-transfer students. Of all TTP students in the 2018 cohort who did transfer, 72.9% completed a “24” transfer as their first two institutions, which is slightly higher than the 72.7% of all TTP transfer students in the fall 2017 cohort that completed a “24” transfer first.
Note: Due to discrepancies in student matching methodologies between THECSIS, TBR, and NSC, 676 students were identified as having participated in a TTP despite no Student Tracker record of enrollment at a two-year institution; see page 23 for more details. These students have been removed from the graphic above. The remaining students in the “44” group (n=20) ultimately did enroll at a twoyear institution, just not as one of their first two enrollments.
Figure 18 demonstrates the first-generation and Pell eligibility statuses of TTP students in the fall 2018 cohort by transfer pattern. First-generation and/or Pell eligible students are generally represented at lower rates among transfer TTP students than non-transfer TTP students.
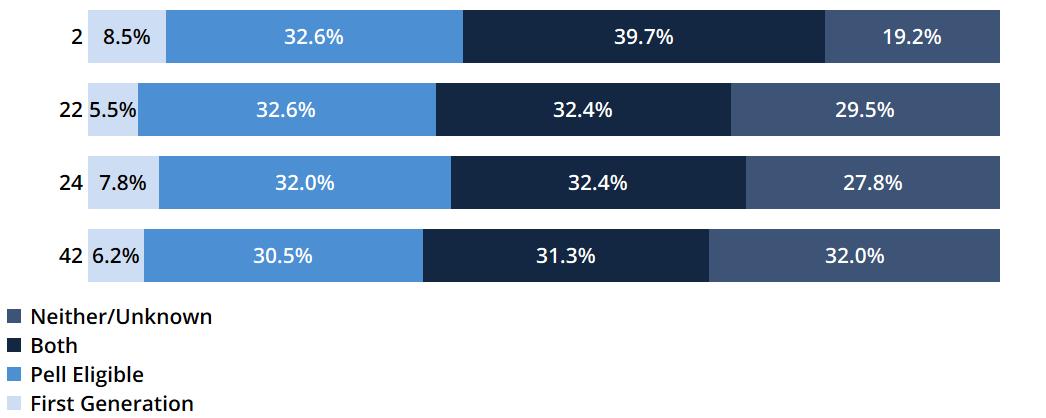
Note: Due to discrepancies in student matching methodologies between THECSIS, TBR, and NSC, 676 students were identified as having participated in a TTP despite no Student Tracker record of enrollment at a two-year institution; see page 23 for more details. These students have been removed from the graphic above. The “44” transfer group is suppressed here, in accordance with FERPA regulations. Pell eligibility describes any student who was eligible for the Pell grant at any point during the six-year period following initial enrollment. First-generation status is self-reported on the FAFSA by parent education level and describes any student who was categorized as first generation at any point in the six-year period. Neither/Unknown describes a student who filed a FAFSA and did not meet either criteria or a student who did not file a FAFSA or for whom THEC does not receive a FAFSA record (e.g., non-residents) at any point in the six-year period following initial enrollment. Students who did not file a FAFSA are classified as ineligible for the Pell grant and are not categorized as first generation in this figure.
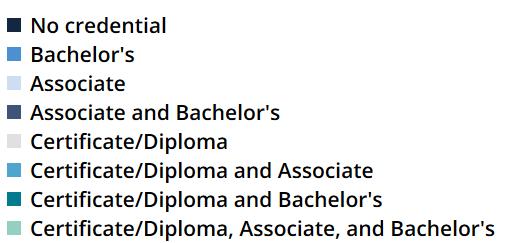
Figure 19 shows the credentials earned within six years for TTP students in the fall 2018 first-time freshmen cohort. TTP students in the fall 2018 cohort were more likely than the overall cohort to have earned both an associate and a bachelor’s degree six years after initial enrollment, with 16.3% of TTP participants obtaining both degrees compared to 11.3% of the full cohort who ever attended a two-year institution. However, the rate of TTP students earning both an associate and a bachelor’s degree for the fall 2018 cohort dropped by about half a percentage point compared to the fall 2017 cohort. This decline was driven by an increase of students who enrolled at a two-year institution and did not transfer nor receive a credential. Students completing a “24” transfer were most likely of all transfer patterns to have a credential after six years For a complete listing of Tennessee Transfer Pathways and participation of fall 2018 cohort students in each, see Appendix E. See Appendix F for a list of TTP credentials awarded to the fall 2018 cohort.
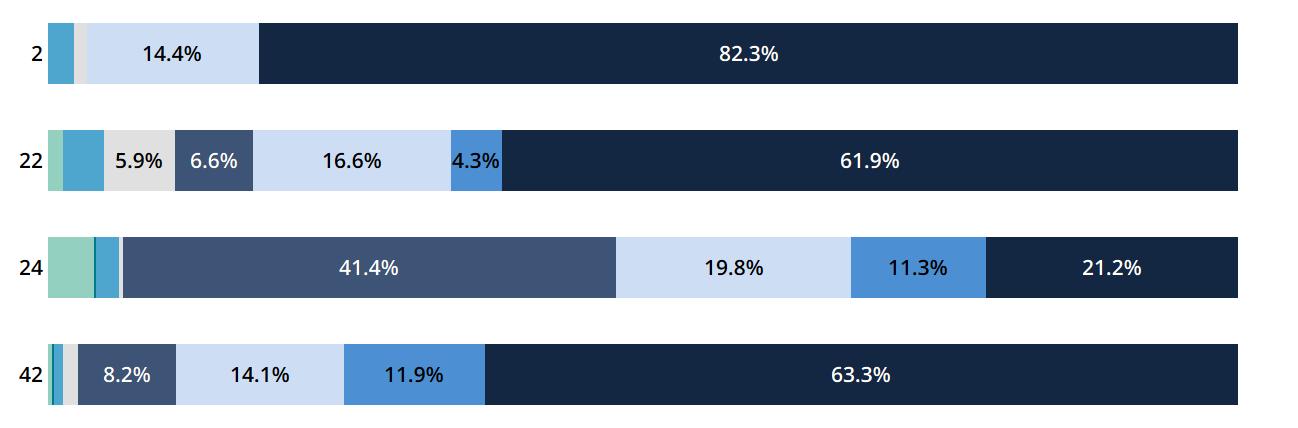
Note: Diplomas are a small portion of credentials; in the fall 2018 cohort of TTP participants, 29 students obtained a diploma within six years of initial enrollment. Diplomas are presented here with certificates. A very small number of students (n=12) obtained both a diploma and a certificate; these students are counted only once in the “certificate/diploma” category. Additionally, NSC data shows students who have obtained a credential with no additional details. Where possible, these students (n=18) were matched with THECSIS data to fill in credential information. The remaining students whose credential details were unknown (n=24) were considered as “no credential” in this figure and graduation rate calculations. Associate degrees earned are not necessarily TTP credentials (See Appendix F for TTP Credentials). The “44” transfer group is suppressed here, in accordance with FERPA regulations.
This report presents an update on the work of the Articulation and Transfer Council; examines the demographics, transfer patterns, and credential outcomes of the fall 2018 first-time freshmen cohort; and provides details on the students who utilize a Tennessee Transfer Pathway (TTP).
Of the 38,375 students in the fall 2018 cohort, 31.0% attended more than one institution in the six years following their initial enrollment, making them transfer students for purposes of this report (Figure 1). Over 46% of transfer students first attended a two-year institution then a four-year institution (Figure 8), completing a vertical transfer.
Transfer students have higher six-year graduation rates (64.2%) than non-transfer students (45.5%) in the cohort. This gap is driven by many students who begin enrollment at a two-year institution, do not transfer, and do not graduate (Figure 7). Students who complete a vertical transfer from a two-year institution to a four-year institution are more likely than all other transfer patterns in the fall 2018 cohort to earn any type of credential within six years. Of students in this transfer pattern, 74.5% graduated in six years, including 36.3% of students who earned both an associate and a bachelor’s degree (Figure 11).
Nearly 700 more students in the fall 2018 cohort enrolled in a TTP program (9,053) than in the fall 2017 cohort (8,314). However, only 46.4% of fall 2018 TTP participants transferred, marking a two-percentagepoint decrease compared to fall 2017 cohort TTP participants. Of all TTP participants, 20.7% obtained an associate degree in a TTP major (Appendix F), and 40.8% of TTP participants earned any credential in the six years following initial enrollment (Figure 19).
THEC is committed to creating a cohesive higher education enterprise that enables students to find success. All institutions across Tennessee have a role to play in contributing to transfer student success. Credential completion rates are not sufficient to meet Tennessee’s workforce needs, and transfer rates among students who start at two-year institutions do not meet the aspirations of the many students who aim to earn a bachelor’s degree. While efforts like Tennessee Promise and Tennessee Transfer Pathways continue to show growth, students are not successfully transferring at expected rates. Tennessee higher education needs to do more to deliver on the promises of these policy efforts. To improve transfer student success statewide, THEC should:
• Find a statewide technology solution that can streamline articulation and transfer programs and practices across the state.
• Continue to foster collaboration among secondary and postsecondary partners to leverage expertise for best practices in articulation and transfer.
• Continue to work with institutions to eliminate articulation exceptions from TTPs.
• Work in partnership with the Tennessee State Board of Education, the Tennessee Department of Education, and other K-12 partners to develop dual enrollment pathways that facilitate the ease of transferring to a postsecondary institution.
• Create ways to recognize institutions that are intentionally creating a culture that supports transfer students, seamless articulation, and collaboration.
• Research the feasibility and potential impact of the development of a transfer scholarship from a community college to a four-year institution.

(r)
(1) The commission shall require all state institutions of higher education to collaborate and develop a transfer pathway for at least the fifty (50) undergraduate majors for which the demand from students is the highest and in those fields of study for which the development of a transfer pathway is feasible based on the nature of the field of study.
(2)
(A) A transfer pathway shall consist of sixty (60) hours of instruction that a student can transfer and apply toward the requirements for a bachelor's degree at a public institution that offers the transfer pathway. The sixty (60) hours of instruction in a transfer pathway shall consist of fortyone (41) hours of general education courses instruction and nineteen (19) hours of pre-major courses instruction, or elective courses instruction that count toward a major, as prescribed by the commission, which shall consider the views of chief academic officers and faculty senates of the respective campuses. Courses in a transfer pathway shall transfer and apply toward the requirements for graduation with a bachelor's degree at all public universities.
(B) An associate of science or associate of arts degree graduate from a Tennessee community college shall be deemed to have met all general education and university parallel core requirements for transfer to a Tennessee public university as a junior. Notwithstanding this subdivision (r)(2)(B), admission into a particular program, school, or college within a university, or into the University of Tennessee, Knoxville, shall remain competitive in accordance with generally applicable policies.
(C) The forty-one-hour lower division general education core common to all state colleges and universities shall be fully transferable as a block to, and satisfy the general education core of, any public community college or university. A completed subject category, for example, natural sciences or mathematics, within the forty-one-hour general education core shall also be fully transferable and satisfy that subject category of the general education core at any public community college or university.
(D) The nineteen-hour lower division AA/AS area of emphasis articulated to a baccalaureate major shall be universally transferable as a block satisfying lower division major requirements to any public university offering that degree program major.
(3) It is the legislative intent that community college students who wish to earn baccalaureate degrees in the state's public higher education system be provided with clear and effective information and directions that specify curricular paths to a degree. To meet the intent of this section, the commission, in consultation with the governing boards of all state institutions of higher education, shall develop, and the governing boards of all state institutions of higher education shall implement, the following:
(A) A common course numbering system, taking into consideration efforts already undertaken, within the community colleges to address the requirements of subdivision (r)(1);
(B) Listings of course offerings that clearly identify courses that are not university parallel courses and therefore not designed to be transferable under subdivision (r)(1); and
(C) A dual admissions policy in which a person who satisfies the admissions requirements of a two-year institution governed by the board of regents and a public university while pursuing a degree program within a transfer pathway program of study is authorized to be admitted to both such institutions.
(4) This subsection (r) shall be fully implemented no later than the fall 2024 semester. Until this subsection (r) is fully implemented, prior to the beginning of each semester, the commission shall report to the chairs of the education and finance, ways and means committees of the senate and the chairs of the education administration and planning and finance, ways and means committees of the house of representatives on the progress made toward completion of the nineteen (19) pre-major course blocks provided in subdivision (r)(2)(D).
(5) The commission shall have ongoing responsibility to update and revise the plans implemented pursuant to this subsection (r) and report to the chairs of the education and finance, ways and means committees of the senate and the chairs of the education administration and finance, ways and means committees of the house of representatives no later than October 1 of each year on the progress made toward full articulation between all public institutions.
For full text of Tennessee Code Annotated, see https://www.tncourts.gov/Tennessee%20Code.
Name Title Affiliation
Kyle Christmas
William Flora
Amy Aldridge Sanford
Cheryl Seay
Executive Director of Accreditation & External Compliance Austin Peay State University
Associate Provost for Curriculum East Tennessee State University
Academic Support Service Provost & Vice Provost Middle Tennessee State University
Assistant Vice President for Academic Affairs & Global Online Tennessee State University
Brandi Fletcher Registrar Tennessee Technological University
Carol Danehower
Matt Matthews
Assistant Provost for Undergraduate Education University of Memphis
Associate Vice President for Academic Affairs University of Tennessee System
Lauren Ingraham, Chair Vice Provost & Professor University of Tennessee, Chattanooga
Allen Dupont
Associate Vice Chancellor for Institutional Effectiveness & Decision Support, SACSCOC Accreditation Liaison
University of Tennessee, Health Science Center
Elizabeth Avery Foster, Co-Chair Vice Provost for Academic Affairs University of Tennessee, Knoxville
Stephanie Kolitsch
Transitional Provost and Senior Vice Chancellor for Academic Affairs University of Tennessee, Martin
Chris Mattingly Vice Provost for Academic Affairs University of Tennessee, Southern
Chuck Lopez, Secretary
Assistant Vice Chancellor for Academic Affairs Tennessee Board of Regents
Laura Cornick Vice President Tennessee Independent Colleges and Universities Association
Julie A. Roberts Chief Academic Officer Tennessee Higher Education Commission
Note: Individual cells containing fewer than ten observations are suppressed, in accordance with FERPA requirements. University of Tennessee Southern and University of Tennessee Health Science Center are not included here. Martin Methodist College merged with the University of Tennessee System as University of Tennessee Southern on July 1, 2021. The most common receiving institutions (columns) for each sending institution (rows) are shown in bold
Note: Individual cells containing fewer than ten observations are suppressed, in accordance with FERPA requirements. University of Tennessee Southern and University of Tennessee Health Science Center are not included here. Martin Methodist College merged with the University of Tennessee System as University of Tennessee Southern on July 1, 2021. The most common receiving institution (columns) for each sending institution (rows) are shown in bold
Notes: All current TTPs (as of summer 2024) are listed here, including those with no enrollments by students in the fall 2018 cohort. “Unknown” is a high share of TTP majors due to historical issues in TTP data tracking. Some TBR institutions do not collect data on the specific TTP in which a student is enrolled; TBR and THEC are making efforts to improve collection of this data. Individual cells containing fewer than ten observations are suppressed, in accordance with FERPA requirements. Due to discrepancies in student matching methodologies between THECSIS, TBR, and the NSC, 676 students were identified as having participated in a TTP despite no NSC record of enrollment at a two-year institution; see page 23 for more details. These students are included in the table above.
Three new TTPs took effect in Fall 2024 and will be included in future reports: Religious Studies, Supply Chain Management, and Special Education.
^ Renamed “Communication Studies” effective Fall 2020; includes “Speech Communication” students prior to Fall 2020.
^^ Phased out by August 2019.
Pre-Clinical Laboratory Sciences
Pre-Dental Hygiene
International Affairs
Secondary Education - Social Studies
Physical Education
Pre-Occupational Therapy
Theatre Arts - Performance
Engineering Technology
Family and Consumer Sciences
Kinesiology
Notes: Only TTPs with credentials in the fall 2018 cohort are shown here. Individual cells containing fewer than ten observations are suppressed, in accordance with FERPA requirements. For some students (n=74), TBR records do not include TTP enrollment but do record that they received a TTP credential; these students are included in this table. Students identified as having earned a TTP credential despite no NSC record of enrollment at a two-year institution (n=22) are included in this table.
^ Renamed “Communication Studies” effective Fall 2020; includes “Speech Communication” students prior to Fall 2020.
APSU: Austin Peay State University
CHSCC: Chattanooga State Community College
CLSCC: Cleveland State Community College
COSCC: Columbia State Community College
DSCC: Dyersburg State Community College
ETSU: East Tennessee State University
JSCC: Jackson State Community College
LGI: Locally Governed Institution
MSCC: Motlow State Community College
MTSU: Middle Tennessee State University
NASCC: Nashville State Community College
NESCC: Northeast State Community College
PSCC: Pellissippi State Community College
RSCC: Roane State Community College
STCC: Southwest Tennessee Community College
TSU: Tennessee State University
TTU: Tennessee Technological University
UM: University of Memphis
UTC: The University of Tennessee at Chattanooga
UTHSC: The University of Tennessee Health Science Center
UTK: The University of Tennessee, Knoxville
UTM: The University of Tennessee at Martin
UTS: The University of Tennessee Southern
VSCC: Volunteer State Community College
WSCC: Walters State Community College
TBR: Tennessee Board of Regents
TCAT: Tennessee College of Applied Technology
THEC: Tennessee Higher Education Commission
TICUA: Tennessee Independent Colleges and Universities Association
UT: The University of Tennessee