P O R T S T. L U C I E
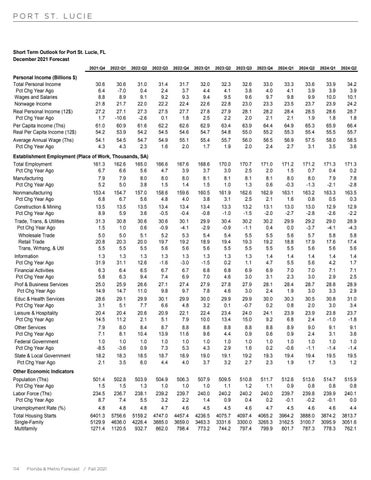
Short Term Outlook for Port St. Lucie, FL December 2021 Forecast 2021:Q4
2022:Q1
2022:Q2
2022:Q3
2022:Q4
2023:Q1
2023:Q2
2023:Q3
2023:Q4
2024:Q1
2024:Q2
2024:Q1
2024:Q2
Personal Income (Billions $) Total Personal Income Pct Chg Year Ago Wages and Salaries Nonwage Income
30.6 6.4 8.8 21.8
30.6 -7.0 8.9 21.7
31.0 0.4 9.1 22.0
31.4 2.4 9.2 22.2
31.7 3.7 9.3 22.4
32.0 4.4 9.4 22.6
32.3 4.1 9.5 22.8
32.6 3.8 9.6 23.0
33.0 4.0 9.7 23.3
33.3 4.1 9.8 23.5
33.6 3.9 9.9 23.7
33.9 3.9 10.0 23.9
34.2 3.9 10.1 24.2
Real Personal Income (12$) Pct Chg Year Ago
27.2 1.7
27.1 -10.6
27.3 -2.6
27.5 0.1
27.7 1.8
27.8 2.5
27.9 2.2
28.1 2.0
28.2 2.1
28.4 2.1
28.5 1.9
28.6 1.8
28.7 1.8
Per Capita Income (Ths) Real Per Capita Income (12$)
61.0 54.2
60.9 53.9
61.6 54.2
62.2 54.5
62.6 54.6
62.9 54.7
63.4 54.8
63.9 55.0
64.4 55.2
64.9 55.3
65.3 55.4
65.9 55.5
66.4 55.7
Average Annual Wage (Ths) Pct Chg Year Ago
54.1 4.3
54.5 4.3
54.7 2.3
54.9 1.6
55.1 2.0
55.4 1.7
55.7 1.9
56.0 2.0
56.5 2.4
56.9 2.7
57.5 3.1
58.0 3.5
58.5 3.6
Establishment Employment (Place of Work, Thousands, SA) Total Employment Pct Chg Year Ago
161.3 6.7
162.6 6.6
165.0 5.6
166.6 4.7
167.6 3.9
168.6 3.7
170.0 3.0
170.7 2.5
171.0 2.0
171.2 1.5
171.2 0.7
171.3 0.4
171.3 0.2
Manufacturing Pct Chg Year Ago
7.9 5.2
7.9 5.0
8.0 3.8
8.0 1.5
8.0 1.4
8.1 1.5
8.1 1.0
8.1 1.3
8.1 0.6
8.0 -0.3
8.0 -1.3
7.9 -2.1
7.8 -2.8
Nonmanufacturing Pct Chg Year Ago
153.4 6.8
154.7 6.7
157.0 5.6
158.6 4.8
159.6 4.0
160.5 3.8
161.9 3.1
162.6 2.5
162.9 2.1
163.1 1.6
163.2 0.8
163.3 0.5
163.5 0.3
Construction & Mining Pct Chg Year Ago
13.5 8.9
13.5 5.9
13.5 3.6
13.4 -0.5
13.4 -0.4
13.4 -0.8
13.3 -1.0
13.2 -1.5
13.1 -2.0
13.0 -2.7
13.0 -2.8
12.9 -2.6
12.9 -2.2
Trade, Trans, & Utilities Pct Chg Year Ago
31.3 1.5
30.8 1.0
30.6 0.6
30.6 -0.9
30.1 -4.1
29.9 -2.9
30.4 -0.9
30.2 -1.1
30.2 0.4
29.9 0.0
29.2 -3.7
29.0 -4.1
28.9 -4.3
Wholesale Trade Retail Trade Trans, Wrhsng, & Util
5.0 20.8 5.5
5.0 20.3 5.5
5.1 20.0 5.5
5.2 19.7 5.6
5.3 19.2 5.6
5.4 18.9 5.6
5.4 19.4 5.5
5.5 19.3 5.5
5.5 19.2 5.5
5.6 18.8 5.5
5.7 17.9 5.6
5.8 17.6 5.6
5.8 17.4 5.6
Information Pct Chg Year Ago
1.3 31.9
1.3 31.1
1.3 12.6
1.3 -1.6
1.3 -3.0
1.3 -1.5
1.3 0.2
1.3 1.1
1.4 4.7
1.4 5.5
1.4 5.6
1.4 4.2
1.4 1.7
Financial Activities Pct Chg Year Ago
6.3 5.8
6.4 6.3
6.5 9.4
6.7 7.4
6.7 6.9
6.8 7.0
6.8 4.6
6.9 3.0
6.9 3.1
7.0 2.3
7.0 3.0
7.1 2.9
7.1 2.5
Prof & Business Services Pct Chg Year Ago
25.0 14.9
25.9 14.7
26.6 11.0
27.1 9.8
27.4 9.7
27.9 7.8
27.8 4.6
27.9 3.0
28.1 2.4
28.4 1.9
28.7 3.0
28.8 3.3
28.9 2.9
Educ & Health Services Pct Chg Year Ago
28.6 3.1
29.1 5.1
29.9 7.7
30.1 6.6
29.9 4.8
30.0 3.2
29.9 0.1
29.9 -0.7
30.0 0.2
30.3 0.8
30.5 2.0
30.8 3.0
31.0 3.4
Leisure & Hospitality Pct Chg Year Ago
20.4 14.5
20.4 11.2
20.6 2.1
20.9 5.1
22.1 7.9
22.4 10.0
23.4 13.4
24.0 15.0
24.1 9.2
23.9 6.8
23.9 2.4
23.8 -1.0
23.7 -1.8
7.9 7.1
8.0 8.1
8.4 10.4
8.7 13.9
8.8 11.6
8.8 9.6
8.8 4.4
8.8 0.9
8.8 0.6
8.9 0.9
9.0 2.4
9.1 3.1
9.1 3.6
Federal Government Pct Chg Year Ago
1.0 -8.5
1.0 -3.6
1.0 0.9
1.0 7.3
1.0 5.3
1.0 4.3
1.0 2.9
1.0 1.6
1.0 0.2
1.0 -0.6
1.0 -1.1
1.0 -1.4
1.0 -1.4
State & Local Government Pct Chg Year Ago
18.2 2.1
18.3 3.5
18.5 6.0
18.7 4.4
18.9 4.0
19.0 3.7
19.1 3.2
19.2 2.7
19.3 2.3
19.4 1.9
19.4 1.7
19.5 1.3
19.5 1.2
Population (Ths) Pct Chg Year Ago
501.4 1.5
502.8 1.5
503.9 1.3
504.9 1.0
506.3 1.0
507.9 1.0
509.5 1.1
510.8 1.2
511.7 1.1
512.6 0.9
513.6 0.8
514.7 0.8
515.9 0.8
Labor Force (Ths) Pct Chg Year Ago
234.5 8.7
236.7 7.4
238.1 5.5
239.2 3.2
239.7 2.2
240.0 1.4
240.2 0.9
240.2 0.4
240.0 0.2
239.7 -0.1
239.8 -0.2
239.9 -0.1
240.1 0.0
4.8
4.8
4.8
4.7
4.6
4.5
4.5
4.6
4.7
4.5
4.6
4.6
4.4
6401.3 5129.9 1271.4
5756.6 4636.0 1120.5
5159.2 4226.4 932.7
4747.0 3885.0 862.0
4457.4 3659.0 798.4
4236.5 3463.3 773.2
4075.7 3331.6 744.2
4097.4 3300.0 797.4
4065.2 3265.3 799.9
3964.2 3162.5 801.7
3888.0 3100.7 787.3
3874.2 3095.9 778.3
3813.7 3051.6 762.1
Other Services Pct Chg Year Ago
Other Economic Indicators
Unemployment Rate (%) Total Housing Starts Single-Family Multifamily
114
Florida & Metro Forecast / Fall 2021