
Santa Barbara Area Market Report
SANTA BARBARA AREA REAL ESTATE
THROUGH SEPTEMBER 2025

TOTAL SALES
1,021 (+9% over 2024)
Review in Numbers
SOUTH SANTA BARBARA COUNTY SEPTEMBER 2025 YTD
SINGLE FAMILY RESIDENCE SALES
743 (+12% over 2024)
CONDOMINIUM SALES
278 (+3% over 2024)
Greetings, and thank you for reading our Third Quarter 2025 Market Report.
Throughout the year, we’ve monitored the macro environment and its effect on our local real estate market, largely focused on the impacts of tariffs and interest rates.
Generally speaking, Q3 2024 is a strong quarter to compare. In Q3 2025, Inventory, Sales, and Months of Supply were up year-over-year, indicating a healthier and more balanced market than we’ve seen over the past few years. In pricing, we saw a near term peak in Q1 2025 at $2MM, a breather in Q2 likely as a result of macro uncertainty (to $1.83MM), and a bounce back in Q3 to just under $1.9MM which is flat compared to Q3 2024. We view these dynamics as healthy when you consider strong annual price appreciation over the past five years, interest rates projected to decline, and macro uncertainty potentially fading into Q4.
We hope this report provides valuable context for evaluating the real estate market, but the nuances of each submarket, neighborhood and property are unique. Our team is well-seasoned and strategically positioned to capitalize on them for you. Should you have specific inquiries about your submarket, or a specific property, please do not hesitate to contact us. The entire Village Properties team is dedicated to providing you with tailored insights and consistent, exceptional service.
Best regards,
Renee Grubb
S ingle Family
SOUTH SANTA BARBARA COUNTY
SEPTEMBER 2025 YTD
AVERAGE SALES PRICE • YTD
$3,578,876 -2% change from 2024
MEDIAN SALES PRICE • YTD
$2,362,230 +6% change from 2024


SOUTH SANTA BARBARA COUNTY SEPTEMBER 2025 YTD
AVERAGE SALES PRICE • YTD
$1,397,441 +14% change from 2024
MEDIAN SALES PRICE • YTD
$1,099,000 +11% change from 2024
SALES & INVENTORY
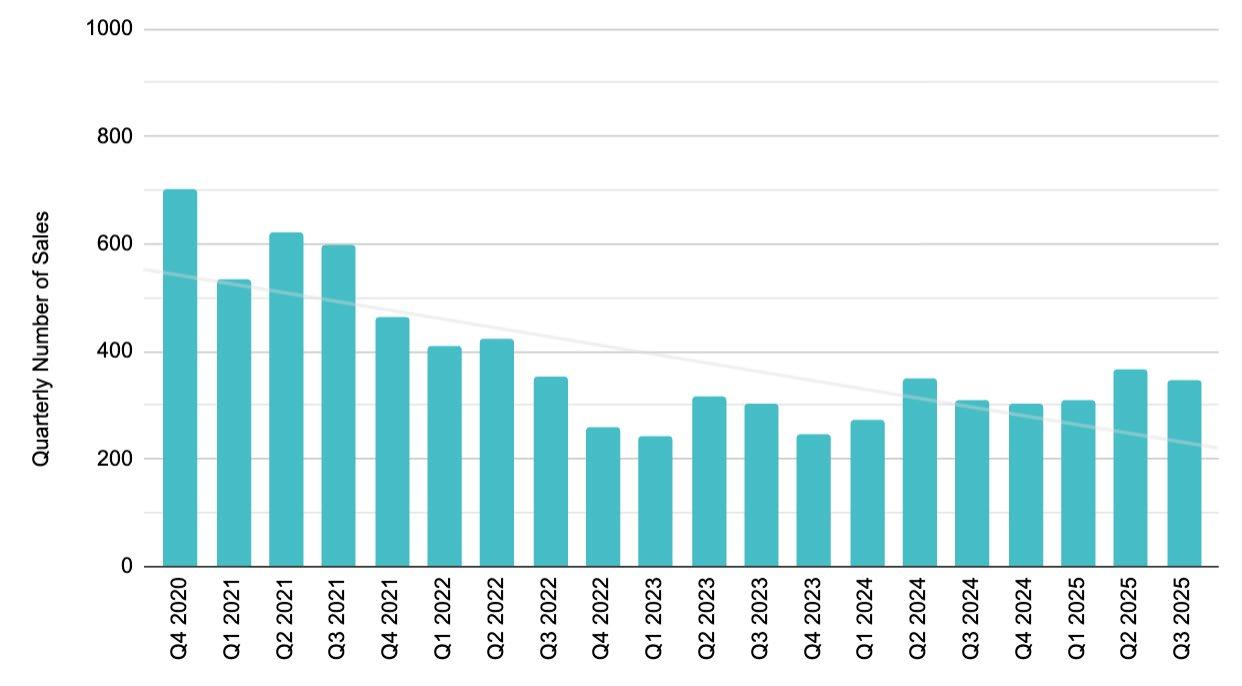
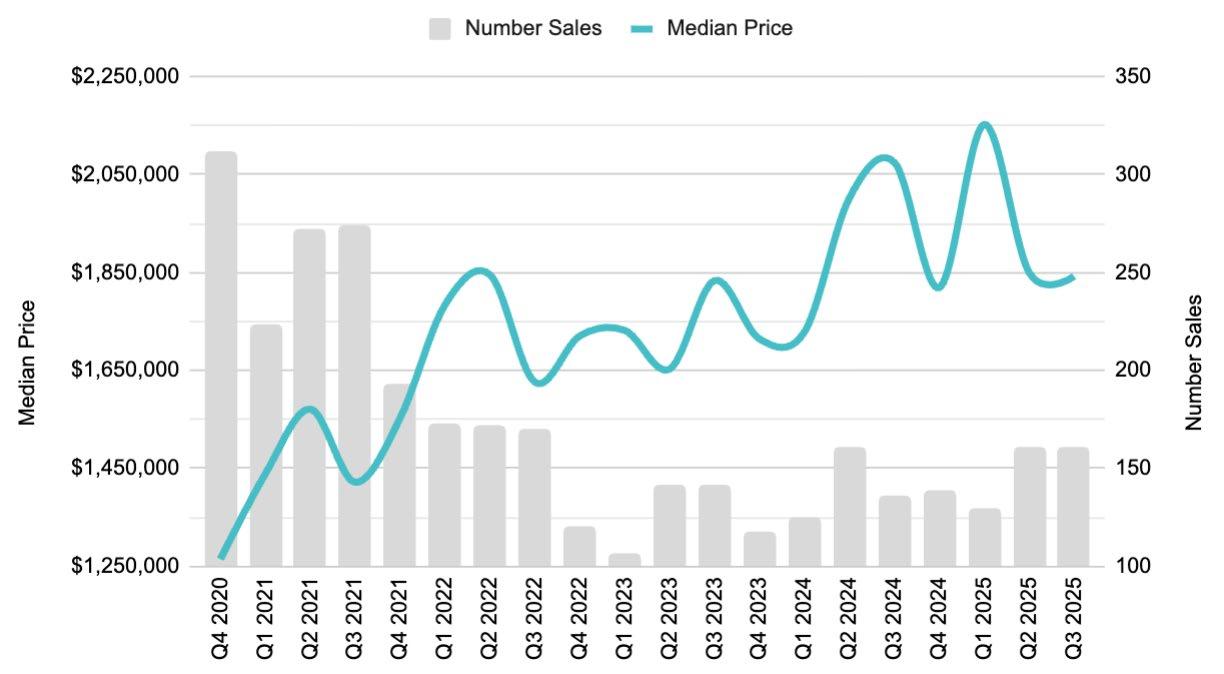
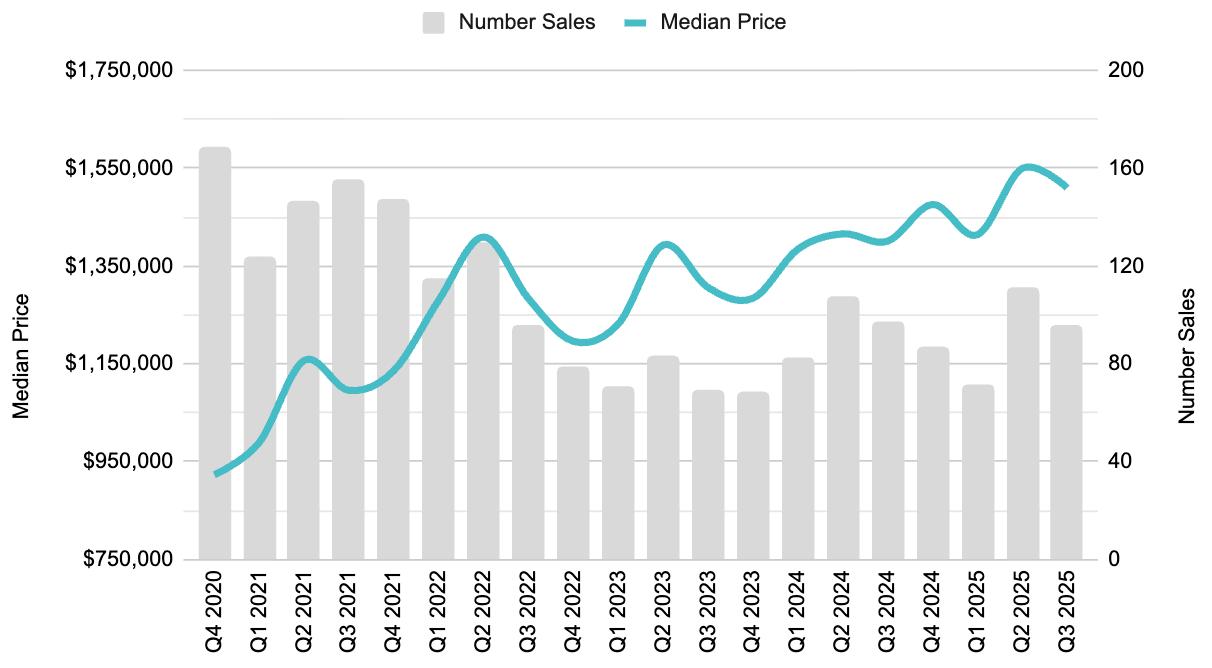
In the Third Quarter, there were 345 closings across the South County, a 5% decrease from Q2 but an 11% increase YoY. The 5% quarterly decline is in line with, and even more mild than the seasonal changes we’ve seen recently. Sales declined 8% on average from Q2 to Q3 in years 2019 - 2024, excluding 2020 where sales exploded 103% QoQ during covid. As a reminder, Q4 2024 and Q1 2025 both showed double digit YoY increases in sales (Q4 = 23%, Q1 = 14%). Q2 2025 sales decelerated to 4% YoY. While we are not back at the YoY pace we saw in Q4 and Q1, it seems we have overcome some of the tariff uncertainty and back on a double digit trendline.
Inventory and Months of Supply (MoS) continues toward supply/demand equilibrium during the quarter, with 3.9 months of supply at the end of September. We started the year at 2.6 MoS. Typically four to six MoS equals a neutral, balanced market. Excluding May - July 2020, the last time we’ve experienced a balanced market was pre-covid in 2019. Using another example, average Days on Market (DoM) in 2019 was 75 days. During our dramatic undersupply condition that persisted from 2021 through 2023, average DoM hit its trough at just 24 days (2022). Year-to-date in 2025, DoM has averaged 38 days.
Santa Barbara Area real estate market
SOUTH SANTA BARBARA COUNTY · THROUGH SEPTEMBER 2025
PRICING
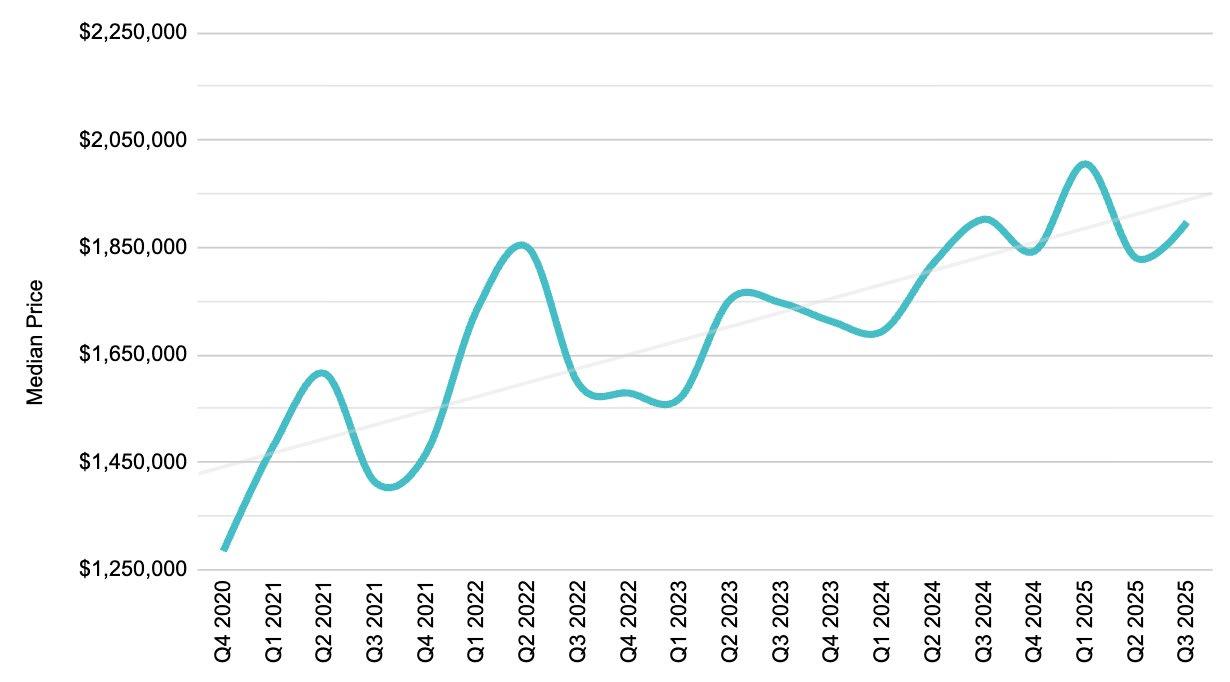
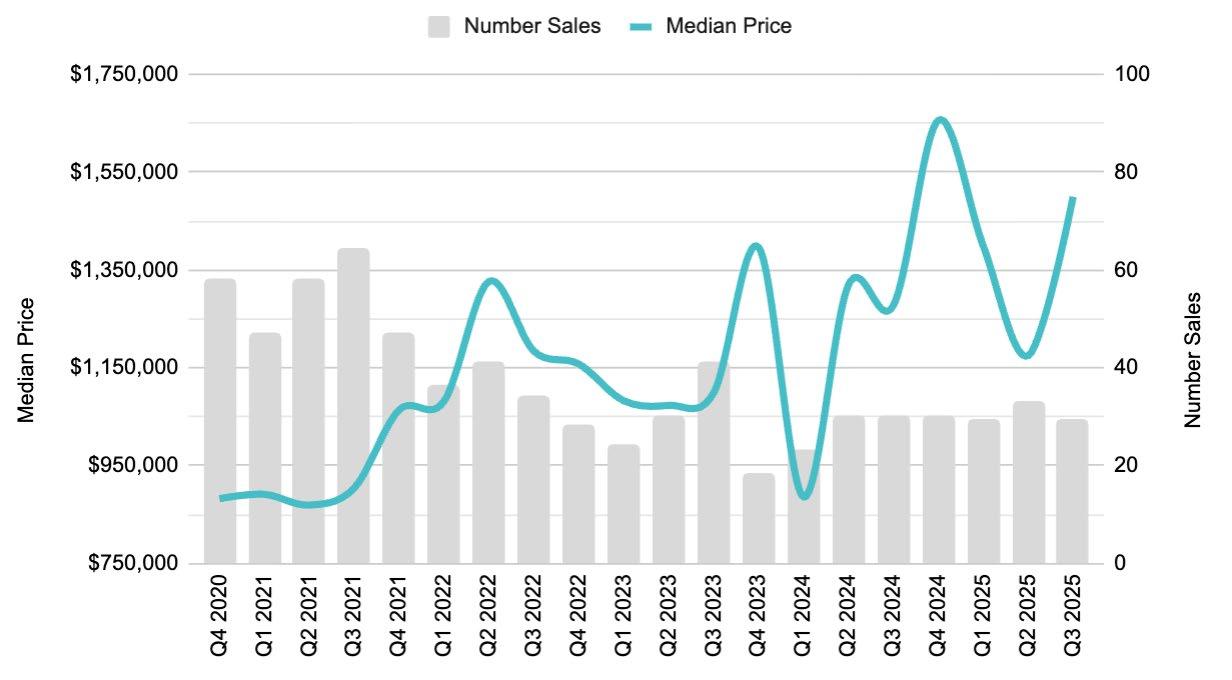
While sales were up 11% YoY, Median Pricing across the South County, at $1.9MM, remained flat as compared to Q3 2024 with modest changes in the percentage of sales across submarkets (aka mix shift). Compared to Q2 2025, Median Price increased a mild 4% (from $1.83MM). Since Q2 2024, Median Pricing has ranged from $1.8MM to $2MM, in stark contrast to the beginning of the past 5 year period (Q4 2020), where Median Price was $1.3MM, a 46% increase or +9% per year on average. Performance should always be more closely analyzed by submarket, however.

SEPTEMBER 2025

$959,934
$875,000
Carpinteria
This was the sixth straight quarter where there were ~30 closed sales in Carp, with 29 in Q3. Median Price increased by 17% from Q3 2024, to $1.5MM. Other than Q4 2024, this is the highest quarter on record for median pricing in Carpinteria. The most notable sale this quarter was 630 Polo Way $6.34MM (the first closing at Polo Residences, the new construction development adjacent to the Santa Barbara Polo & Racquet Club).


Summerland
Summerland had only two closed sales this quarter, down from five in Q3 2024. While overall market has appreciated at 9% on average the past five years, pricing in Summerland has actually declined by -.5% on average. Median Price for the quarter was $1.73MM.
SEPTEMBER 2025


SEPTEMBER 2025
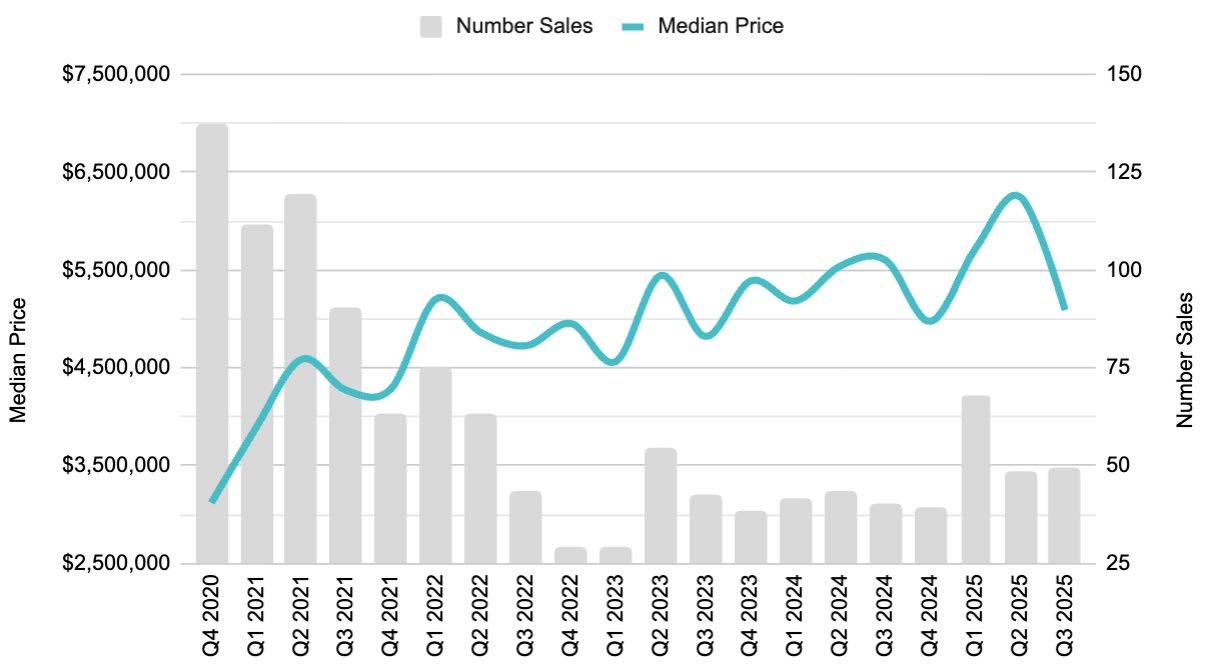
$5,184,941 -27% change from 2024

SALES PRICE · YTD $6,150,000
$4,250,000 -35% change from 2024
SALES · YEAR TO DATE
$3,284,668
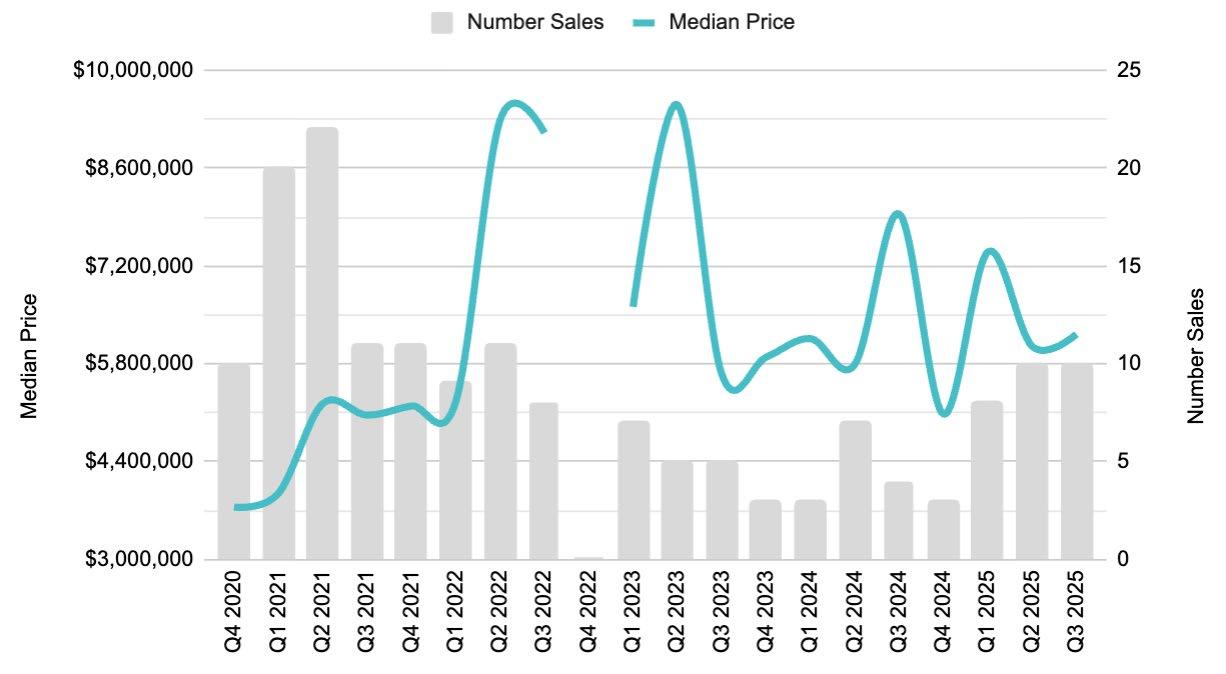
Montecito
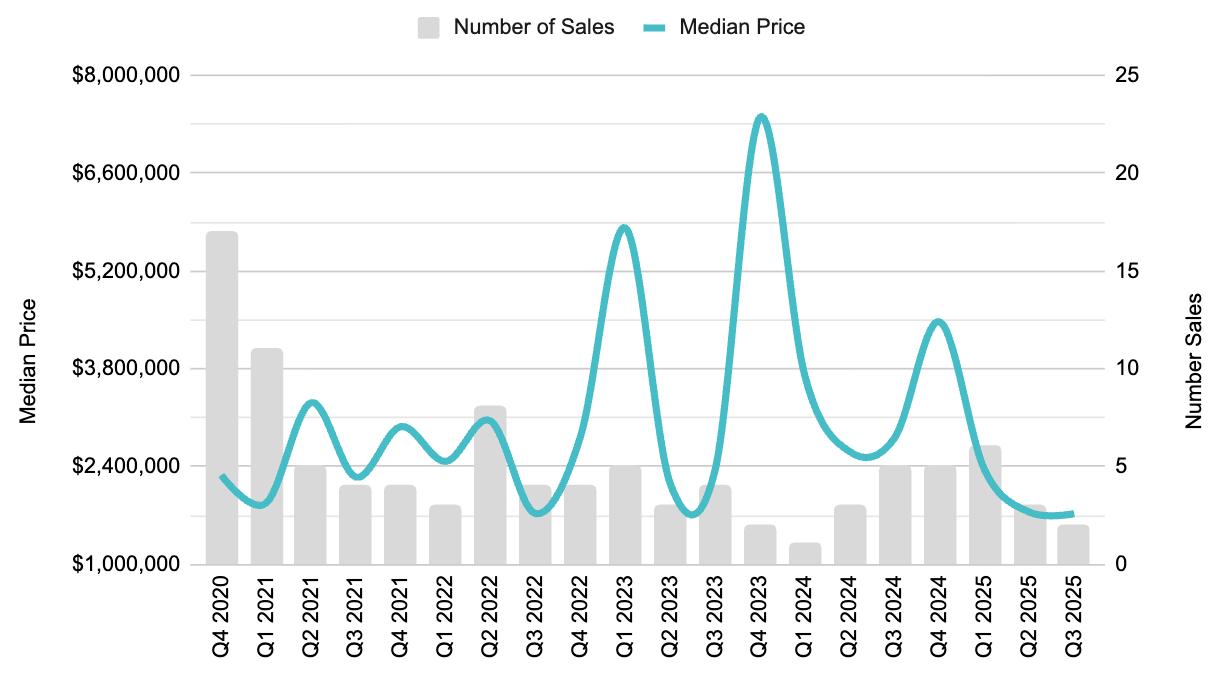
Montecito continues to perform, with 49 sales in the quarter, up 23% from Q3 2024. Median Price declined, however, from $5.6MM in Q3 2024 to $5.1MM in Q3 2025 (-9%). This quarter, for context, there were eight sales over $10MM and one over $50MM (as compared to six sales over $10MM and two over $15MM in Q3 2024). Thus, the decline in Median Price is not necessarily due to a “softer” high end of the market, it seems there were more transactions of lower priced inventory, especially condominiums, that skewed the price lower. Year-to-date, condos have made up 20% of Montecito sales, as compared to 12% YTD 2024. Whereas the overall market has increased 9% on average the past five years, Montecito prices have increased 13%. The most notable transaction this quarter included two parcels on San Ysidro Rd for $55MM.

Santa Barbara
There were 160 closed sales in Santa Barbara this quarter, up 19% from Q3 2024. Median Price, at $1.84MM, was down 11% from one year ago. There were six sales over $5MM, comparable to Q3 2024. Other than Q1 2025 at $2.15MM, Q3 2024 at $2.1MM, was the highest quarterly price on record for Santa Barbara. The South County market is typically made up of ~45% of sales in Santa Barbara proper, therefore they are typically very correlated. Therefore, it should come as no surprise that Santa Barbara’s pricing has increased at a 9% rate on average over the past five years. The most notable sale this quarter was 530 Plaza Rubio for $7.2MM.
Barbara
SEPTEMBER 2025

329
$1,395,360
$1,165,000


Hope Ranch
After 10 sales in Q2, Hope Ranch showed strong sales activity yet again with 10 sales in Q3 2025 (+150% from one year ago). Even though pricing is skewed due to few sales, Hope Ranch prices have increased 13% on average over the past five years. The most notable sale this quarter was 4621 Via Roblada.

Goleta
After a very strong Q2 with 111 sales, there were 95 sales in Q3, relatively unchanged from Q3 2024. Median Price, however, increased 8% to $1.51MM (down slightly from $1.55MM in Q2). Whereas overall market pricing has increased 9% on average the past five years, Goleta has increased 13% on average. The most notable sale this quarter was 4895 Via Los Santos for $4.4MM, in the Foothills around San Antonio Creek.
SEPTEMBER 2025
34

193
$1,700,000 +15% change from 2024
$1,047,147
$960,000
Santa Ynez Valley Review in Numbers
SANTA YNEZ VALLEY
SEPTEMBER 2025 YTD
TOTAL SALES
142 (+19% over 2024)
SINGLE FAMILY RESIDENCE SALES
117
(+21% over 2024)
CONDOMINIUM SALES
25
(+14% over 2024)
S ingle Family
SANTA YNEZ VALLEY
SEPTEMBER 2025 YTD
AVERAGE SALES PRICE • YTD
$2,212,093
+7% change from 2024
MEDIAN SALES PRICE • YTD
$1,800,000
+16% change from 2024


SANTA YNEZ VALLEY SEPTEMBER 2025 YTD
AVERAGE SALES PRICE • YTD
$796,188
+9% change from 2024
MEDIAN SALES PRICE • YTD
$719,900
+5% change from 2024


15

Los Olivos & Santa Ynez
Santa Ynez

SINGLE
TOTAL SALES · YEAR TO DATE
3 AVERAGE SALES PRICE · YTD $1,777,555
MEDIAN SALES PRICE · YTD $1,820,000 SINGLE FAMILY RESIDENCES
YTD
TOTAL SALES · YEAR TO DATE
41
AVERAGE SALES PRICE · YTD
$2,986,612
MEDIAN SALES PRICE · YTD $2,650,000
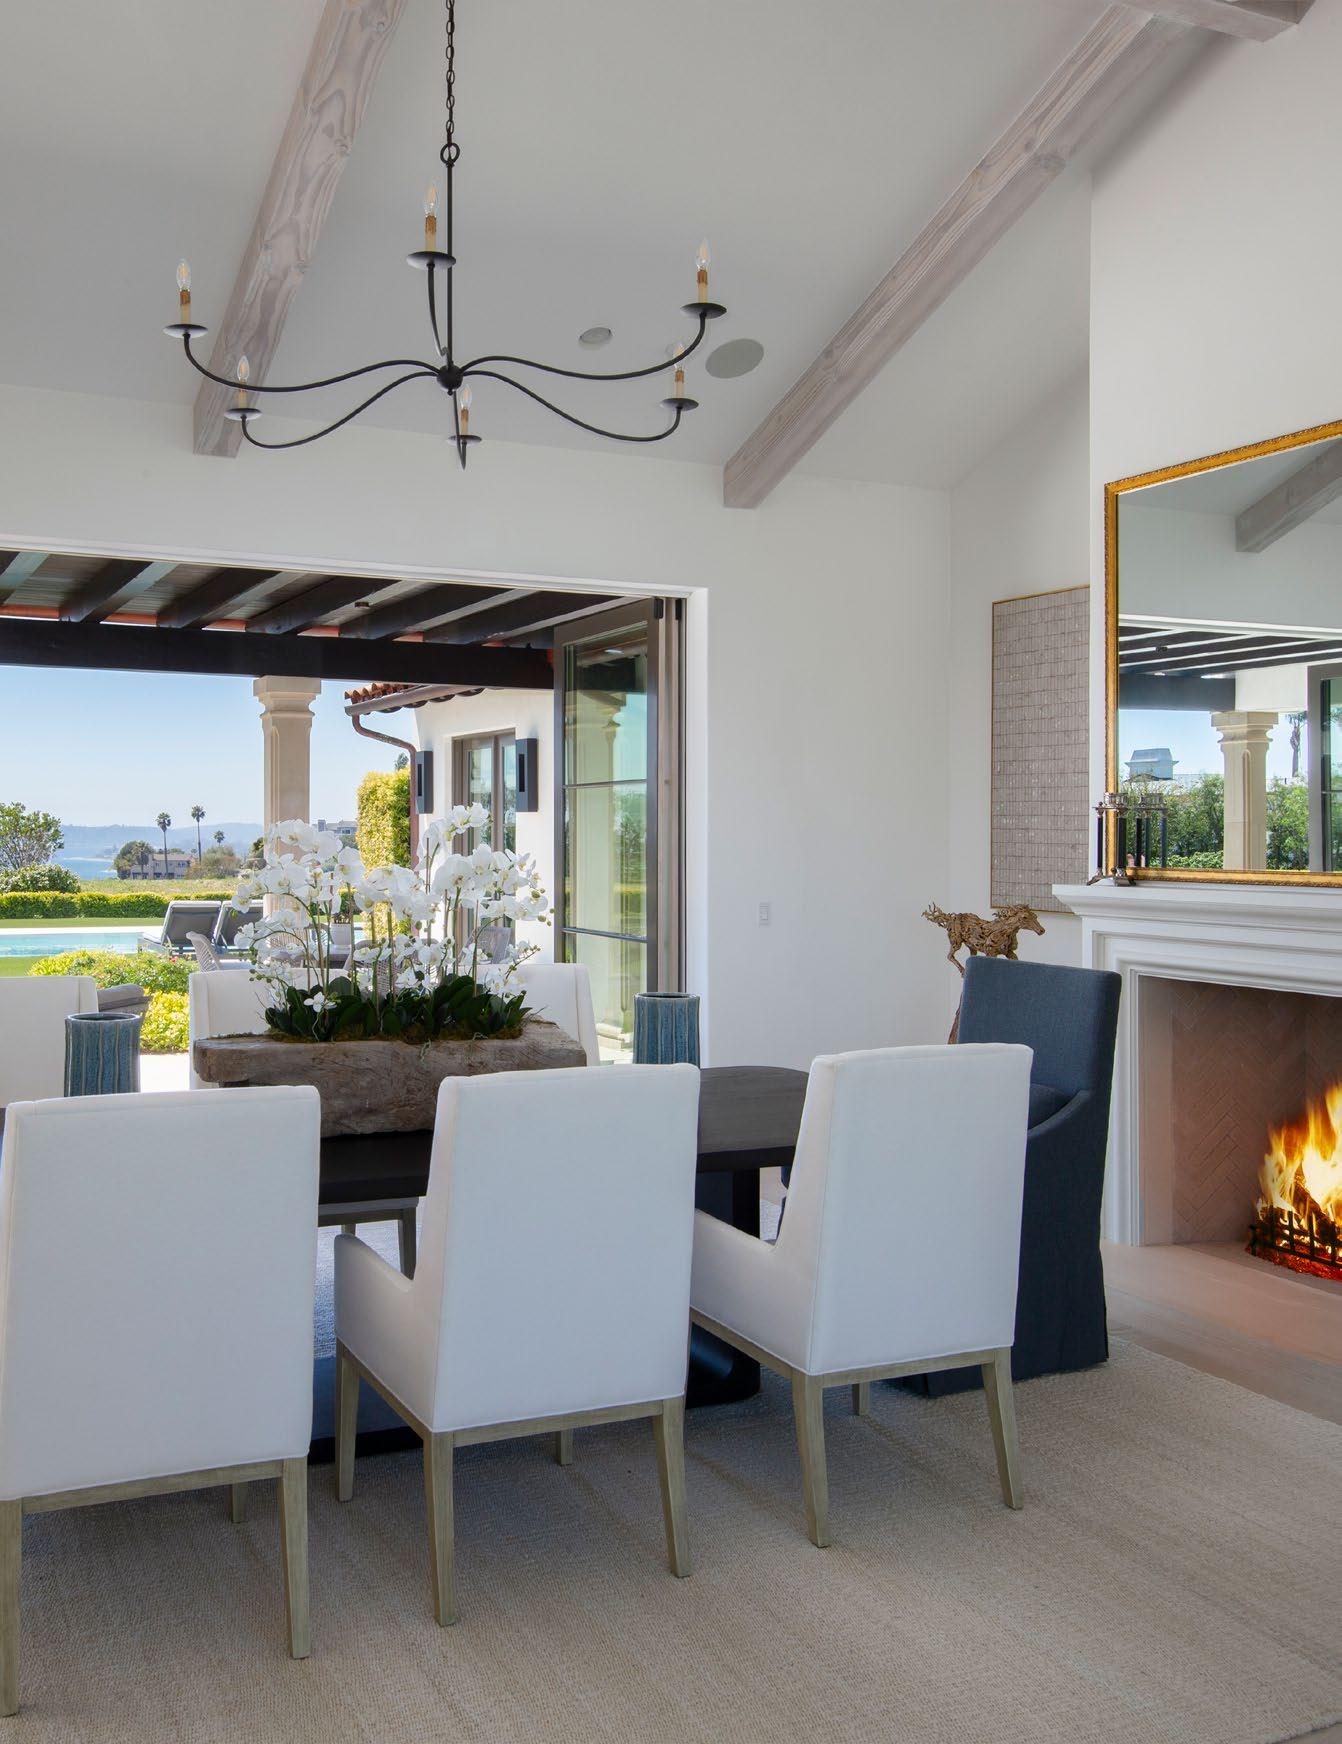
5139 CATHEDRAL OAKS, SANTA BARBARA

Global Connections

“Our global partners ensure your home is seen by interested buyers across the world.”
RENEÉ GRUBB Founder & CEO

We are fortunate to be in a place that people all over the world desire to be. We cultivate strategic global relationships that ultimately benefit you by putting your home in front of those people.