


Macroeconomy Overview
Population 4 1.93% 1.93% 1.98% 2.06% 1.74% 2.63% 1.21% 0 5 0 0 1 0 0 0 1 5 0 0 2 0 0 0 2 5 0 0 3 0 0 0 P o p u l a t i o n 2014 2015 2016 2017 2018 2019 2021
Source of Population Growth
5
Households 6 2.74% 2.54% 1.35% 2.87% 1.70% 2.29% 3.32% 0 2 0 0 4 0 0 6 0 0 8 0 0 1 0 0 0 1 2 0 0 H o u s e h o l d 2014 2015 2016 2017 2018 2019 2021
7 2 . 5 5 2 . 6 2 . 6 5 H o u s e h o l d S i z e 2014 2015 2016 2017 2018 2019 2021 year
Household size
Housing units 8 1.85% 1.69% 1.63% 2.22% 2.07% 3.32% 2.50% 0 2 0 0 4 0 0 6 0 0 8 0 0 1 0 0 0 1 2 0 0 H o u s i n g U 2014 2015 2016 2017 2018 2019 2021
Changes in Household and Housing Units 9 0 1 0 2 0 3 0 4 0 5 0 6 0 7 0 C h a n g e s i n 2014 2015 2016 2017 2018 2019 2021 Households Increase Housing Units Increase
Vacancy Rate 10 9.23% 8.48% 8.73% 8.15% 8.48% 9.40% 7.96% 0 2 0 4 0 6 0 8 0 1 0 0 1 2 0 V a c a n t U n 2014 2015 2016 2017 2018 2019 2021
Owner-Occupied Market
Single-Family

House Prices 300000 400000 500000 600000 0 1 2 0 2 0 0 4 Charlotte Region Median Price Charlotte Region Average Price Mecklenburg Median Price Mecklenburg Average Price
Median House Price
• From Sept 2021-Sept 2022: 14.2% • From Sept 2020-Sept 2021: 16.3% • From Jan 2020-Sept 2022: 54%
Days on the Market
0 2 4 6 8 10 12 14 16 18 20 M e d i a n 0 1 2
Sold above Listing Price 20% 30% 40% 50% 60% P e r c e n t S o 0 1 2 0
Price Distribution 16 0 5 1 0 1 5 P e r c e n t 05
House
Price Growth Rate 17 2001-2011 2011-2021 10th Percentile -1.54% 15.13% 25th Percentile 2.60% 10.82% Median 1.75% 8.15% 75th Percentile 3.00% 6.02% 90th Percentile 6.23% 5.10%
30-Year Fixed Mortgage Interest Rate
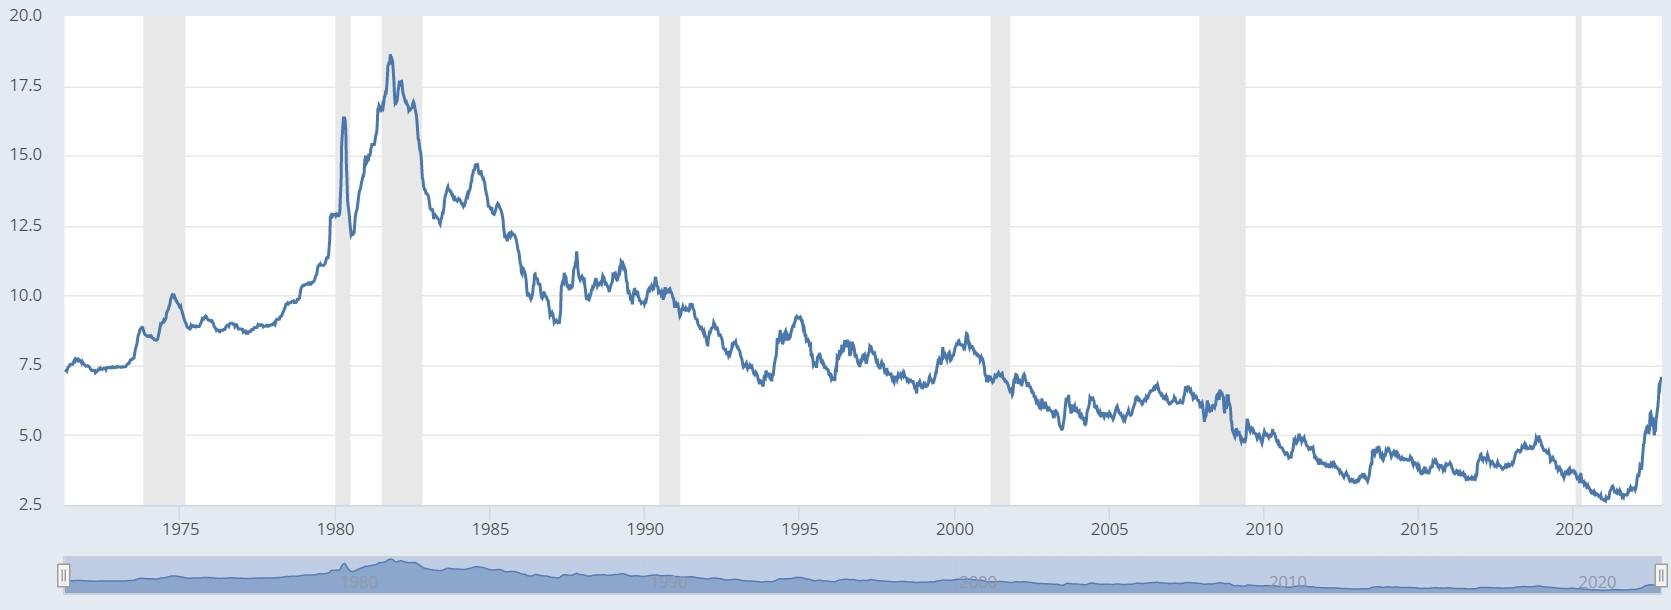
18
Income and Affordability 19 Year 10th Percentile Price 25th Percentile Price Median Price 2018 $45,138 $57,351 $75,917 2019 $46,778 $59,205 $75,668 2020 $50,617 $62,860 $79,014 2021 $56,916 $72,014 $89,816 2022 $83,348 $109,103 $136,750
20 • 50% cannot afford the 10th percentile price • 80% cannot afford the median price
Affordability
Rental Market
Apartment Rent 22 8 0 0 1 0 0 0 1 2 0 0 1 4 0 0 1 6 0 0 E f f e c t i v 2 0 0 2
Effective Rent/Unit Effective Rent/Sq Foot
Single Family Rental 23 1000
2 0 0 3 2 0 year Charlotte Region Median Rent Charlotte Region Average Rent Mecklenburg Median Rent Mecklenburg Average Rent
1500 2000
Comparative Analysis
(Regional Competitors) 25 1.04% 0.68% 1.21% -0.16% 0.45% 2.05% 1.03% 2.48% 0 5 0 0 1 0 0 0 1 5 0 0 2 0 0 0 2 5 0 0 3 0 0 0 P o p u l a t i o n ( Asheville Charleston Charlotte Columbia Greensboro Raleigh Richmond Spartanburg
Population
(National Competitors) 26 1.04% 2.78% 1.21% 0.94% 0.09% 1.27% -0.32% 2.04% 0.35% 1.00% 0.99% 0.39% 0 1 0 0 0 2 0 0 0 3 0 0 0 4 0 0 0 5 0 0 0 6 0 0 0 P o p u l a t
Population
Median House Price (Regional Competitors) 27 10.13% 8.77% 10.69% 6.21% 6.74% 10.13% 9.21% 10.33% 0 5 0 1 0 0 1 5 0 2 0 0 2 5 0 3 0 0 3 5 0 M e d i a n Asheville Charleston Charlotte Columbia Greensboro Raleigh Richmond Spartanburg
Median House Price (National Competitors) 28 10.16% 11.68% 10.69% 8.16% 8.94% 10.20% 12.08% 9.99% 8.72% 8.73% 8.71% 11.65% 0 1 0 0 2 0 0 3 0 0 4 0 0 5 0 0 M e d i a
Median Multiple (Regional Competitors) 29 7.51% 7.10% 7.02% 3.92% 0.92% 6.72% 4.83% 5.54% 0 . 5 1 1 . 5 2 2 . 5 3 3 . 5 4 4 . 5 5 P r i c eI Asheville Charleston Charlotte Columbia Greensboro Raleigh RichmondSpartanburg
Median Multiple (National Competitors) 30 5.93% 8.02% 7.02% 5.06% 5.85% 3.96% 11.09% 8.11% 5.10% 3.65% 5.05% 7.08% 0 1 2 3 4 5 6 P r i c eI n
