Accelerated Testing
Statistical Models, Test Plans, and Data Analyses
WAYNE NELSON
Consultant, Schenectady, NY
A JOHN WILEY & SONS, INC., PUBLICATION
Copyright 0 1990,2004 by John Wiley & Sons, Inc. All rights reserved.
Published by John Wiley & Sons, Inc., Hoboken, New Jersey.
Published simultaneously in Canada.
No part of this publication may be reproduced, stored in a retrieval system or transmitted in any form or by any means, electronic, mechanical, photocopying, recording, scanning or otherwise, except as permitted under Sections 107 or 108 of the 1976 United States Copyright Act, without either the prior written permission of the Publisher, or authorization through payment of the appropriate per-copy fee to the Copyright Clearance Center, 222 Rosewood Drive, Danvers, MA 01923, (978) 750-8400, fax (978) 750-4470. Requests to the Publisher for permission should be addressed to the Permissions Department, John Wiley At Sons, Inc., 1 I1 River Street, Hoboken, NJ 07030, (201) 748-6011, fax (201) 748-6008.
Limit of Liability/Disclaimer of Warranty: While the publisher and author have used their best efforts in preparing this book, they make no representation or warranties with respect to the accuracy or completeness of the contents of this book and specifically disclaim any implied warranties of merchantability or fitness for a particular purpose. No warranty may be created or extended by sales representatives or written sales materials. The advice and strategies contained herein may not be suitable for your situation. You should consult with a professional where appropriate. Neither the publisher nor author shall be liable for any loss of profit or any other commercial damages, including but not limited to special, incidental, consequential,or other damages.
For general information on our other products and services please contact our Customer Care Department within the US. at 877-762-2974, outside the US. at 317-572-3993or fax 3 17-572-4002.
Wiley also publishes its books in a variety of electronic formats. Some content that appears in print, however, may not be available in electronic format.
Library ojcongress Cataloging-in-Publication is available.
ISBN 0-47 1-69736-2
Printed in the United States of America.
I0987654321
This book is gratefully dedicated to the many clients whose fruitful collaboration and challenging applications stimulated my interest and developments in accelerated testing, and to the many colleagues who kindly provided me with examples, references, suggestions, and encouragement.
Preface, xi
1. Introduction and Background, 1
1. Survey of Methodology and Applications, 3
2. Types of Data, 12
3. Types of Acceleration and Stress Loading, 15
4. Engineering Considerations, 22
5. Common Accelerated Tests, 37
6. Statistical Considerations, 43 Problems, 49
2. Models for Ufe Tests with Constant Stress, 51
13. 14. Introduction, 51
Basic Concepts and the Exponential Distribution, 53
Normal Distribution, 58
Lognormal Distribution, 60
Weibull Distribution, 63
Extreme Value Distribution, 65
Other Distributions, 68
Life-Stress Relationships, 71
Arrhenius Life-Temperature Relationship, 75
Inverse Power Relationship, 85
Endurance (Fatigue) Limit Relationships and Distributions, 92 Other Single Stress Relationships, 95 Multivariable Relationships, 98
Spread in Log Life Depends on Stress, 105 Problems, 107
3. Graphical Data Analysis, 113
1. Introduction, 113
2. Complete Data and Arrhenius-Lognormal Model, 114
3. Complete Data and Power-Weibull Model, 128
4. Singly Censored Data, 134
5. Multiply Censored Data, 139
6. Interval (Read-Out) Data, 145 Problems, 154
4. Complete Data and Least Squares Analyses, 167
1. Introduction, 167
2. Least-Squares Methods for Lognormal Life, 170
3. Checks on the Linear-Lognormal Model and Data, 182
4. Least-Squares Methods for Weibull and Exponential Life, 189
5. Checks on the Linear-WeibullModel and Data, 203
6. Multivariable Relationships, 210 Problems, 229
5. Censored Data and Maximum Ukelihood Methods, 233
1. Introduction to Maximum Likelihood, 234
2. Fit the Simple Model to Right Censored Data, 242
3. Assess the Simple Model and Right Censored Data, 255
4. Other Models and wes of Data, 265
5. Maximum Likelihood Calculations, 284 Problems, 302
6. Test Plans, 317
1. Plans for the Simple Model and Complete Data, 317
2. Plans for the Simple Model and Singly Censored Data, 328
3. Evaluation of a Test Plan by Simulation, 349
4. Survey of Test Plans, 361
5. ML Theory for Test Plans, 364 Problems, 371
7. Competing Failure Modes and Size Effect, 377
1. Series-System Model, 378
2. Series Systems of Identical Parts, 383
3. Size Effect, 385
4. Nonuniform Stress, 387
5. Graphical Analysis, 392
6. ML Analysis for Competing Failure Modes, 407
7. ML Theory for Competing Modes, 413 Problems, 417
8. Least-Squares Comparisons for Complete Data, 425
1. Hypothesis Tests and Confidence Intervals, 426
2. Graphical Comparisons, 429
3. Compare Log Standard Deviations, 434
4. Compare (Log) Means, 437
5. Compare Simple Relationships, 441
6. Compare Multivariable Relationships, 445 Problems, 448
9. Maximum Likelihood Comparisons for Censored and Other Data, 451
1. Introduction, 451
2. One-Sample Comparisons, 452
3. Two-Sample Comparisons, 458
4. K-Sample Comparisons, 465
5. Theory for LR and Related Tests, 470 Problems, 488
10. Models and Data Analyses for Step and Varying Stress, 493
1. Survey of Theory for Tests with Varying Stress, 494
2. Step-Stress Model and Data Analyses, 495
3. Varying-Stress Model and Data Analyses, 506 Problems, 513
11. Accelerated Degradation, 521
1. Survey of Applications, 521
2. Degradation Models, 523
3. Arrhenius Analysis, 534 Problems, 544
Appendix A. Statistical Tables, 549
Al. Standard Normal Cumulative Distribution Function O(u), 550
A2. Standard Normal Percentiles zp, 552
A3. Standard Normal Two-Sided Factors Kp,552
A4. t-Distribution Percentiles r(P;v), 553
M. Chi-square Percentiles ~(P;v),554
A6a. F-Distribution 95% Points F(0.93vl,v2), 556
A6b. F-Distribution 99% Points F(O.W,V~,V~), 558
A7. Probability Plotting Positions Fi = 10O(i-OS)/n, 560
References, 561
Index, 579
Introduction and Background
HOW TO USE THIS BOOK
This section describes this book’s contents, organization, and how to use this book. This book presents statistical models, test plans, and data analyses for estimating product reliability from accelerated tests.
Chapter overview. This chapter presents an introduction to accelerated testing methods. Section 1 surveys common applications of accelerated testing and sources of information. Section 2 describes types of accelerated test data. Section3 describes types of acceleration and types of stress loading. Section 4 discusses engineering considerations in planning and running an accelerated test. Section 5 describes common accelerated tests. Section 6 outlines the statistical steps and considerations in data collection and analysis. This chapter is background for the rest of this book. To profit from this chapter, readers need only a general engineering background. Of course, previous acquaintance with accelerated testing helps. Those lacking such acquaintance may benefit from reading Chapters 2 and 3 before Chapter 1.
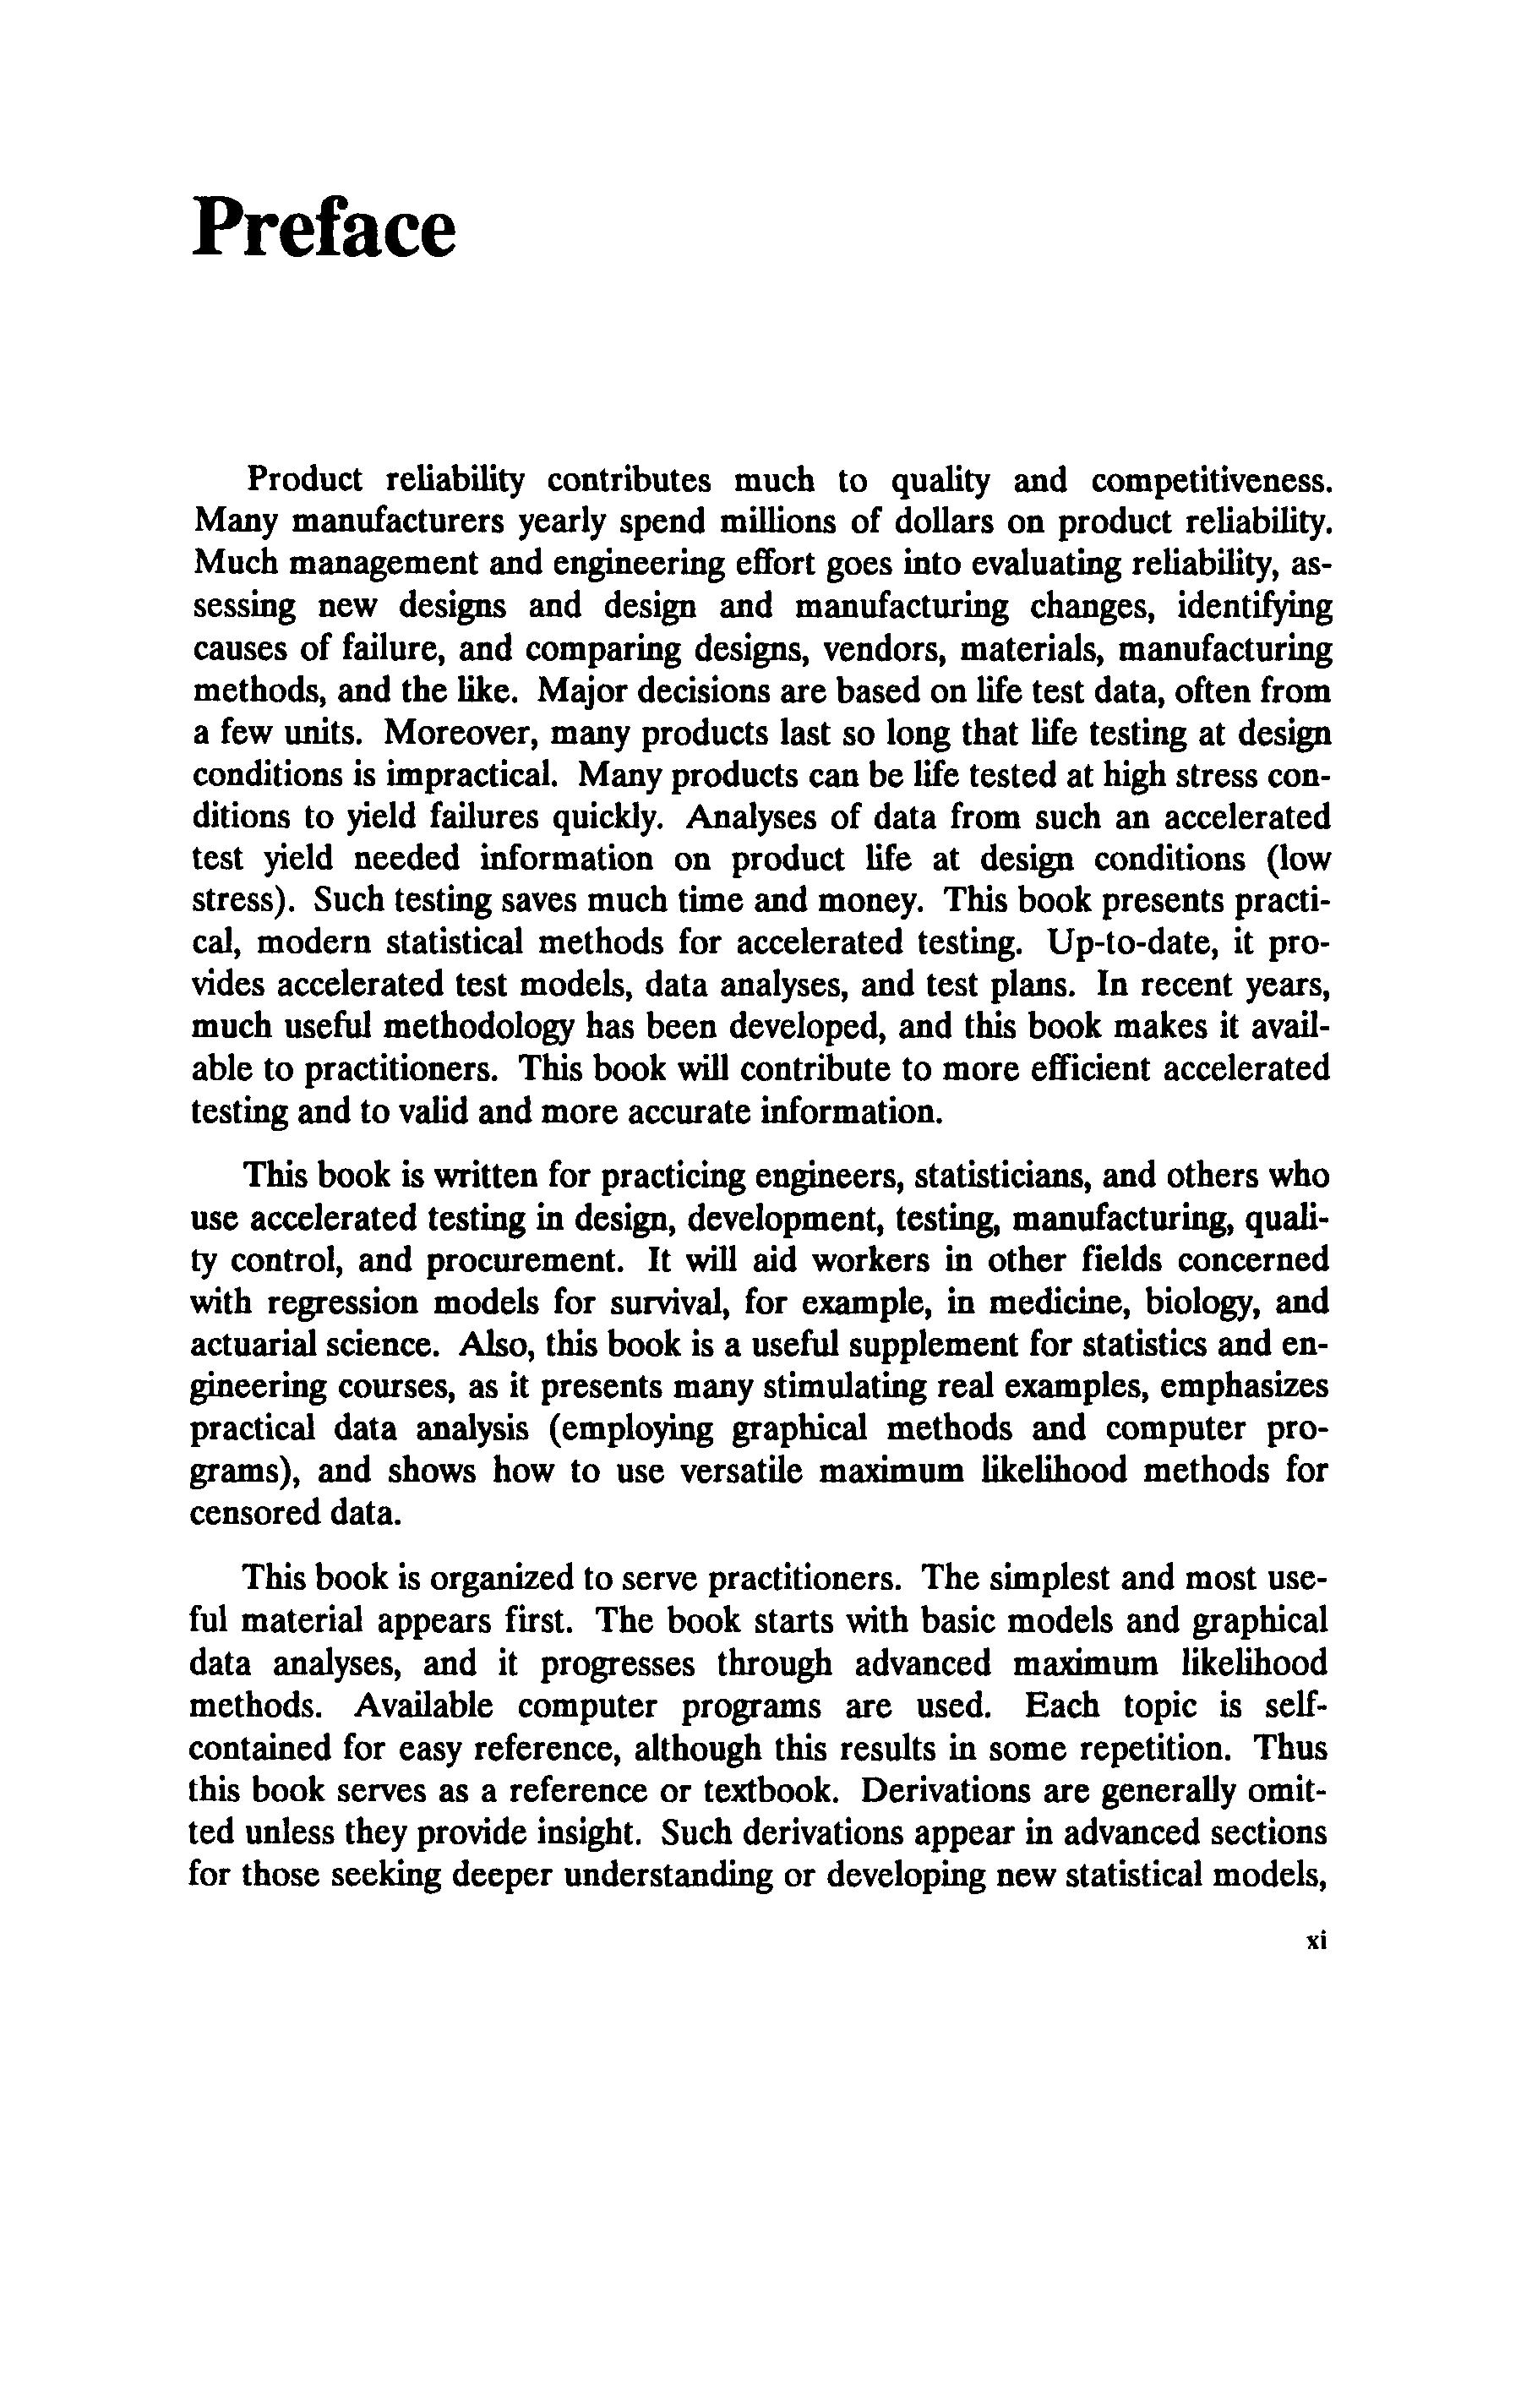
Book overview. Chapter 1 gives an overview of the book and presents needed background. Chapter 2 describes accelerated life test models, consisting of a life distribution and a life-stress relationship. Chapter 3 presents simple probability and relationship plots for analyzing complete and censored data. Briefly stated, when all specimens have run to failure, the data are complete. When some specimens are unfailed at the time of the data analysis, the data are censored. The plots yield estimates for model parameters, product life (distribution percentiles, reliabilities, failure rates), and other quantities. Chapter 4 presents least-squares analyses of complete data; these analyses yield such estimates and corresponding confidence limits. Chapter 5 gives maximum likelihood methods for censored data; these methods yield estimates and confidence limits. Chapter 6 presents test plans. Chapter 7 presents models and graphical and maximum likelihood analyses for data with a mix of failure modes. Chapters 8 and 9 present comparisons (hypothesis tests) for complete and censored data. Chapter 10 treats stepstress testing, cumulative damage models, and data analyses. Chapter 11 1
1. INTRODUCTION AND BACKGROUND
MODELS
3. GRAPHICAL DATA ANALYSIS *
1. COMPLETE DATA fi LS
DATA fi ML METHODS
6. TEST PLANS . COMPETING FAILURE MODES
8. LS COMPARISONS
ACCEL. DEGRADATION
9. FlL COMPARISONS
10. STEP AND VARYING STRESS
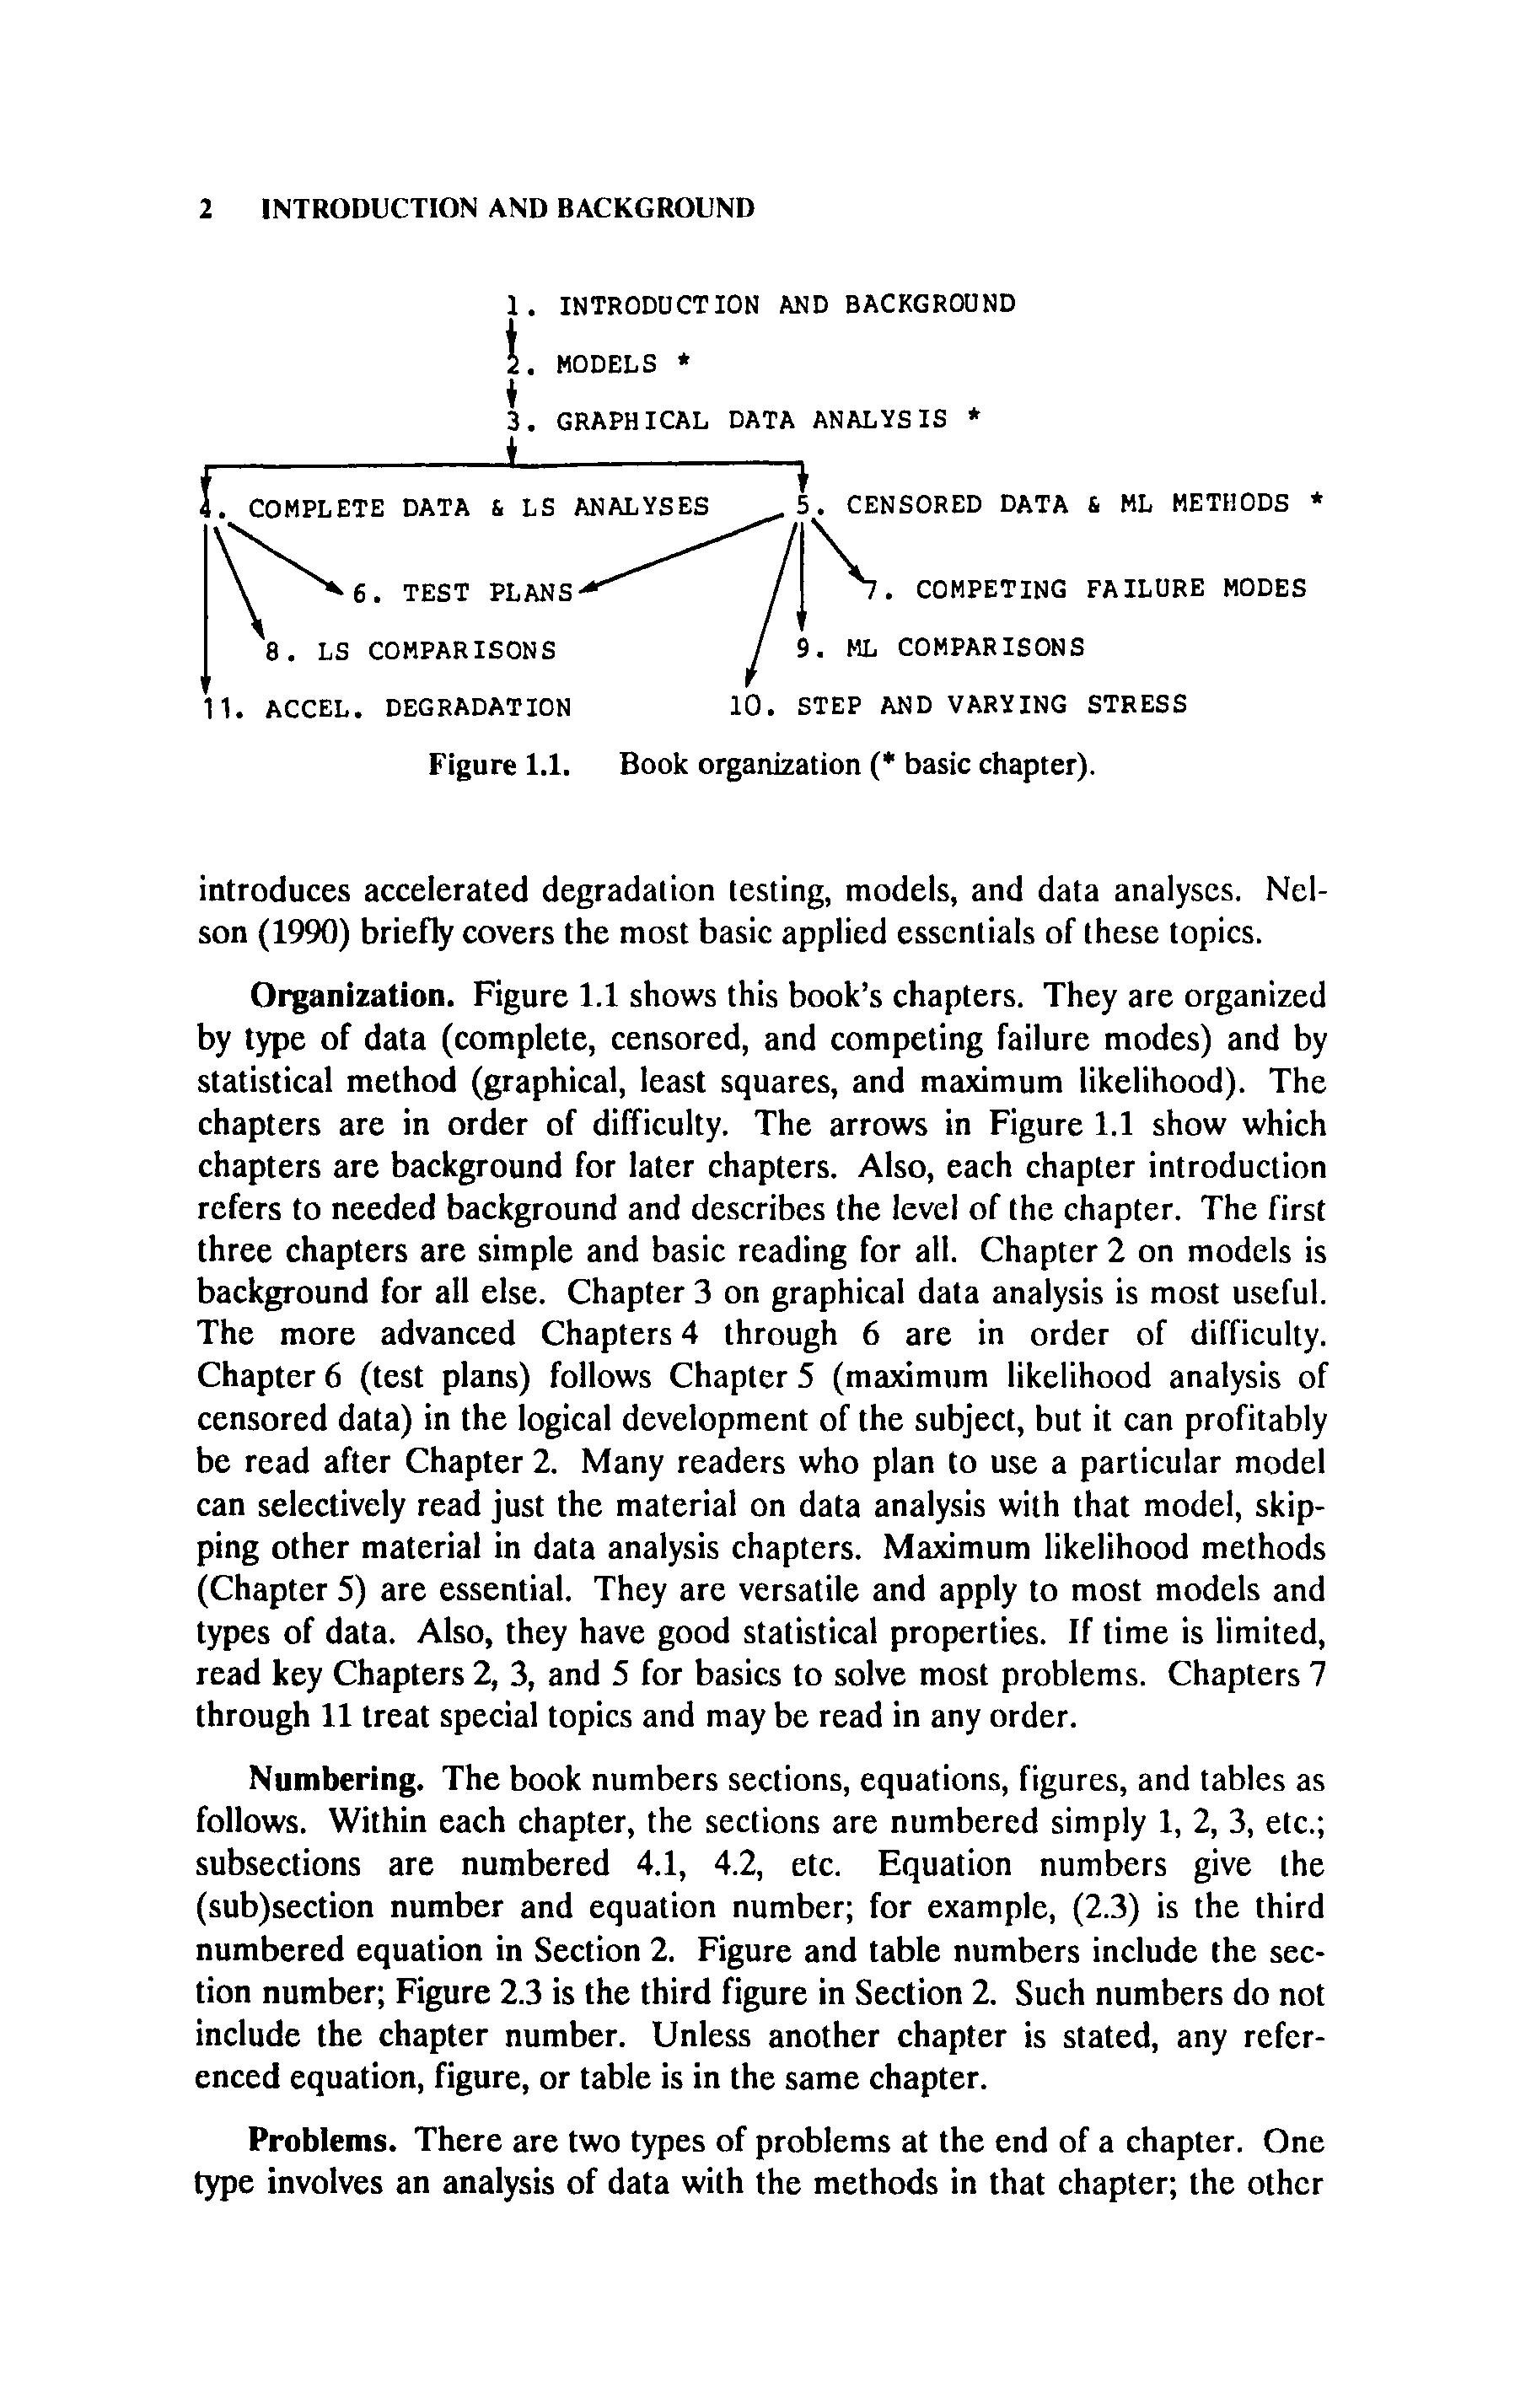
Figure 1.1. Book organization (* basic chapter).
introduces accelerated degradation testing, models, and data analyscs. Nelson (1990) briefly covers the most basic applied esscntials of these topics.
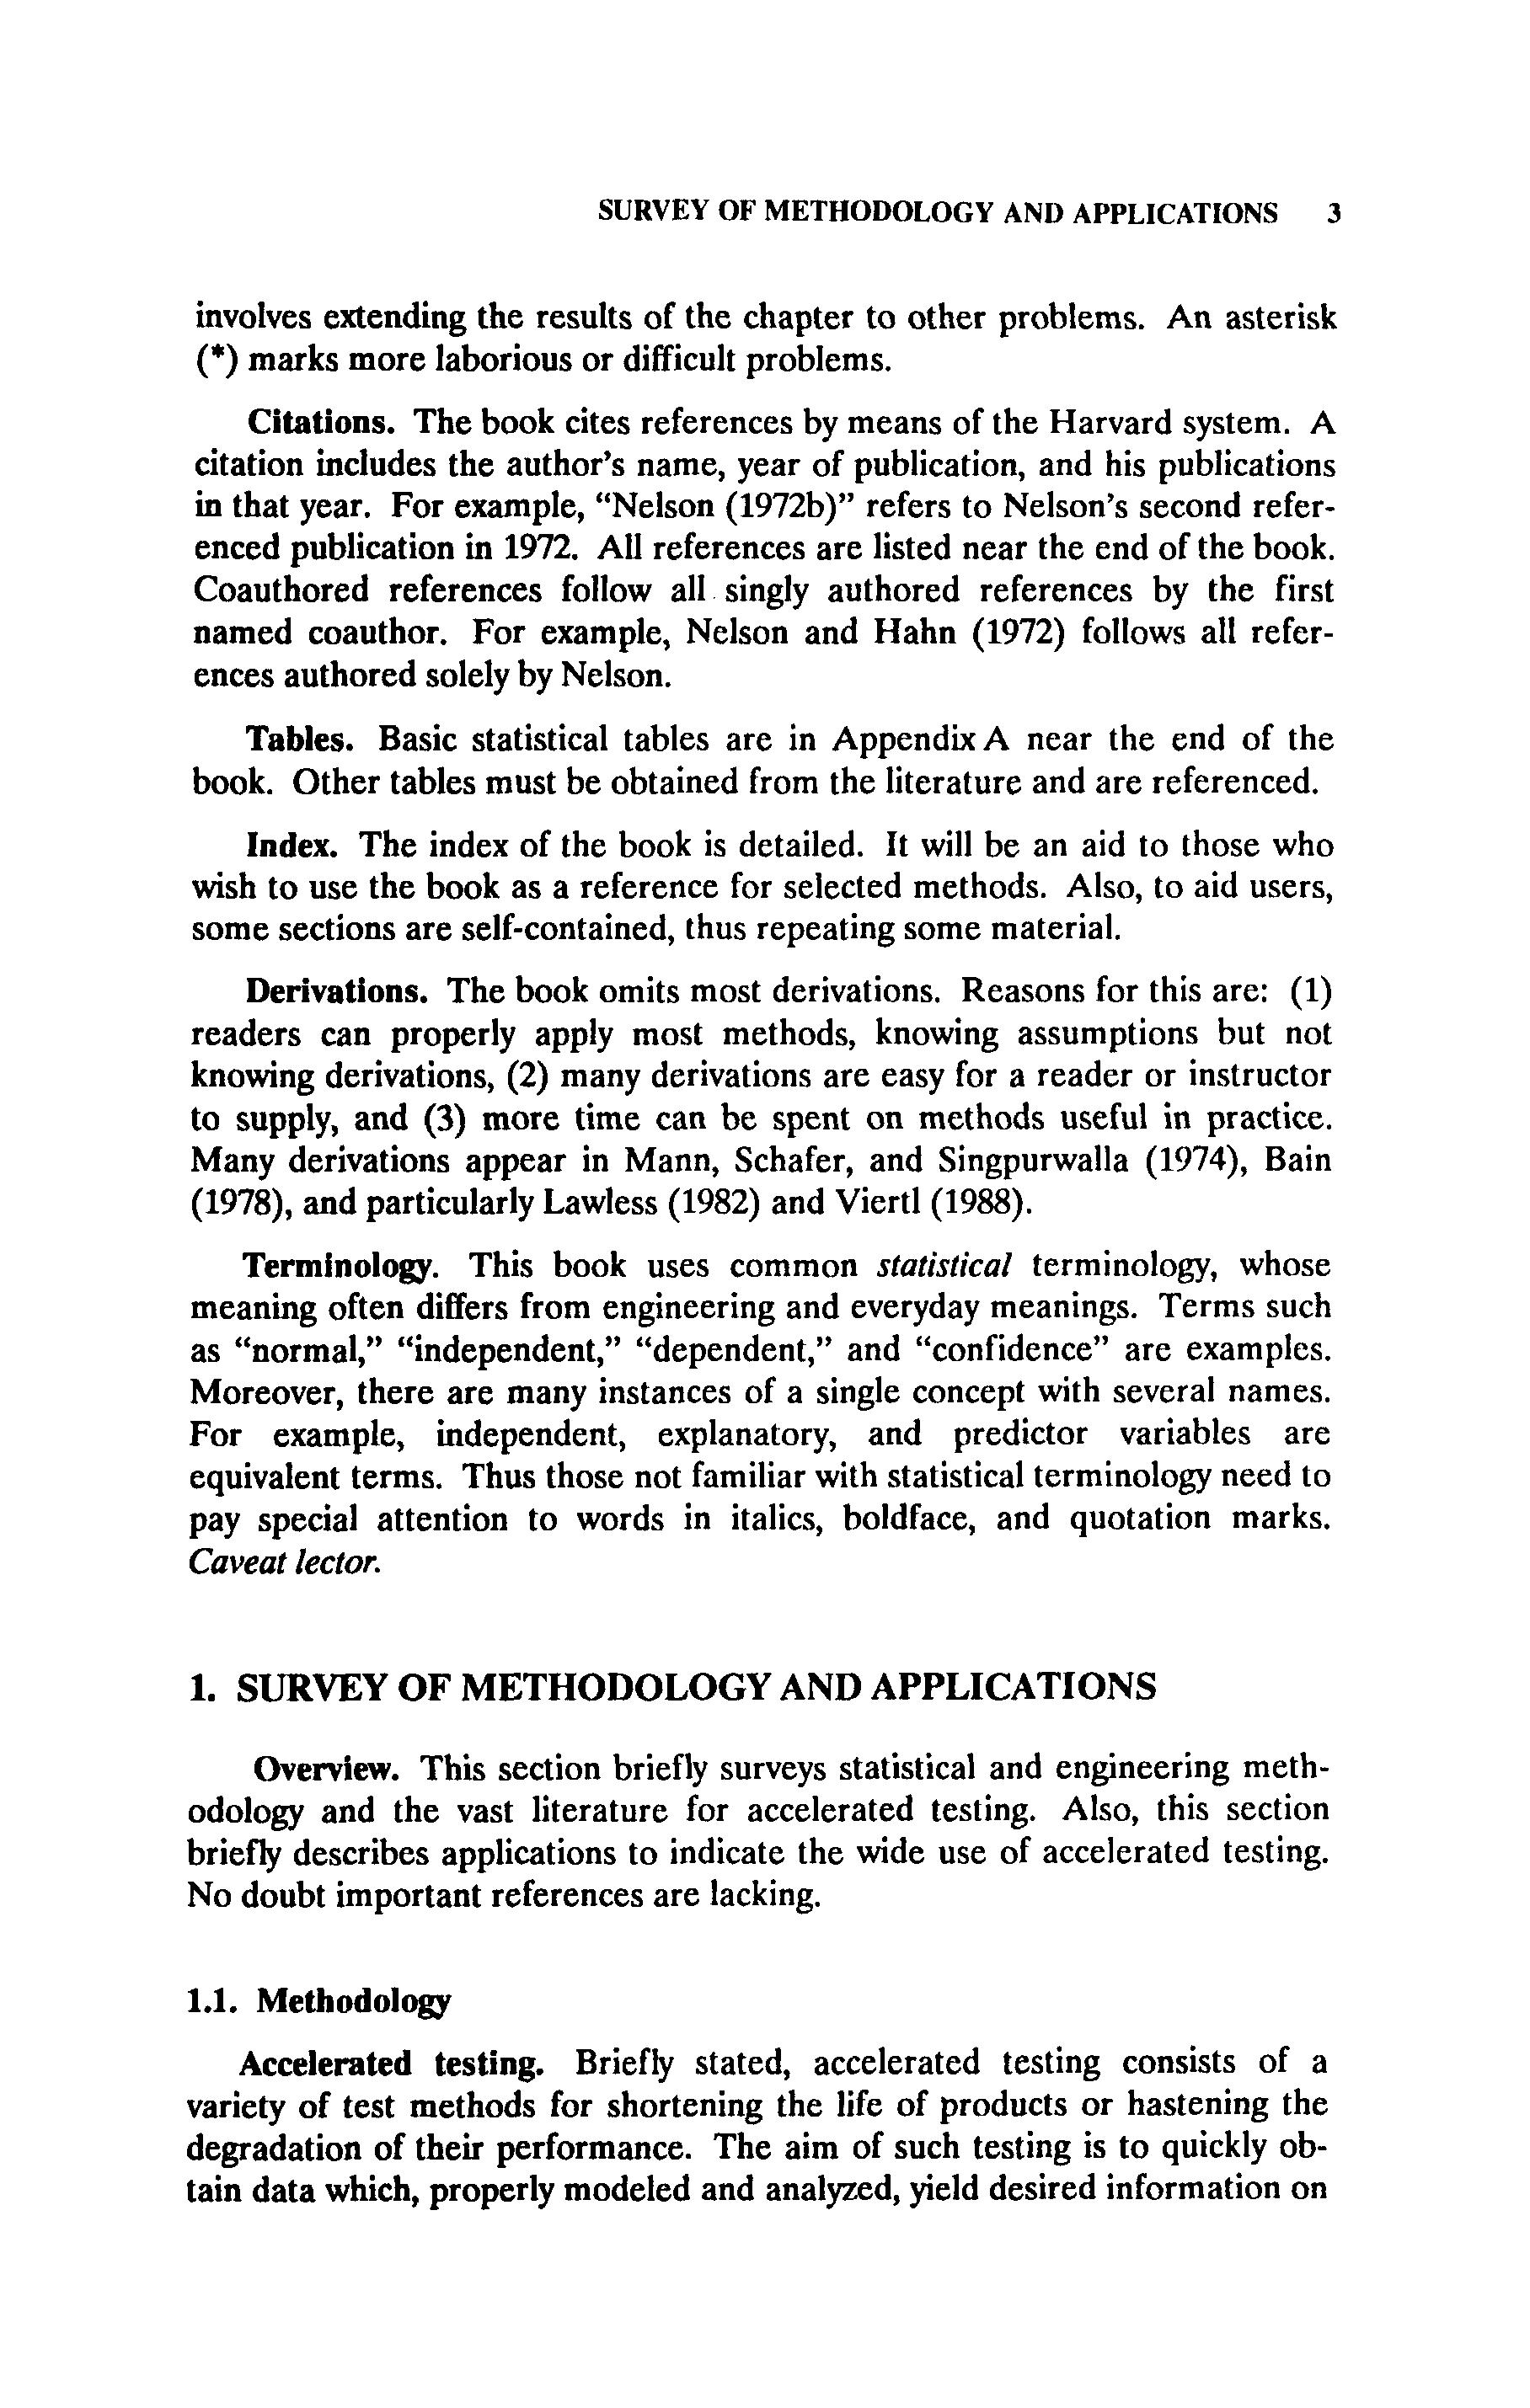
Organization. Figure 1.1 shows this book’s chapters. They are organized by type of data (complete, censored, and competing failure modes) and by statistical method (graphical, least squares, and maximum likelihood). The chapters are in order of difficulty. The arrows in Figure 1.1 show which chapters are background for later chapters. Also, each chapter introduction refers to needed background and describes the level of the chapter. The first three chapters are simple and basic reading for all. Chapter 2 on models is background for all else. Chapter 3 on graphical data analysis is most useful. The more advanced Chapters4 through 6 are in order of difficulty. Chapter 6 (test plans) follows Chapter 5 (maximum likelihood analysis of censored data) in the logical development of the subject, but it can profitably be read after Chapter 2. Many readers who plan to use a particular model can selectively read just the material on data analysis with that model, skipping other material in data analysis chapters. Maximum likelihood methods (Chapter 5) are essential. They are versatile and apply to most models and types of data. Also, they have good statistical properties. If time is limited, read key Chapters 2, 3, and 5 for basics to solve most problems. Chapters 7 through 11treat special topics and may be read in any order.
Numbering. The book numbers sections, equations, figures, and tables as follows. Within each chapter, the sections are numbered simply 1, 2, 3, etc.; subsections are numbered 4.1, 4.2, etc. Equation numbers give the (sub)section number and equation number; for example, (2.3) is the third numbered equation in Section 2. Figure and table numbers include the section number; Figure 2.3 is the third figure in Section 2. Such numbers do not include the chapter number. Unless another chapter is stated, any refcrenced equation, figure, or table is in the same chapter.
Problems. There are two types of problems at the end of a chapter. One type involves an analysis of data with the methods in that chapter; the othcr
involves extending the results of the chapter to other problems. An asterisk (*) marks more laborious or difficult problems.
Citations. The book cites references by means of the Harvard system. A citation includes the author’s name, year of publication, and his publications in that year. For example, “Nelson (1972b)” refers to Nelson’s second referenced publication in 1972. All references are listed near the end of the book. Coauthored references follow all singly authored references by the first named coauthor. For example, Nelson and Hahn (1972) follows all references authored solely by Nelson.
Tables. Basic statistical tables are in AppendixA near the end of the book. Other tables must be obtained from the literature and are referenced.
Index. The index of the book is detailed. It will be an aid to those who wish to use the book as a reference for selected methods. Also, to aid users, some sections are self-contained, thus repeating some material.
Derivations. The book omits most derivations. Reasons for this are: (1) readers can properly apply most methods, knowing assumptions but not knowing derivations, (2) many derivations are easy for a reader or instructor to supply, and (3) more time can be spent on methods useful in practice. Many derivations appear in Mann, Schafer, and Singpurwalla (1974), Bain (1978), and particularly Lawless (1982) and Viertl (1988).
Terminology. This book uses common statistical terminology, whose meaning often differs from engineering and everyday meanings. Terms such as “normal,” “independent,” “dependent,” and “confidence” are examples. Moreover, there are many instances of a single concept with several names. For example, independent, explanatory, and predictor variables are equivalent terms. Thus those not familiar with statistical terminology need to pay special attention to words in italics, boldface, and quotation marks. Caveat lector.
1. SURVEY OF METHODOLOGY AND APPLICATIONS
Overview. This section briefly surveys statistical and engineering methodology and the vast literature for accelerated testing. Also, this section briefly describes applications to indicate the wide use of accelerated testing. No doubt important references are lacking.
1.1. Methodology
Accelerated testing. Briefly stated, accelerated testing consists of a variety of test methods for shortening the life of products or hastening the degradation of their performance. The aim of such testing is to quickly obtain data which, properly modeled and analyzed, yield desired information on
INTRODUCTION AND BACKGROUND
product life or performance under normal use. Such testing saves much time and money. The aim of this book is to provide practitioners with basic, practical statistical models, test plans, and data analyses for accelerated tests.
Statistical methodology. In recent years statisticians have developed much statistical methodology for accelerated testing applications. Indeed they solved most of the statistical problems listed by Yurkowski, Schafer, and Finkelstein (1967). For example, statisticians solved the big bugaboo of accelerated testing, namely, proper analysis of data with a mix of failure modes (Chapter 7). Recent books with chapters on statistical methodology for accelerated tests include Lawless (1982), Mann, Schafer, and Singpurwalla (1974), Jensen and Petersen (1982), Lipson and Sheth (1973), Tobias and Trindade (1986), Kalbfleisch and Prentice (1980), Cox and Oakes (1984), and Little and Jebe (1975). Viertl (1988) surveys statistical theory for accelerated testing. Nelson (1990) briefly presents the most basic essentials of applied statistical methods and models for accelerated testing. The present book provides applied statistical models and methods for accelerated testing. Statistical methodology is improving rapidly. Thus books over 5 years old lack important developments, and books over 10 years old are seriously out of date. This book is no exception.
Surveys of the statistical literature on accelerated testing include Viertl (1988), Nelson (1974), Ahmad and Sheikh (1983), Meeker’s (1980) bibliography, Singpurwalla (1975), and Yurkowski, Schafer, and Finkelstein (1967). Peck and Trapp (1978) present simple graphical methods for semiconductor data. Peck and Zierdt (1974) survey semiconductor applications.
Journals. Journals with articles on accelerated testing may be found in the References at the back of this book. Journals with statistical methodology for accelerated testing include:
a American SOC.for Quality Control Annual Quality Congress Transactioits Annals of Reliability and Maintainability
a Applied Statistics
a IEEE Transactions on Reliability
a J. of Quality Technology
J. ofthe American Statistical Assoc.
J. ofthe Operations Research Soc. of America
a J. of Statistical Planning and Inference
a Naval Research Logistics Quarterly
a Proceedings of the Annual Reliability and Maintainability Symposium
a The Q R Journal - Theory and Practice, Methods and Management
a Quality and Reliability Engineering International
a Reliability Review of the American SOC.for Quality Control
a Technometrics
Engineering methodology. Engineers have long used accelerated testing for diverse products. Governments and professional societies publish lists of standards and handbooks for testing methodology and data analysis. The en-
gineering literature contains many papers on accelerated testing theory and applications. The bibliographies on accelerated testing of Meeker (1980) and Yurkowski and others (1%7) with 524 older references show the scope of this literature. Also, various engineering books devote some space to this topic. A sample of references appears in the applications below.
Data banks/handbooks. This book covers statistical methods for collection and analysis of accelerated test data. It lacks data banks and handbooks for specific materials and products. The following brief list of sources may serve as a starting point in a search for such data. The US Department of Defense (DoD) (1981,1985) maintains Information Analysis Centers (LACS):
Concrete Technology IAC, (601) 634-3269.
DoD Nuclear IAC, (805) 963-6400.
Infrared IAC, (313) 994-1200 ext. 214.
Metals and Ceramics ICY(614) 424-5000. See the publication list of Metals
and Ceramics IAC (1984)
Metal Matrix Composites IAC, (805) 963-6452.
Plastics Technical Evaluation Center, (201) 724-3189.
Pavement and Soils Trafficability IAC, (601) 634-2209.
Reliability AC, (315) 330-4151.
Thermophysical and Electronic Properties LAC, (317) 494-6300. Other sources of information include:
Standards in many fields, American National Standards Inst. Catalog,
1430 Broadway, New York, NY 10018.
National Nuclear Data Center, (516) 282-2103.
Computerized references and data bases, STN International (Chemical
Abstracts Service), PO Box 3012, Colombus, OH 43210-9989.
Index to IEEE Publications (1988), (201)981-1393. Also, Quick Reference
lo IEEE Standards.
Ulrich's International Periodicals Directory, R.R. Bowker Co., New York. Science Citation Index for locating more recent papers citing known papers on a topic.
GIDEP, Government-Industry Data Exchange Program, for failure rates of electronic and mechanical components, (714)736-4677.
CINDAS - Center for Information and Numerical Data Analysis and Synthesis, Purdue Univ., Dr. c. Y.Ho, (317)494-6300. Maintains data bases on dielectrics and other materials.
Omissions. This book omits various engineering aspects of accelerated testing. Omissions include:
Failure unuZysis. Sources of information include the International Symposium for Testing and Failure Analysis, the Symposium on Mechanical Properties, Performance, and Failure Modes of Coatings (NBS/NIST), the Failure Analysis Special Interest Group of the Society of Plastics Engineers, and Chapter 13 of Ireson and Coombs (1988).
Test equipment and labs. Sources of information include Quality Progress
(1988), Evaluation Engirreerirtg magazine (813) 966-9521, the Amer. Assoc. for Laboratory Accreditation, P.O. Box 200, Farifax Station, VA 22039, and various standards of professional societies.
Measurements/metroIogy and test methods. Standards of engineering societies treat this in detail. Meetings include the Instrumentation and Measurement Technology Conference (IEEE). References include Heymen (1988).
Applications. For convenience, the following applications appear under three headings: (1) Materials, (2) Products, and (3) Degradation Mechanisms. These brief discussions are intended only to suggest the widespread use of accelerated testing. Those acquainted with a particular application will find the discussion rudimentary. Each discussion briefly describes applications, typical products, accelerating stresses, professional societies, journals, and meetings. Some references are included. Applications appear in the accelerated testing bibliographies of Meeker (1980) and Carey (1988), and older applications appear in the survey of Yurkowski and others (1967). Most applications involve time - either as time to failure or as time over which a performance property of a product degrades.
1.2. Materials
The following paragraphs briefly survey accelerated testing of materials. These include metals, plastics, dielectrics and insulations, ceramics, adhesives, rubber and elastics, food and drugs, lubricants, protective coatings and paints, concrete and cement, building materials, and nuclear reactor materials.
Metals. Accelerated testing is used with metals, including test coupons and actual parts, as well as composites, welds, brazements, bonds, and other joints. Performance includes fatigue life, creep, creep-rupture, crack initiation and propagation, wear, corrosion, oxidation, and rusting. Accelerating stresses include mechanical stress, temperature, specimen geometry and surface finish. Chemical acceleration factors include humidity, salt, corrosives, and acids. Societies include the American Society for Testing and Materials (ASTM), the American Society for Mechanical Engineers (ASME), American Powder Metallurgy Institute, ASM International (formerly the American Society for Metals), Institute of Metals, Society of Automotive Engineers (SAE), and the Society for Experimental Mechanics (SEM). References include ASTM STP 91-A, 744, and E739-80, Little and Jebe (1975), Graham (1968), Dieter (l%l), Shelton (1982), Metals and Ceramics Information Center (1984), SAE Handbook AE-4 (1968), and Carter (1985).
Plastics. Accelerated testing is used with many plastics including building materials, insulation (electrical and thermal), mechanical components, and coatings. Materials include polymers, polyvinyl chloride (PVC), urethane foams, and polyesters, Performance includes fatigue life, wear, mechanical
properties, and color fastness. Accelerating stresses include mechanical load (including vibration and shock), temperature (including cycling and shock), and weathering (ultraviolet radiation and humidity). Societies include the Plastics Institute of America, Plastics and Rubber Institute (PRI), and Society of Plastics Engineers (particularly its Failure Analysis Special Interest Group). Meetings include the International Conference on Fatigue in Polymers. Publications include Polymer Engineering and Science and J. of Applied Polymer Science. References include Mark (1985), Brostow and Corneliussen (1986), Hawkins (1984,1971), Underwriter Labs (1975), and Clark and Slater (1%9).
Dielectrics and insulations. Accelerated testing is used with many dielectrics and electrical insulations including solids (polyethylene, epoxy), liquids (transformer oil), gases, and composites (oil-paper, epoxy-mica). Products include capacitors, cables, transformers, motors, generators, and other electrical apparatus. Performance includes time to failure and other properties (breakdown voltage, elongation, ultimate mechanical strength). Accelerating stresses include temperature, voltage stress, thermal and electrical cycling and shock, vibration, mechanical stress, radiation, and moisture. Societies include the Institute of Electrical and Electronics Engineers (IEEE), American Society for Testing and Materials (ASTM), and International Electrotechnical Commission (IEC). Publications include the IEEE Traits. on Electrical Insulation and IEEE EIectrical btsirlation Magazine. Meetings include the IEEE Annual Conference on Electrical Insulation and Dielectric Phenomena, IEEE Biannual International Symposium on Electrical Insulation, and Electrical/Electronics Insulation Conference. References include Sillars (1973), IEEE Standard 101 (1986), IEEE Standard 930 (1987), Goba (1969), IEEE Index (1988), Vincent (1987), Simoni (1974,1983), Vlkova and Rychtera (1978), and Bartnikas (1987, Chap. 5).
Ceramics. Applications are concerned with fatigue life, wear, and degradation of mechanical and electrical properties. References include Metals and Ceramics Information Center (1984). Societies include the United States Advanced Ceramics Association and American Ceramics Society. Publications include the I. of the American Ceramics SOC. Meetings include the World Materials Congress (ASM) and CERAMTEC Conference and Exposition (ASM/ESD). See Frieman (1980) and references for Metals.
Adhesives. Accelerated testing is used with adhesive and bonding materials such as epoxies. Performance includes life and strength. Accelerating stresses include mechanical stress, cycling rate, mode of loading, humidity, and temperature. References include Beckwith (1979,1980), Ballado-Perez (1986,1987), Millet (1975), Gillespie (1%5), and Rivers and others (1981).
Rubber and elastics. Accelerated testing is used with rubbers and elastic materials (e.g., polymers). Products include tires and industrial belts. Performance includes fatigue life and wear. Accelerating stresses include
mechanical load, temperature, pavement texture, and weathering (solar radiation, humidity, and ozone). Societies include the Plastics and Rubber Institute (PRI). References include Winspear’s (1968) Vanderbilt Rubber Handbook and Morton (1987).
Foods and drugs. Accelerated testing is used with foods (e.g., browning of white wines), drugs, pharmaceuticals, and many other chemicals. Performance is usually shelf (or storage) life, usually in terms of amount of an active ingredient that degrades. Performance variables include taste, pH, moisture loss or gain, microbial growth, color, and specific chemical reactions. Accelerating variables include temperature, humidity, chemicals, pH, oxygen, and solar radiation. Societies include the American Society of Test Methods, US Pharmacopoeia, and Pharmaceutical Manufacturers Association. Major meetings include the Annual Meeting of Interplex. Kulshreshtha (1976) gives 462 references on storage of pharmaceuticals. References include Carstensen (1972), Connors et al. (1979), Bentley (1970), US FDA Center for Drugs and Biologics (1987), Young (1988), Labuza (1982), Beal and Sheiner (1985), and Grimm (1987).
Lubricants. Accelerated testing is used with solid (graphite, molybdenum disulphide, and teflon), oil, grease, and other lubricants. Performance includes oxidation, evaporation, and contamination. Accelerating stresses include speed, temperature, and contaminants (water, copper, steel, and dirt). Societies include the Society of Tribologists and Lubrication Engineers, STLE (formerly the American Society of Lubrication Engineers, ASLE). National Lubricating Grease Institute (NLGI), American Society for Testing and Materials (ASTM), and Society for Automotive Engineers (SAE). Elsevier Sequoia, SA. (Switzerland) publishes WEAR, an international journal on the science and technology of friction, lubrication, and wear.
Protective coatings and paints. Accelerated testing is used for weathering of paints (liquid and powder), polymers, antioxidants, anodized aluminum, and electroplating. Performance includes color, gloss, and physical integrity (e.g., wear, cracking, and blistering). Accelerating stresses include weathering variables - temperature, humidity, solar radiation (wavelength and intensity) - and mechanical load. Societies include the American Electroplaters and Surface Finishers Society. Meetings include the World Materials Congress (ASM), and the Symposium on Mechanical Properties, Performance, and Failure Modes of Coatings (NBS/NIST).
Concrete and cement. Accelerated testing is used with concrete and cement to predict performance - the strength after 28 days of curing. The accelerating stress is high temperature applied for a few hours. Meetings include the Cement Industry Technical Conference.
Building materials. Accelerated testing is used with wood, particle board, plastics, composites, glass, and other building materials. Performance includes abrasion resistance, color fastness, strength, and other mechanical
properties. Accelerating stresses include load and weathering (solar radiation, temperature, humidity). References include Clark and Slater (1969).
Nuclear reactor materials. Accelerated testing is used with nuclear reactor materials, for example, fuel rod cladding. Performance includes strength, creep, and creep-rupture. Accelerating stresses include temperature, mechanical stress, contaminants, and nuclear radiation (type, energy, and flux). Societies include the Institute of Environmental Sciences (1988) and American Nuclear Society. Journals include the IEEE Trans. 011Nuclear Science and Radiation Research. DePaul(l957) surveys such work.
13. Products
The following paragraphs describe accelerated testing of certain products. Such products range from simple components through complex assemblies.
Semiconductors and microelectronics. Accelerated testing is used for many types of semiconductor devices including transistors such as gallium arsenide field emission transistors (GaAs FETs), insulated gate field emission transistors (IGFETs), Gunn and light emitting diodes (LEDs), MOS and CMOS devices, random access memories (RAMS), and their bonds, connections, and plastic encapsulants. They are tested singly and in assemblies such as circuit boards, integrated circuits (LSI and VLSI), and microcircuits. Performance is life and certain operating characteristics. Accelerating variables include temperature (constant, cycled, and shock), current, voltage (bias), power, vibration and mechanical shock, humidity, pressure, and nuclear radiation. Societies include the Institute for Electrical and Electronics Engineers (IEEE), American Electronics Association (AEA), Society for the Advancement of Material and Process Engineering (PO Box 2459, Covina, CA 91722). Major professional meetings include the International Reliability Physics Symposium, Annual Reliability and Maintainability (RAM) Symposium, International Symposium for Testing and Failure Analysis, Electronic Materials and Processing Congress (ASM), Annual Conference on Electronic Packaging and Corrosion in Microelectronics, and Gallium Arsinide Integrated Circuits Symposium (IEEE). References include Peck and Trapp (1978), Peck and Zierdt (1974), Reynolds (1977), IEEE Index (1988), and Howes and Morgan (1981). Publications include proceedings of the symposia above, Microelectronics and Reliability, IEEE Trans. 018Reliability, IEEE Journal of Solid-state Circuits, IEEE Trans. on Consumer Electronics, IEEE Circuits and Devices Magazine, IEEE Trans. on Circirits and Systems, IEEE Trans. on Electron Devices, IEEE Trans. on Power Electronics, Proceedings of the International SAMPE Electronics Materials Conference, IEEE J. of Qirantun1 Electmnics, and IEE Proceedings (England).
Capacitors. Accelerated testing is used with most types of capacitors, including electrolytic, polypropylene, thin film, and tantalum capacitors. Performance is usually life. Accelerating variables include temperature, voltage,
INTRODUCTION AND BACKGROUND
and vibration. Professional societies that publish standards and journal articles on accelerated test methods and applications include the Institute of Electrical and Electronics Engineers (IEEE) and the American Electronics Association (AEA). Also, see resources for semiconductor applications.
Resistors. Accelerated testing is used with thin and thick film, metal oxide, pyrolytic, and carbon film resistors. Performance is life. Accelerating variables include temperature, current, voltage, power, vibration, electrochemical attack (humidity), and nuclear radiation. References include Krause (1974). Also, see resources for semiconductor applications.
Other electronics. Accelerated testing is used with other electronic components such as optoelectronics (opto couplers and photo conductive cells), lasers, liquid crystal displays, and electric bonds and connections. The performance, accelerating stresses, professional societies, and references are much the same as those for semiconductors. Publications include IEE Proceedings (England), IEEE Trans. on Power Electronics, IEEE Journal of Electronic Materials, and IEEE Trans. on Electron Devices. Meetings include the Electronic Components Conference (IEEE) and International Electron Devices Meeting (IEEE).
Electrical contacts. Accelerated testing is used for electrical contacts in switches, circuit breakers, and relays. Performance includes corrosion and life. Metal fatigue, rupture, and welding are common failure mechanisms. Accelerating stresses include high cycling rate, temperature, contaminants (humidity), and current. References include the IEEE Index (1988). Meetings include the Holm Conference on Electrical Contacts (IEEE).
Cells and batteries. Accelerated testing is used with rechargable, nonrechargable, and solar cells. Performance includes life, self discharge, current, and depth of discharge. Accelerating variables include temperature, current density, and rate of charge and discharge. Societies include the Electrochemical Society (609) 737-1902. Publications include the Journal of the Electrochemical Society, Solar Cells (Switzerland), and Proceedings of the Symposium on Lithium Batteries. References include Sidik and others (1980), McCallum and others (1973), Linden (1984), and Gobano (1983). Meetings include the Battery Workshop (NASA), Annual Battery Conference on Applications and Advances (IEEE and California State University), and International Power Sources Symposium.
Lamps. Accelerated testing is used with incandescent (filament), fluorescent (including ballasts), mercury vapor, and flash lamps. Performance includes life, efficiency, and light output. Accelerating variables include voltage, temperature, vibration, and mechanical and electrical shock. Societies include the International Electrotechnical Commission (IEC). References include EG&G Electro-Optics (1984), IEC Publ. 64 (1973), and IEC Publ. 82 (1980).
Electrical devices. Accelerated testing is used with various electrical devices including motors, heating elements, and thermoelectric converters. References include the IEEE Index (1988). Motor and generator failures are almost always due to insulation or bearing failure. Thus their life distribution is inferred from that of their insulation and bearings (Chapter 7).
Bearings. Accelerated testing is used with roller, ball, and sliding (oil film) bearings. Performance includes life and wear (weight loss). Materials include steels and silicon nitride for rolling bearings and porous (sintered) metals, bronzes, babbitt, aluminum alloys, and plastics for sliding bearings. Accelerating stresses include overspeed, mechanical load, and contaminants. Societies include the Anti-Friction Bearing Manufacturers Association (AFBMA), International Standards Organization (ISO), American Society for Testing and Materials (ASTM), Society of Automotive Engineers (SAE), and ASM International (formerly the American Society for Metals). References include Harris (1984), SKF (1981), and Lieblein and Zelen (1956).
Mechanical components. Accelerated testing is used with mechanical components and assemblies such as automobile parts, hydraulic components, tools, and gears. Performance includes life and wear. Accelerating stresses include mechanical load, vibration, temperature and other environmental factors, and combinations of such stresses. Societies include the American Society for Testing and Materials (ASTM), Society for Automotive Engineers (SAE), and American Society for Mechanical Engineers (ASME). Meetings include the International Machinery Monitoring and Diagnostic Conference (sponsored by Union College, Schenectady, NY). References include Collins (1981), Zalud (1971), and Boothroyd (1975). See resources for Metals.
1.4. Degradation Mechanisms
The following paragraphs describe common mechanisms for degradation of product pegomance. Such mechanisms are utilized or studied in accelerated tests. For more detail, refer back to discussions of materials and products. Meetings include the International Machinery Monitoring and Diagnostic Conference (sponsored by Union College, Schenectady, NY).
Fatigue. Materials eventually fail by fatigue if subjected to repeated mechanical loading and unloading, including vibration. Well studied are the fatigue of metals, plastics, glass, ceramics, and other structural and mechanical materials (see references on these). Fatigue is a major failure mechanism of mechanical parts including bearings and electrical contacts. The usual accelerating stress is load. Other stresses are temperature and chemicals (water, hydrogen, oxygen, etc.). References include Tustin and Mercado (1984), ASTM STP648 (1978), ASTM STP 744 (1981), ASTM STP748 (1981), ASTM STP 738 (1981), Frieman (1980), and Skelton (1982).
INTRODUCTION AND BACKGROUND
Creep. Creep, the slow plastic deformation of materials under constant mechanical load, may interfere with product function or cause rupture or fracture. Accelerating variables are typically temperature and mechanical load, load cycling, and chemical contaminants (for example, water, hydrogen, and fluorine). References include Goldhoff and Hahn (1968), Hahn (1979), and Skelton (1982). See resources for Metals and Plastics.
Cracking. Metals, plastics, glass, ceramics, and other materials crack. People study crack initiation and growth. Accelerating stresses include mechanical stress, temperature, and chemicals (humidity, hydrogen, alkalis, and acids). See resources for Metals and Plastics.
Wear. In applications, many materials are subjected to friction that removes the material. For example, rubber tires lose tread, house paints wash off, gears, bearings, and machine tools wear away. Accelerating stresses include speed, load (magnitude and type), temperature, lubrication, and chemicals (humidity). References include Rabinowicz (1988) and Peterson and Winer (1980). DePaul (1957) surveys nuclear applications. Boothroyd (1975) treats machine tool wear. Elsevier Sequoia, SA. (Switzerland) publishes FEAR, an international journal on the science and technology of friction, lubrication, and wear.
Corrosion/oxidation. Most metals and many foods, pharmaceuticals, etc., deteriorate by chemically reacting with oxygen (oxidation and rusting), fluorine, chlorine, sulphur, acids, alkalis, salt, hydrogen peroxide, and water. Accelerating stresses include concentration of the chemical, activators, temperature, voltage, and mechanical load (stress-corrosion). Meetings include the Annual Conference on Electronic Packaging and Corrosion in Microelectronics. Professional societies include the National Assoc. of Corrosion Engineers (NACE). The publications list of the Metals and Ceramics Information Center (1984) includes work on corrosion. References include DePaul (1957) on nuclear applications, Rychtera (1985), and Uhlig and Revie (1985).
Weathering. This concerns the effects of weather on materials in outdoor applications. Such materials include metals, protective coatings (paint, electroplating, and anodizing), plastics, and rubbers. Accelerating stresses include solar radiation (wavelength and intensity) and chemicals (humidity, salt, sulphur, and ozone). The degradation generally involves corrosion, oxidation (rust), tarnishing, or other chemical reaction. Professional societies include Institute of Environmental Sciences (1988). Publications include the Journal of Environntental Sciences.
2. TYPESOFDATA
This section presents background on accelerated test data. Accelerated test data can be divided into two types. Namely, the product characteristic of interest is 1) life or is 2) some other measure of performance, such as tensile
strength or ductility. Such data are described below. This background is essential for the rest of this book.
Performance data. One may be interested in how product performance degrades with age. In such performance testing, specimens are aged under high stress, and their performance measured at different ages. Such performance data are analyzed by fitting a degradation model to the data to estimate the relationship between performance, age, and stress. Chapter 11 discusses such data in detail and presents such models and data analyses. Such a degradation test has been used, for example, for temperature aging of electrical insulation and pharmaceuticals. Goba (1969) references such testing of electrical insulation.
Life data. The proper analysis of life data depends on the type of data. The following paragraphs describe the common types of life data from a single test or design condition.
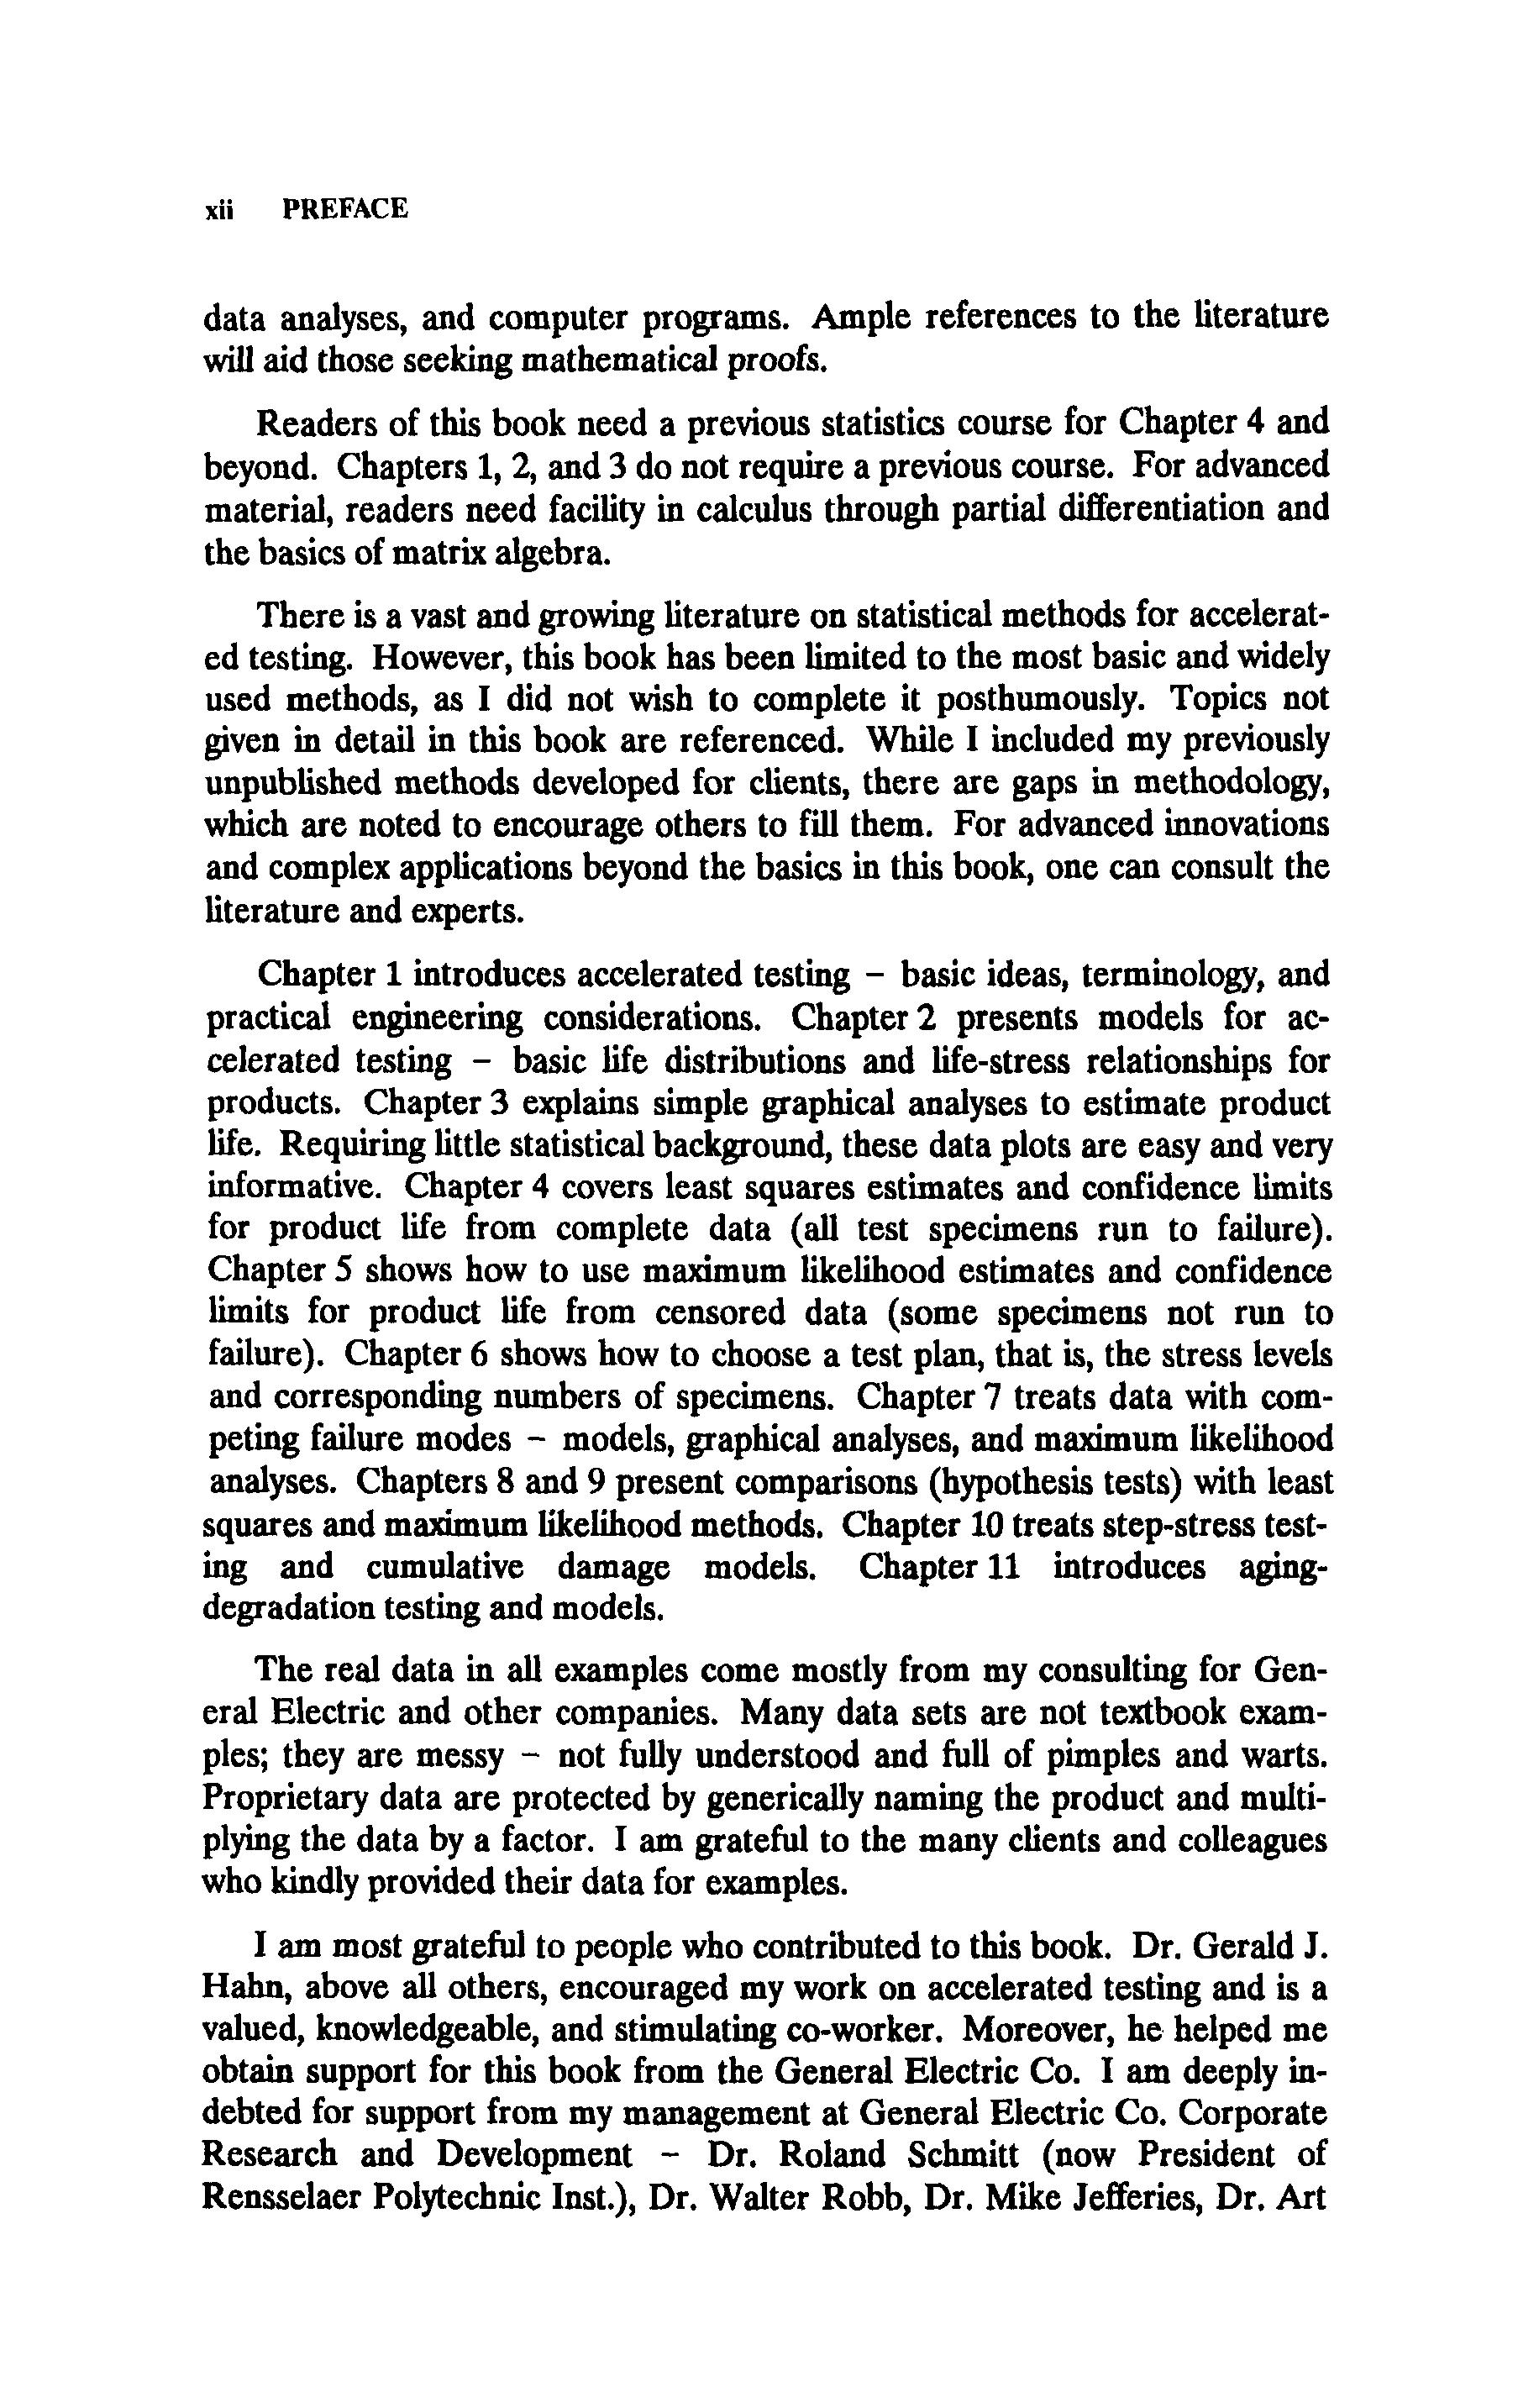
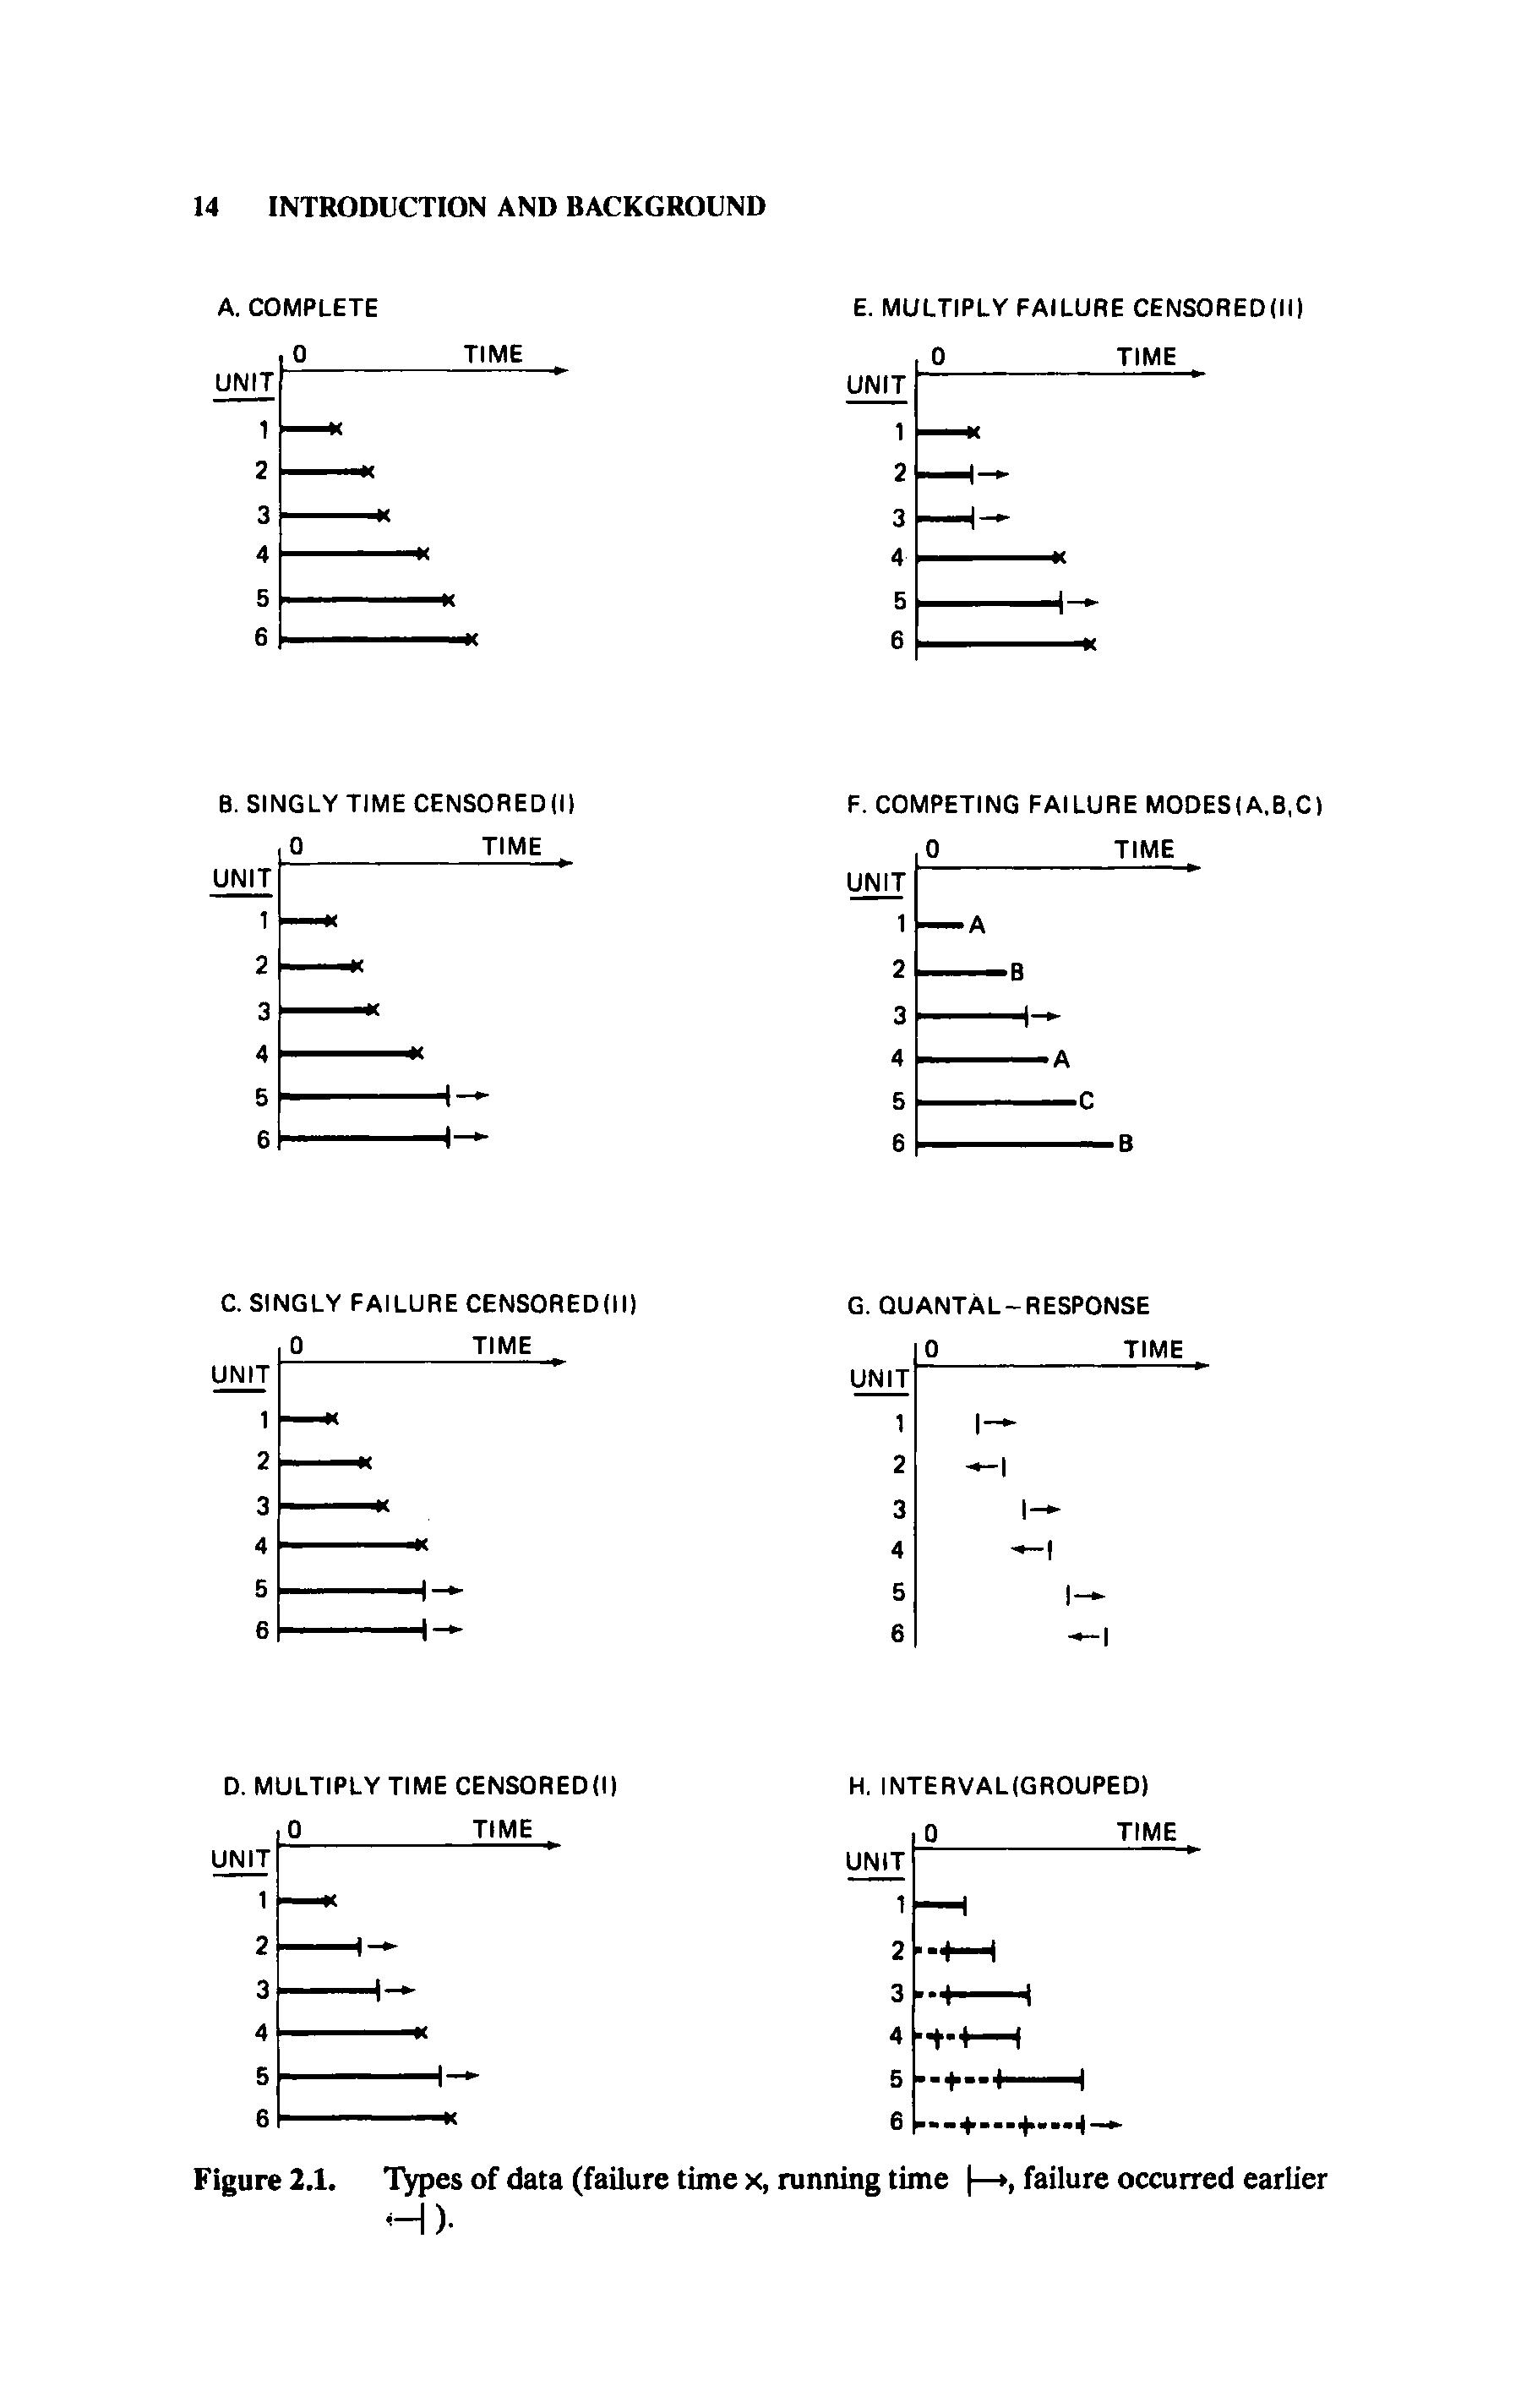
Complete. Complete data consist of the exacf life (failure age) of each sample unit. Figure 2.lA depicts a complete sample from a single test condition. There the length of a line corresponds to the lcngth of life of a test unit. Chapters 3, 4, and 8 treat such data. Much life data are incomplete. That is, the exact failure times of some units are unknown, and there is only partial information on their failure times. Examples follow.
Censored. Often when life data are analyzed, some units are unfailed, and their failure times are known only to be beyond their present running times. Such data are said to be censored on the right. In older literature, such data or tests are called truncated. Unfailed units are called run-outs, survivors, removals, and suspensions. Such censored data arise when some units are (1) removed from test or service before they fail, (2) still running at the time of the data analysis, or (3) removed from test or service because they failed from an extraneous cause such as test equipment failure. Similarly, a failure time known only to be before a certain time is said to be censored on the left. If all unfailed units have a common running time and all failure times are earlier, the data are said to be singly censored on the right. Singly censored data arise when units are started together at a test condition and the data are analyzed before all units fail. Such data are singly time censored if the censoring time is fixed; then the number of failures in that fixed time is random. Figure 2.1B depicts such a sample. There the line for an unfailed unit shows how long it ran without failure, and the arrow pointing to the right indicates that the unit's failure time is later. Time censored data are also called 'Qpe I censored. Data are singly failure censored if the test is stopped when a specified number of failures occurs. The time to that fixed number of failures is random. Figure 2.1C depicts such a sample. Time censoring is more common in practice. Failure censoring is more common in the theoretical literature, as it is mathematically more tractable. Chapters 3 and 5 present analyses for singly censored data.
MULTIPLY FAILURE CENSORED(I1)
6. SINGLY TIME CENSORED(1) 0 TIME UNIT -
F. COMPETING FAILURE MODES(A.B,CI
C. SINGLY FAILURE CENSOREDlll)
D. MULTIPLY TIME CENSORED(1) 0 TIME UllT
Figure 2.1. 'Qpes of data (failure time x, running time +,failure occurred earlier 4-I 1.
Multiply censored. Much data censored on the right have differing running times intermixed with the failure times. Such data are called multiply censored (also progressively, hyper-, and arbitrarily censored). Figure 2.1D depicts such a sample. Multiply censored data arise when units go on test at different times. Thus they have different running times when the data are recorded. Such data may be time censored (running times differ from failure times, as shown in Figure2.1D) or failure censored (running times equal failure times, as shown in Figure 2.1E). Chapters 3,5, and 7 treat such data.
Competing modes. A mix of competing failure modes occurs when sample units fail from different causes. Figure 2.1F depicts such a sample, where A, B, and C denote different failure modes. Data on a particular failure mode consist of the failure times of units failing by that mode. Such data for a mode are multiply censored. Chapters 3 and 7 treat such data.
Quantal-response. Sometimes one knows only whether the failure time of a unit is before or after a certain time. Each observation is either censored on the right or else on the left. Such life data arise if each unit is inspected once to see if it has already failed or not. Such inspection data are called quantal-response data, also called sensitivity, probit, binary, and allor-nothing response data. Figure 2.1G depicts such a sample. There the arrow for each unit shows whether the unit failed before its inspection or will fail later. Chapter 5 treats such data.
Interval. When each unit is inspected for failure more than once, one knows only that a unit failed in an interval between inspections. So-called interval, grouped, or read-out data are depicted in Figure 2.1H. There a solid line shows the interval where a unit failed, and a dotted line shows an inspection interval where it did not fail. Such data can also contain right and left censored observations. Chapter 5 treats such data.
Mixture. Data may also consist of a mixture of the above types of data.
Purpose. Analyses of such censored and interval data have much the same purposes as analyses of complete data, for example, estimation of model parameters and the product life distribution and prediction of future observations.
3. TYPES OF ACCELERATION AND STRESS LOADING
This section describes common types of acceleration of tests (high usage rate, overstress, censoring, degradation, and specimen design) and stress loading. Test purposes (Section 4) might profitably be read first.
High Usage Rate
A simple way to accelerate the life of many products is to run the product more - at a higher usage rate. The following are two common ways of doing such compressed time testing.
INTRODUCTION AND BACKGROUND
Faster, One way to accelerate is to run the product faster. For example, in many life tests, rolling bearings run at about three times their normal speed. High usage rate may also be used in combination with overstress testing. For example, such bearings are also tested under higher than normal mechanical load. Another example of high usage rate involves a voltage endurance test of an electrical insulation by Johnston and others (1979). The AC voltage in the test was cycled at 412 Hz instead of the normal 60 Hz, and test was shorter by a factor of 412/60 = 6.87.
Reduced off time. Many products are off much of the time in actual use. Such products can be accelerated by running them a greater fraction of the time. For example, in most homes, a major appliance (say, washer or dryer) runs an hour or two a day; on test it runs 24 hours a day. In use, a refrigerator compressor runs about 15 hours a day; on test it runs 24. A small appliance (say, toaster or coffee maker) runs a few cycles a day; on test it cycles many times a day.
Purpose. The purpose of such testing is to estimate the product life distribution at normal usage rates. It is assumed that the number of cycles, revolutions, hours, etc., to failure on test is the same that would be observed at the normal usage rate. For example, it is assumed that a bearing that runs 6.2 million revolutions to failure at high rpm would run 6.2 million revolutions at normal rpm. The data are treated as a sample from actual use. Then standard life data analyses provide estimates of the percentage failing on warranty, the median life, etc. They also provide comparisons of designs, manufacturing methods, materials, vendors, etc. Such analyses are explained by Nelson (1983c,1982, pp. 567-569) and by reliability books he references.
The assumption. It is not automatically true that the number of cycles to failure at high and normal usage rates is the same. Usually the test must be run with special care to assure that product operation and stress remain normal in all regards except usage rate. For example, high rate usage usually raises the temperature of the product. That usually results in fewer cycles to failure. It may even produce failure modes not seen at normal temperature and usage rate. Thus many such tests involve cooling the product to keep the temperature at a normal level. In contrast, products sensitive to thermal cycling may last longer if run continuously without thermal cycling. For this reason, toasters on test are force cooled by a fan between cycles.
Overstress Testing
Overstress testing consists of running a product at higher than normal levels of some accelerating stress(es) to shorten product life or to degrade product performance faster. Typical accelerating stresses are temperature, voltage, mechanical load, thermal cycling, humidity, and vibration. Later, overstress tests are described according to purpose and the nature of the test.
Overstress testing is the most common form of accelerated testing and is a main subject of this book.
Censoring
Modern practice includes accelerating tests through censoring (Chapters 5 and 6). That is, tests are terminated before all specimens run to failure. This shortens test time. For higher reliability products, one is usually interested in just the lower tail of the life distribution. Then usually little information is gained from data from the upper tail. However, sometimes an important failure mode is active at the design stress level and does not occur in the lower tail at the test stress levels. But it occurs in the uppe? tail. Then data from the upper tail is useful, and terminating the test early would miss that important failure mode (Chapter 7).
madstion
Method. Accelerated degradation testing involves overstress testing. Instead of life, product pefomance is observed as it degrades over time. For example, the breakdown voltage of insulation specimens at high temperature is measured at various ages. A model for performance degradation is fitted to such performance data and used to extrapolate performance and time of failure. Thus failure and the life distribution can be predicted before any specimen fails. This accelerates the test. Failure is assumed to occur when a specimen performance degrades below a specified value. For example, an insulation specimen fails when its breakdown voltage degrades below the design voltage. Chapter 11presents models and data analyses for accelerated degradation.
Specimen Design
Life of some products can be accelerated through the size, geometry, and finish of specimens.
Size. Generally large specimens fail sooner than small ones. For example, high capacitance capacitors fail sooner than low capacitance ones of the same design. The large capacitors merely have more dielectric area. Similarly, long cable specimens fail sooner than short ones. Time to breakdown of an insulating fluid is shorter for electrodes with a three-inch diameter than for electrodes with a one-inch diameter. Large (diameter or length) metal fatigue specimens fail sooner than short ones. Creep-rupture specimens have been linked end-to-end in a group to increase the amount of metal on a test machine. They are tested until the first specimen of a group fails; this is called sudden-death testing. Usually one wants to estimate the life of a smaller or larger standard size of the product. Such an estimate requires a model that takes specimen size into account (Chapter 7). Harter (1977) surveys such models.
Geometry. Specimen geometry may affect specimen life. For example, some metal fatigue, crack propagation, and creep-rupture specimens are notched. Such notches produce local high stress and early failure. One might argue that such specimens are locally overstressed or should be discussed under overstress testing. On the other hand, the average stress in such a specimen may be the normal design stress. Also, surface finish (roughness) and residual stresses of metal specimens affect fatigue life.
Stress Loading
The stress loading in an accelerated test can be applied various ways. Descriptions of common loadings follow. They include constant, cyclic, step, progressive, and random stress loading. The discussion is limited to a single stress variable, but the concepts extend to multiple stress variables.
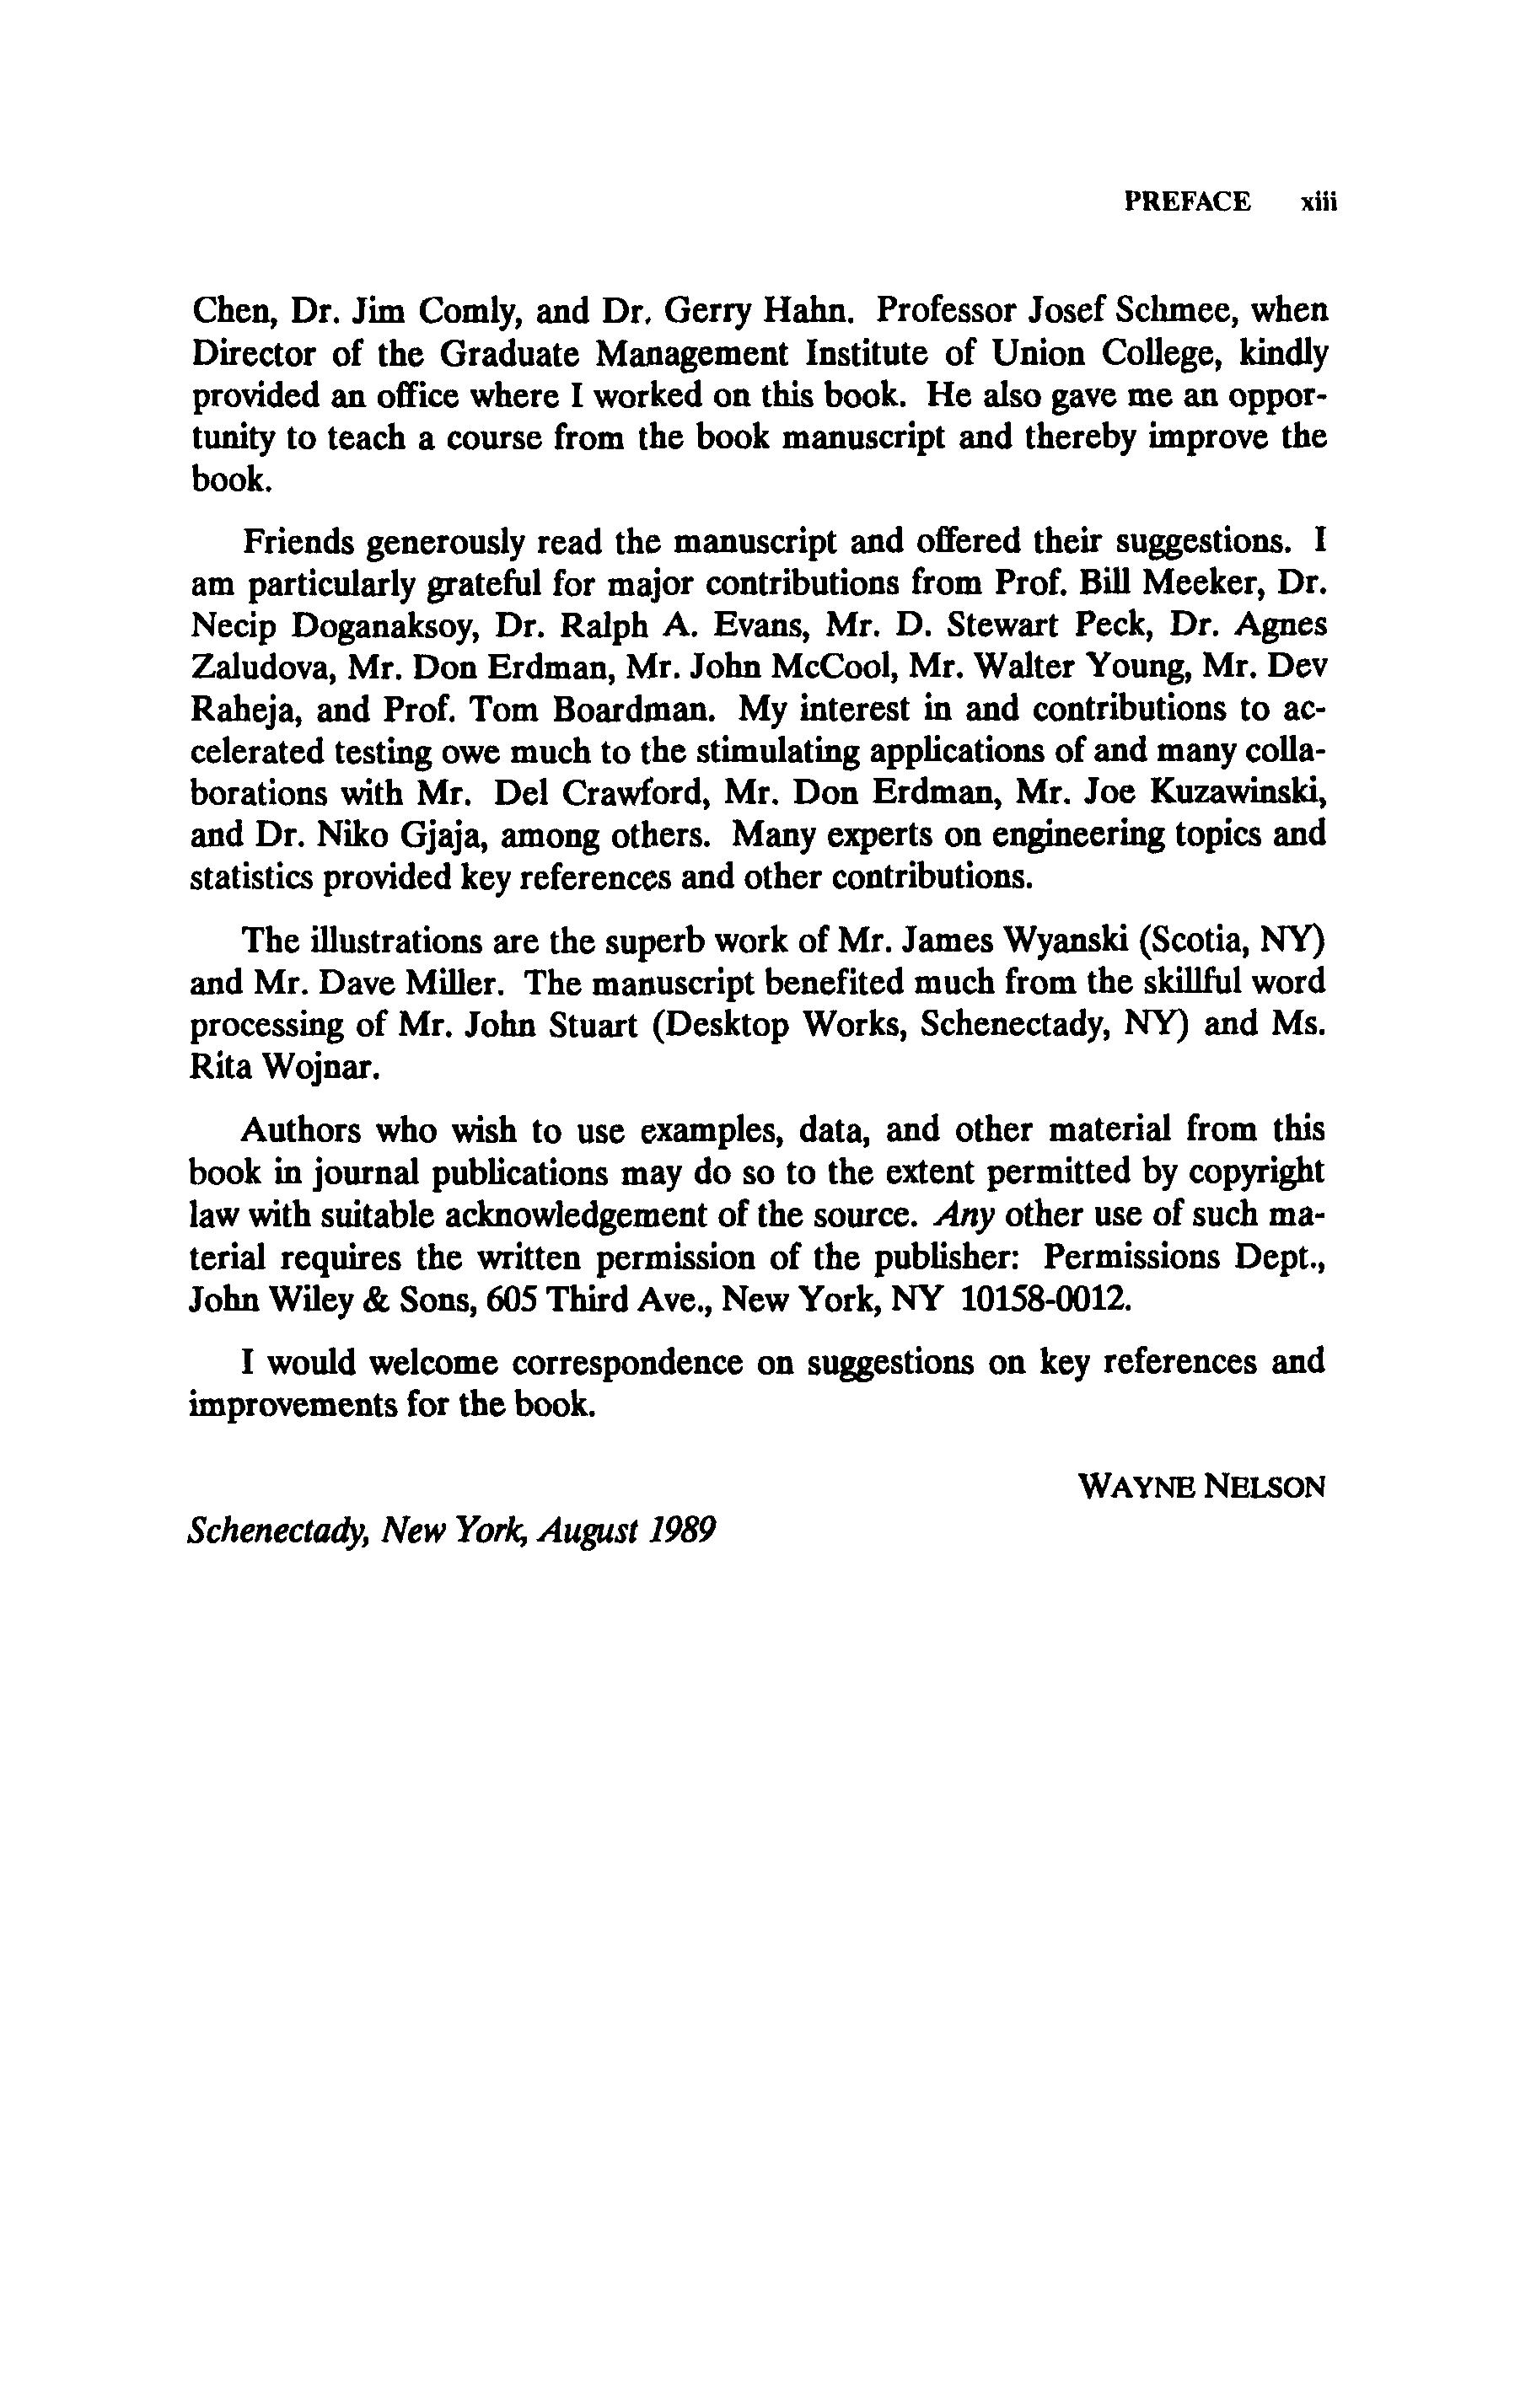
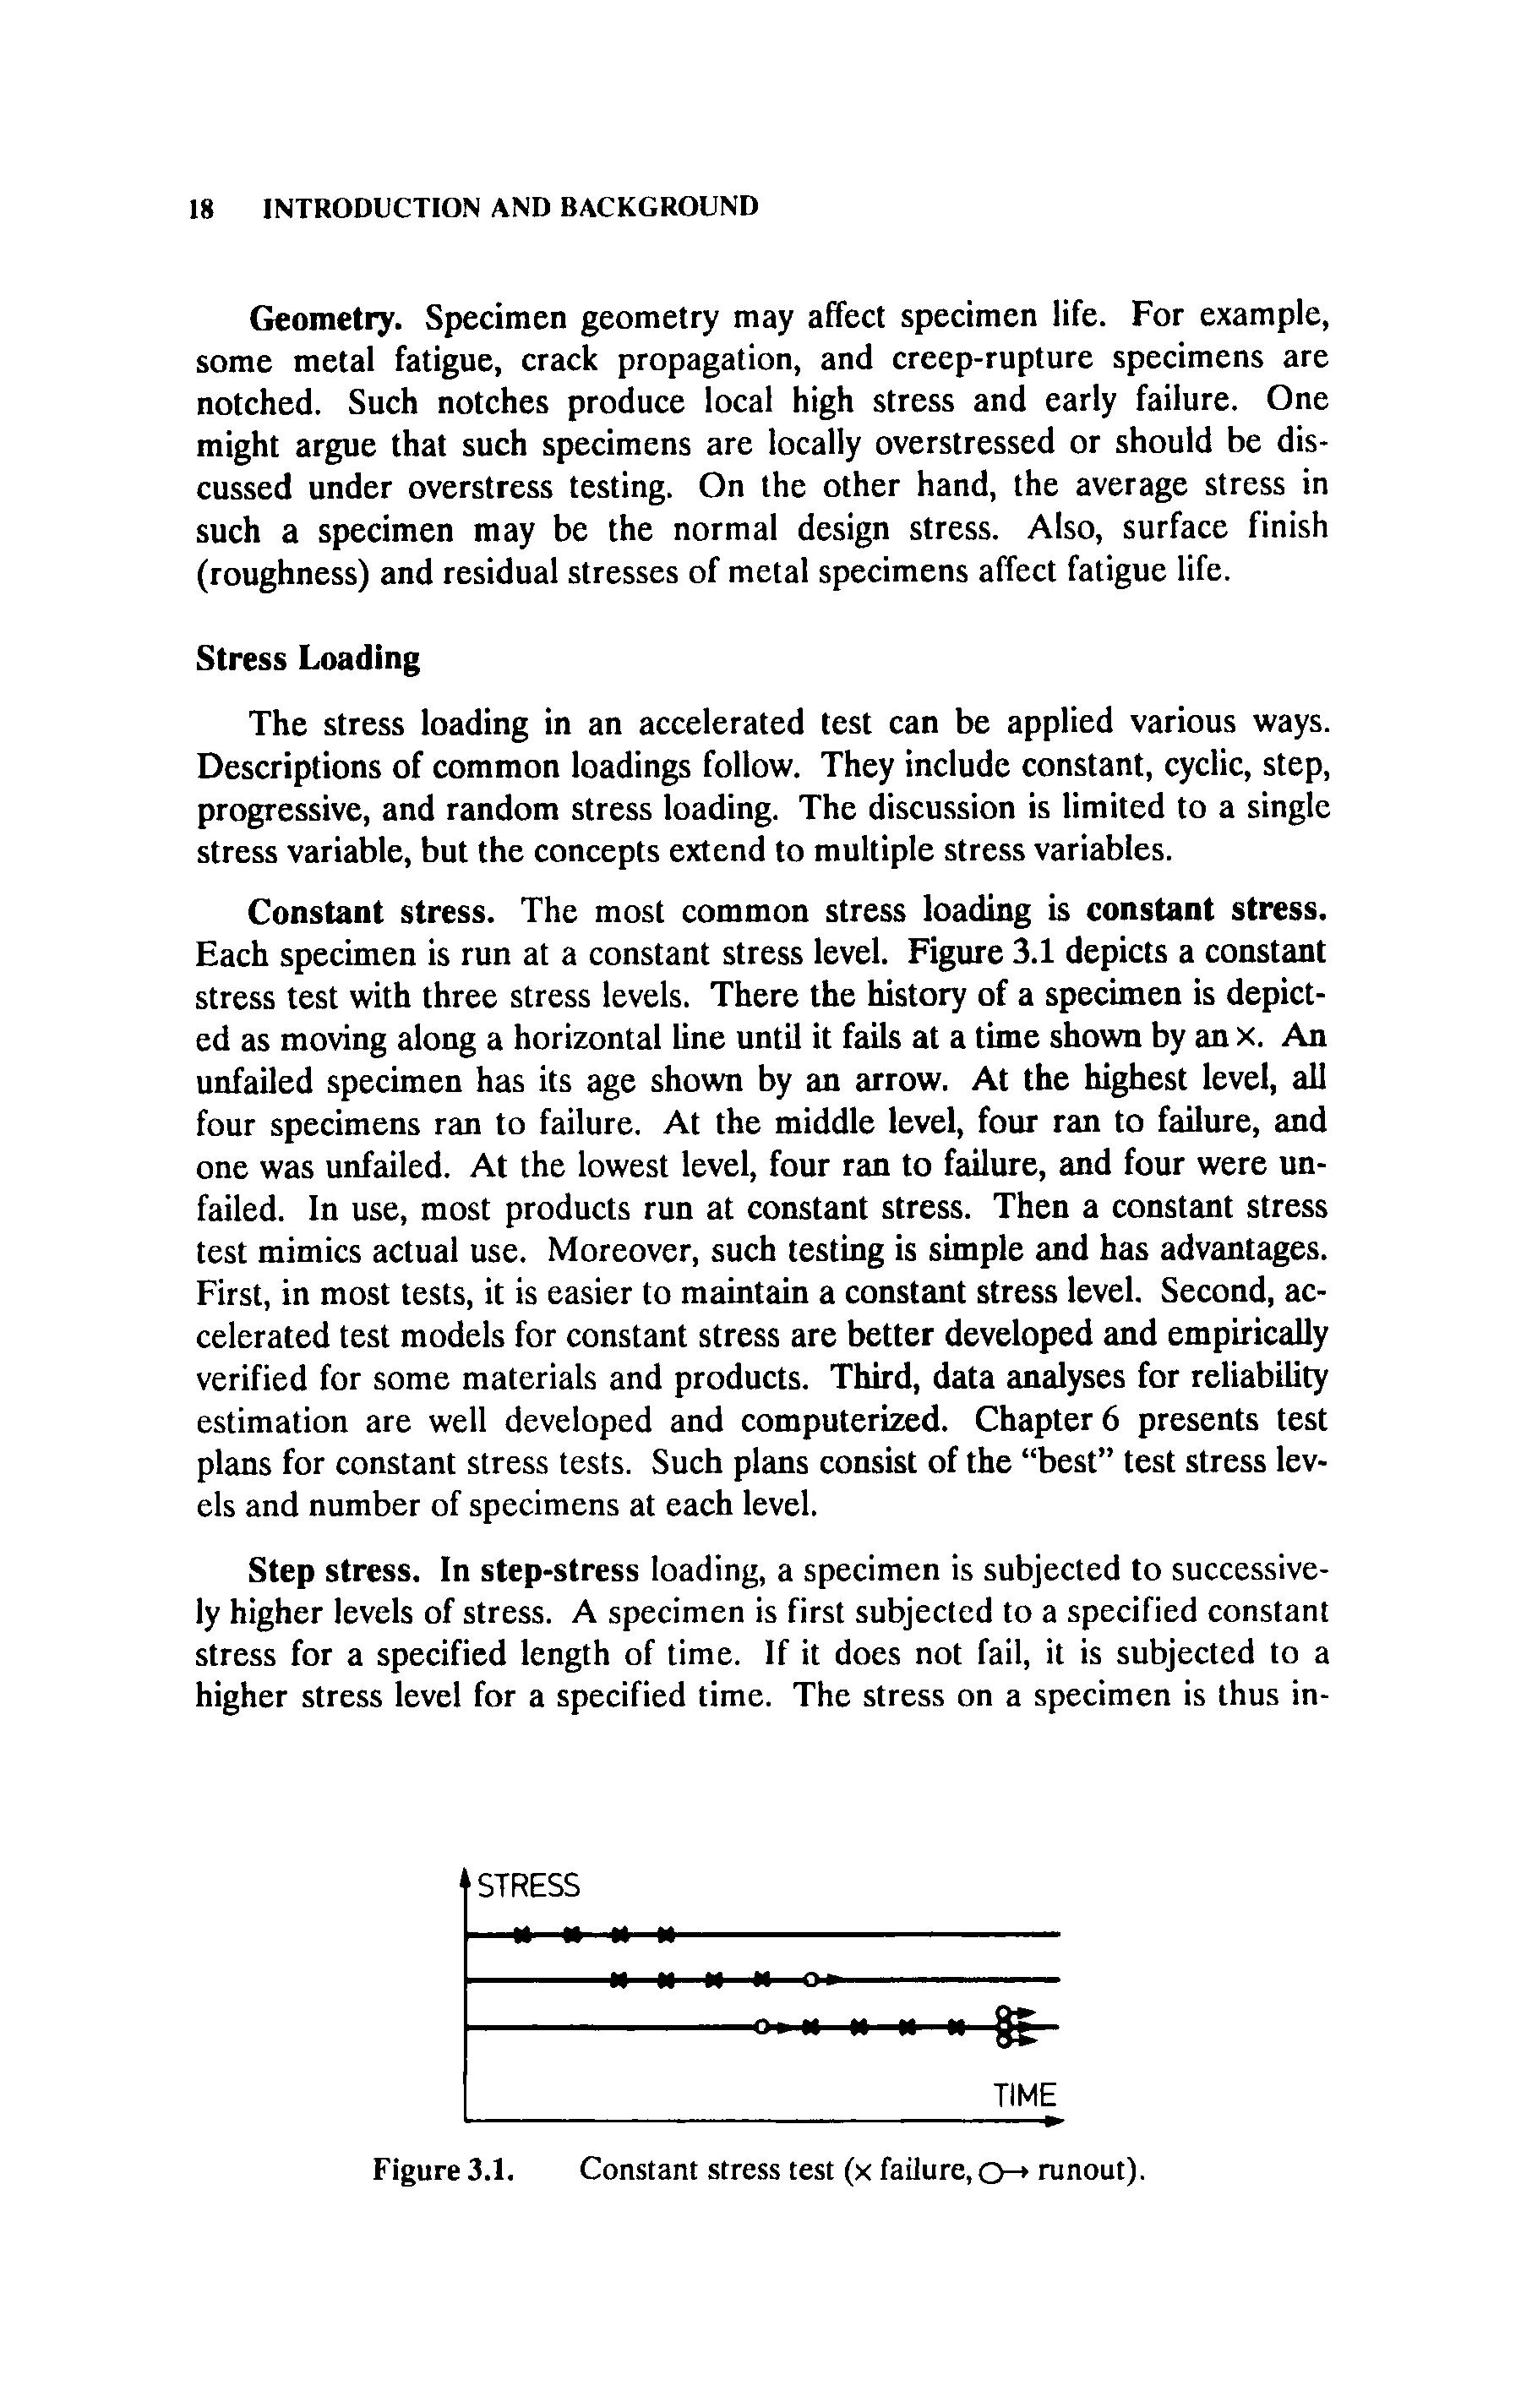
Constant stress. The most common stress loading is constant stress. Each specimen is run at a constant stress level. Figure 3.1 depicts a constant stress test with three stress levels. There the history of a specimen is depicted as moving along a horizontal line until it fails at a time shown by an X. An unfailed specimen has its age shown by an arrow. At the highest level, all four specimens ran to failure. At the middle level, four ran to failure, and one was unfailed. At the lowest level, four ran to failure, and four were unfailed. In use, most products run at constant stress. Then a constant stress test mimics actual use. Moreover, such testing is simple and has advantages. First, in most tests, it is easier to maintain a constant stress level. Second, accelerated test models for constant stress are better developed and empirically verified for some materials and products. Third, data analyses for reliability estimation are well developed and computerized. Chapter 6 presents test plans for constant stress tests. Such plans consist of the “best” test stress levels and number of specimens at each level.
Step stress. In step-stress loading, a specimen is subjected to successively higher levels of stress. A specimen is first subjected to a specified constant stress for a specified length of time. If it does not fail, it is subjected to a higher stress level for a specified time. The stress on a specimen is thus in-
Figure 3.1. Constant stress test (x failure,- runout).
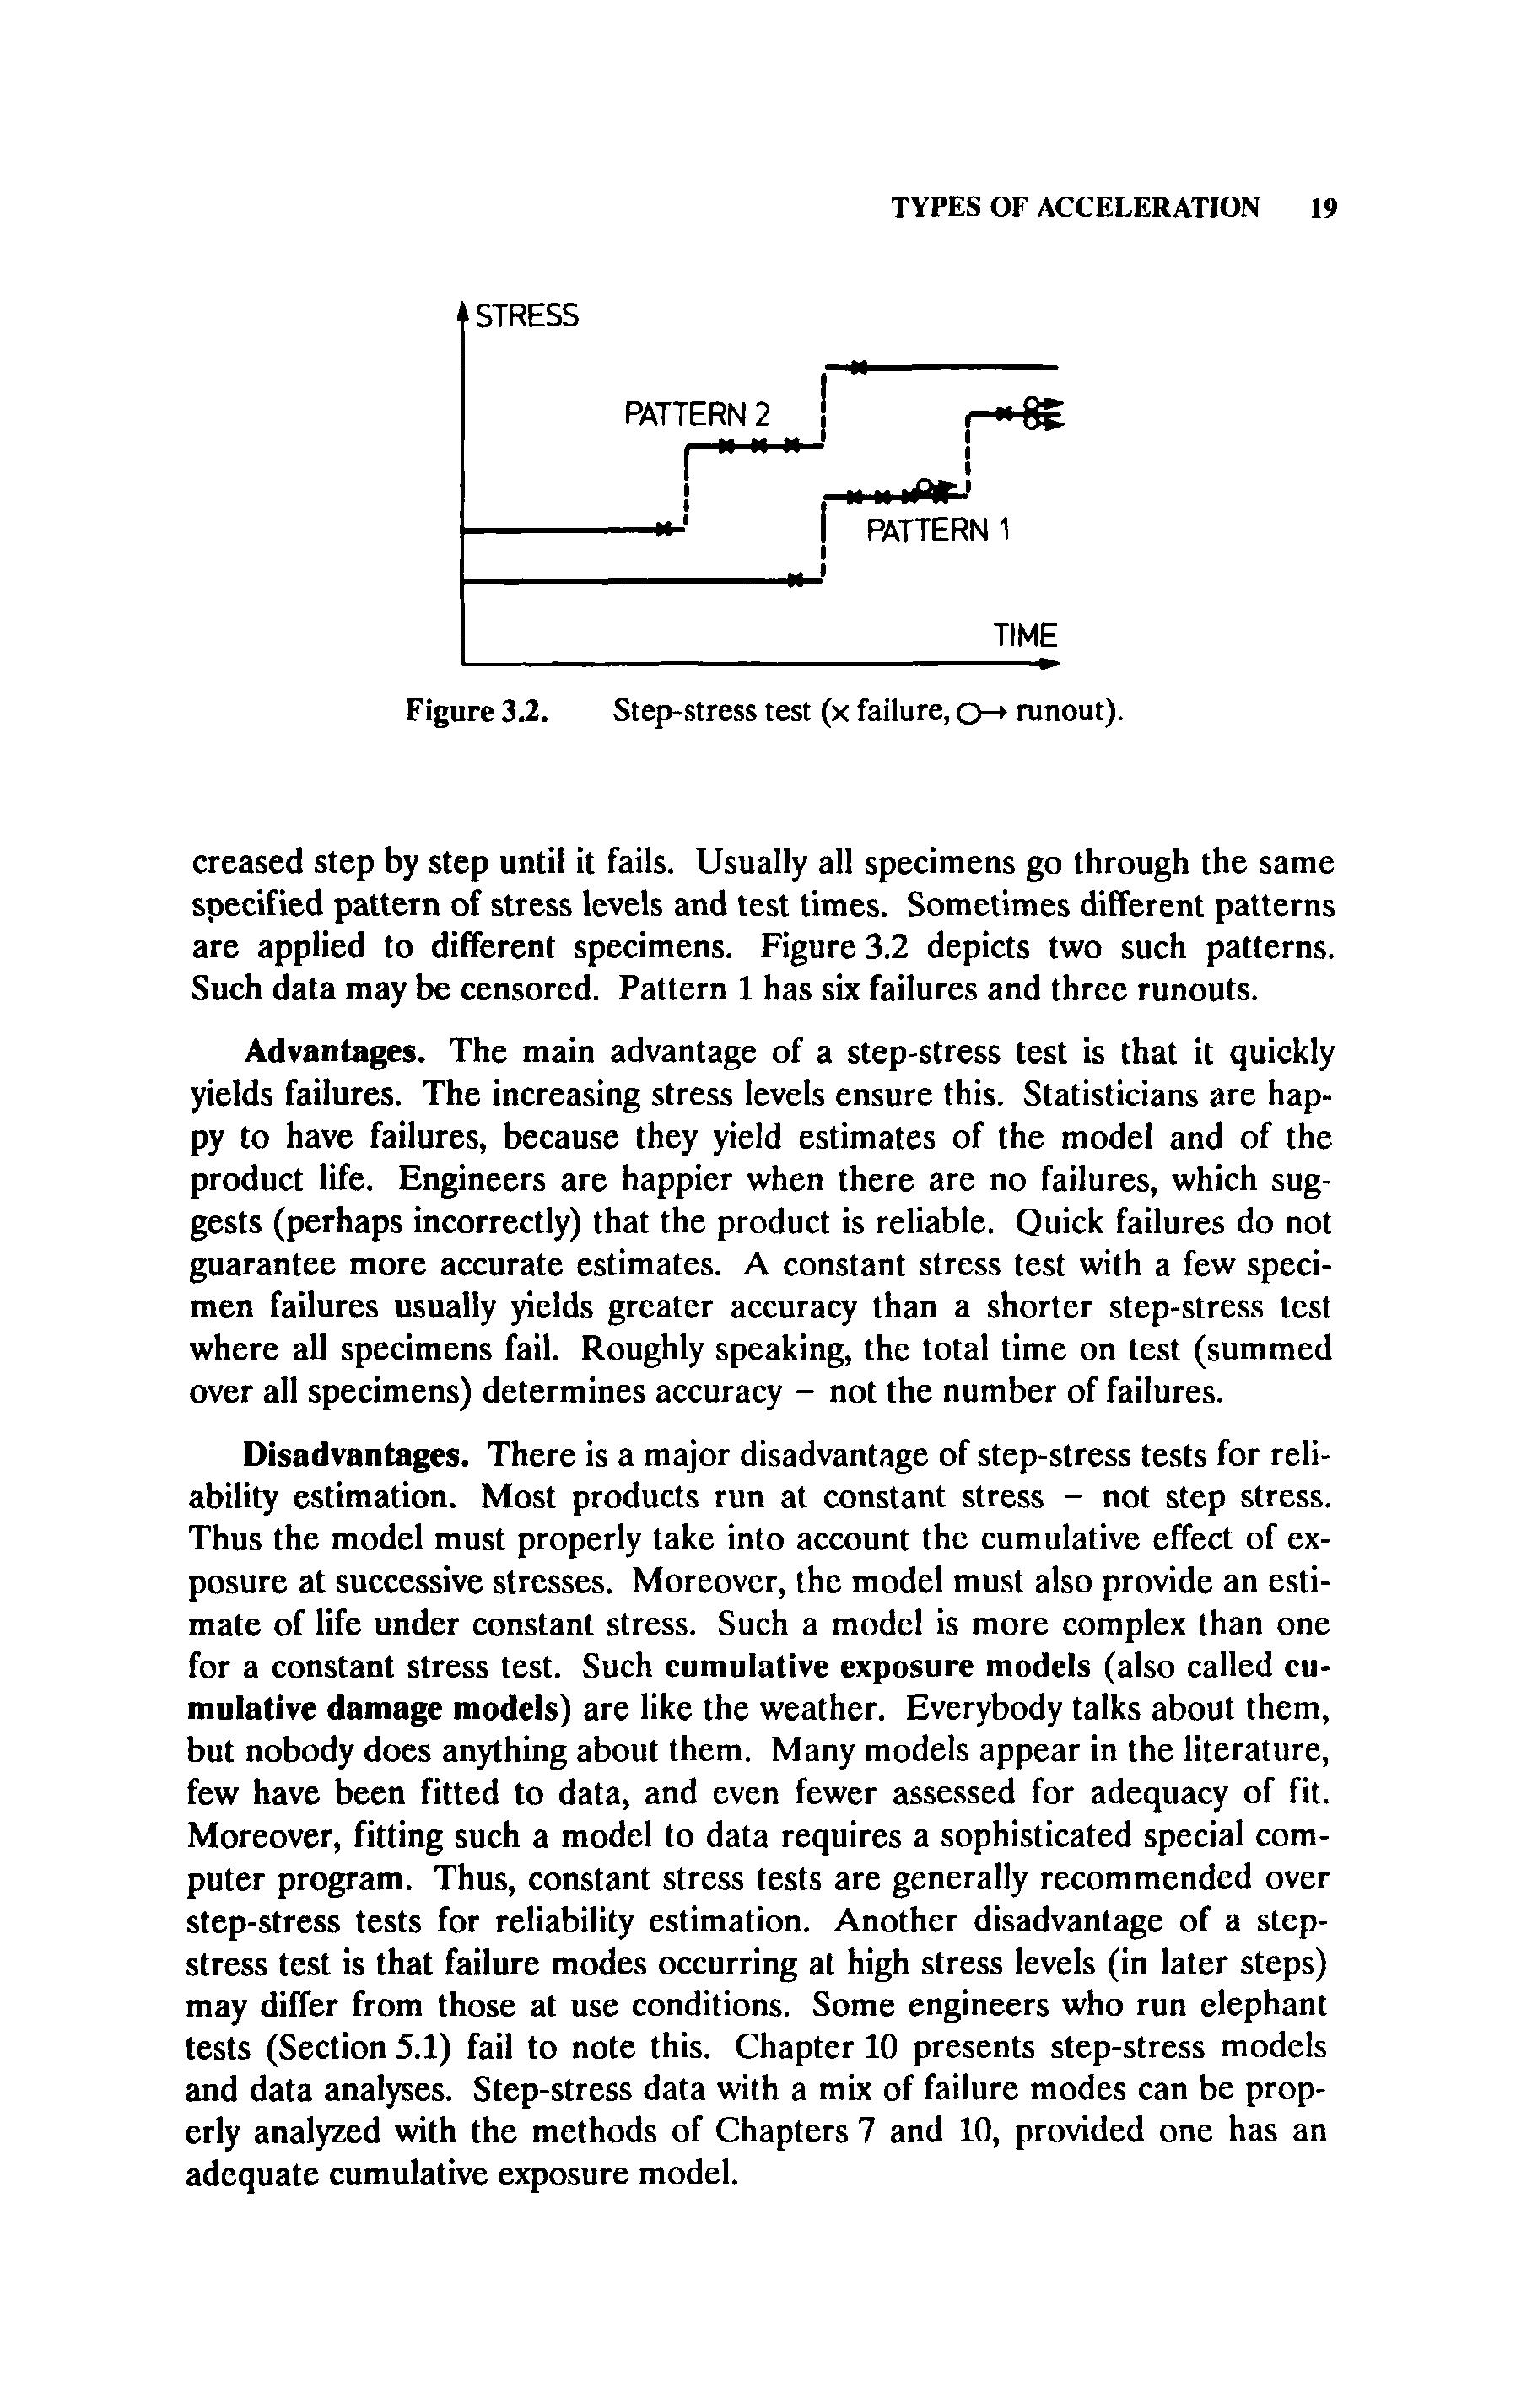
creased step by step until it fails. Usually all specimens go through the same specified pattern of stress levels and test times. Sometimes different patterns are applied to different specimens. Figure 3.2 depicts two such patterns. Such data may be censored. Pattern 1 has six failures and three runouts.
Advantages. The main advantage of a step-stress test is that it quickly yields failures. The increasing stress levels ensure this. Statisticians are happy to have failures, because they yield estimates of the model and of the product life. Engineers are happier when there are no failures, which suggests (perhaps incorrectly) that the product is reliable. Quick failures do not guarantee more accurate estimates. A constant stress test with a few specimen failures usually yields greater accuracy than a shorter step-stress test where all specimens fail. Roughly speaking, the total time on test (summed over all specimens) determines accuracy - not the number of failures.
Disadvantages. There is a major disadvantage of step-stress tests for reliability estimation. Most products run at constant stress - not step stress. Thus the model must properly take into account the cumulative effect of exposure at successive stresses. Moreover, the model must also provide an estimate of life under constant stress. Such a model is more complex than one for a constant stress test. Such cumulative exposure models (also called cumulative damage models) are like the weather. Everybody talks about them, but nobody does anything about them. Many models appear in the literature, few have been fitted to data, and even fewer assessed for adequacy of fit. Moreover, fitting such a model to data requires a sophisticated special computer program. Thus, constant stress tests are generally recommended over step-stress tests for reliability estimation. Another disadvantage of a stepstress test is that failure modes occurring at high stress levels (in later steps) may differ from those at use conditions. Some engineers who run elephant tests (Section 5.1) fail to note this. Chapter 10 presents step-stress models and data analyses. Step-stress data with a mix of failure modes can be properly analyzed with the methods of Chapters 7 and 10, provided one has an adequate cumulative exposure model.
Figure 3.2. Stepstress test (x failure, o-+runout).
TIME e
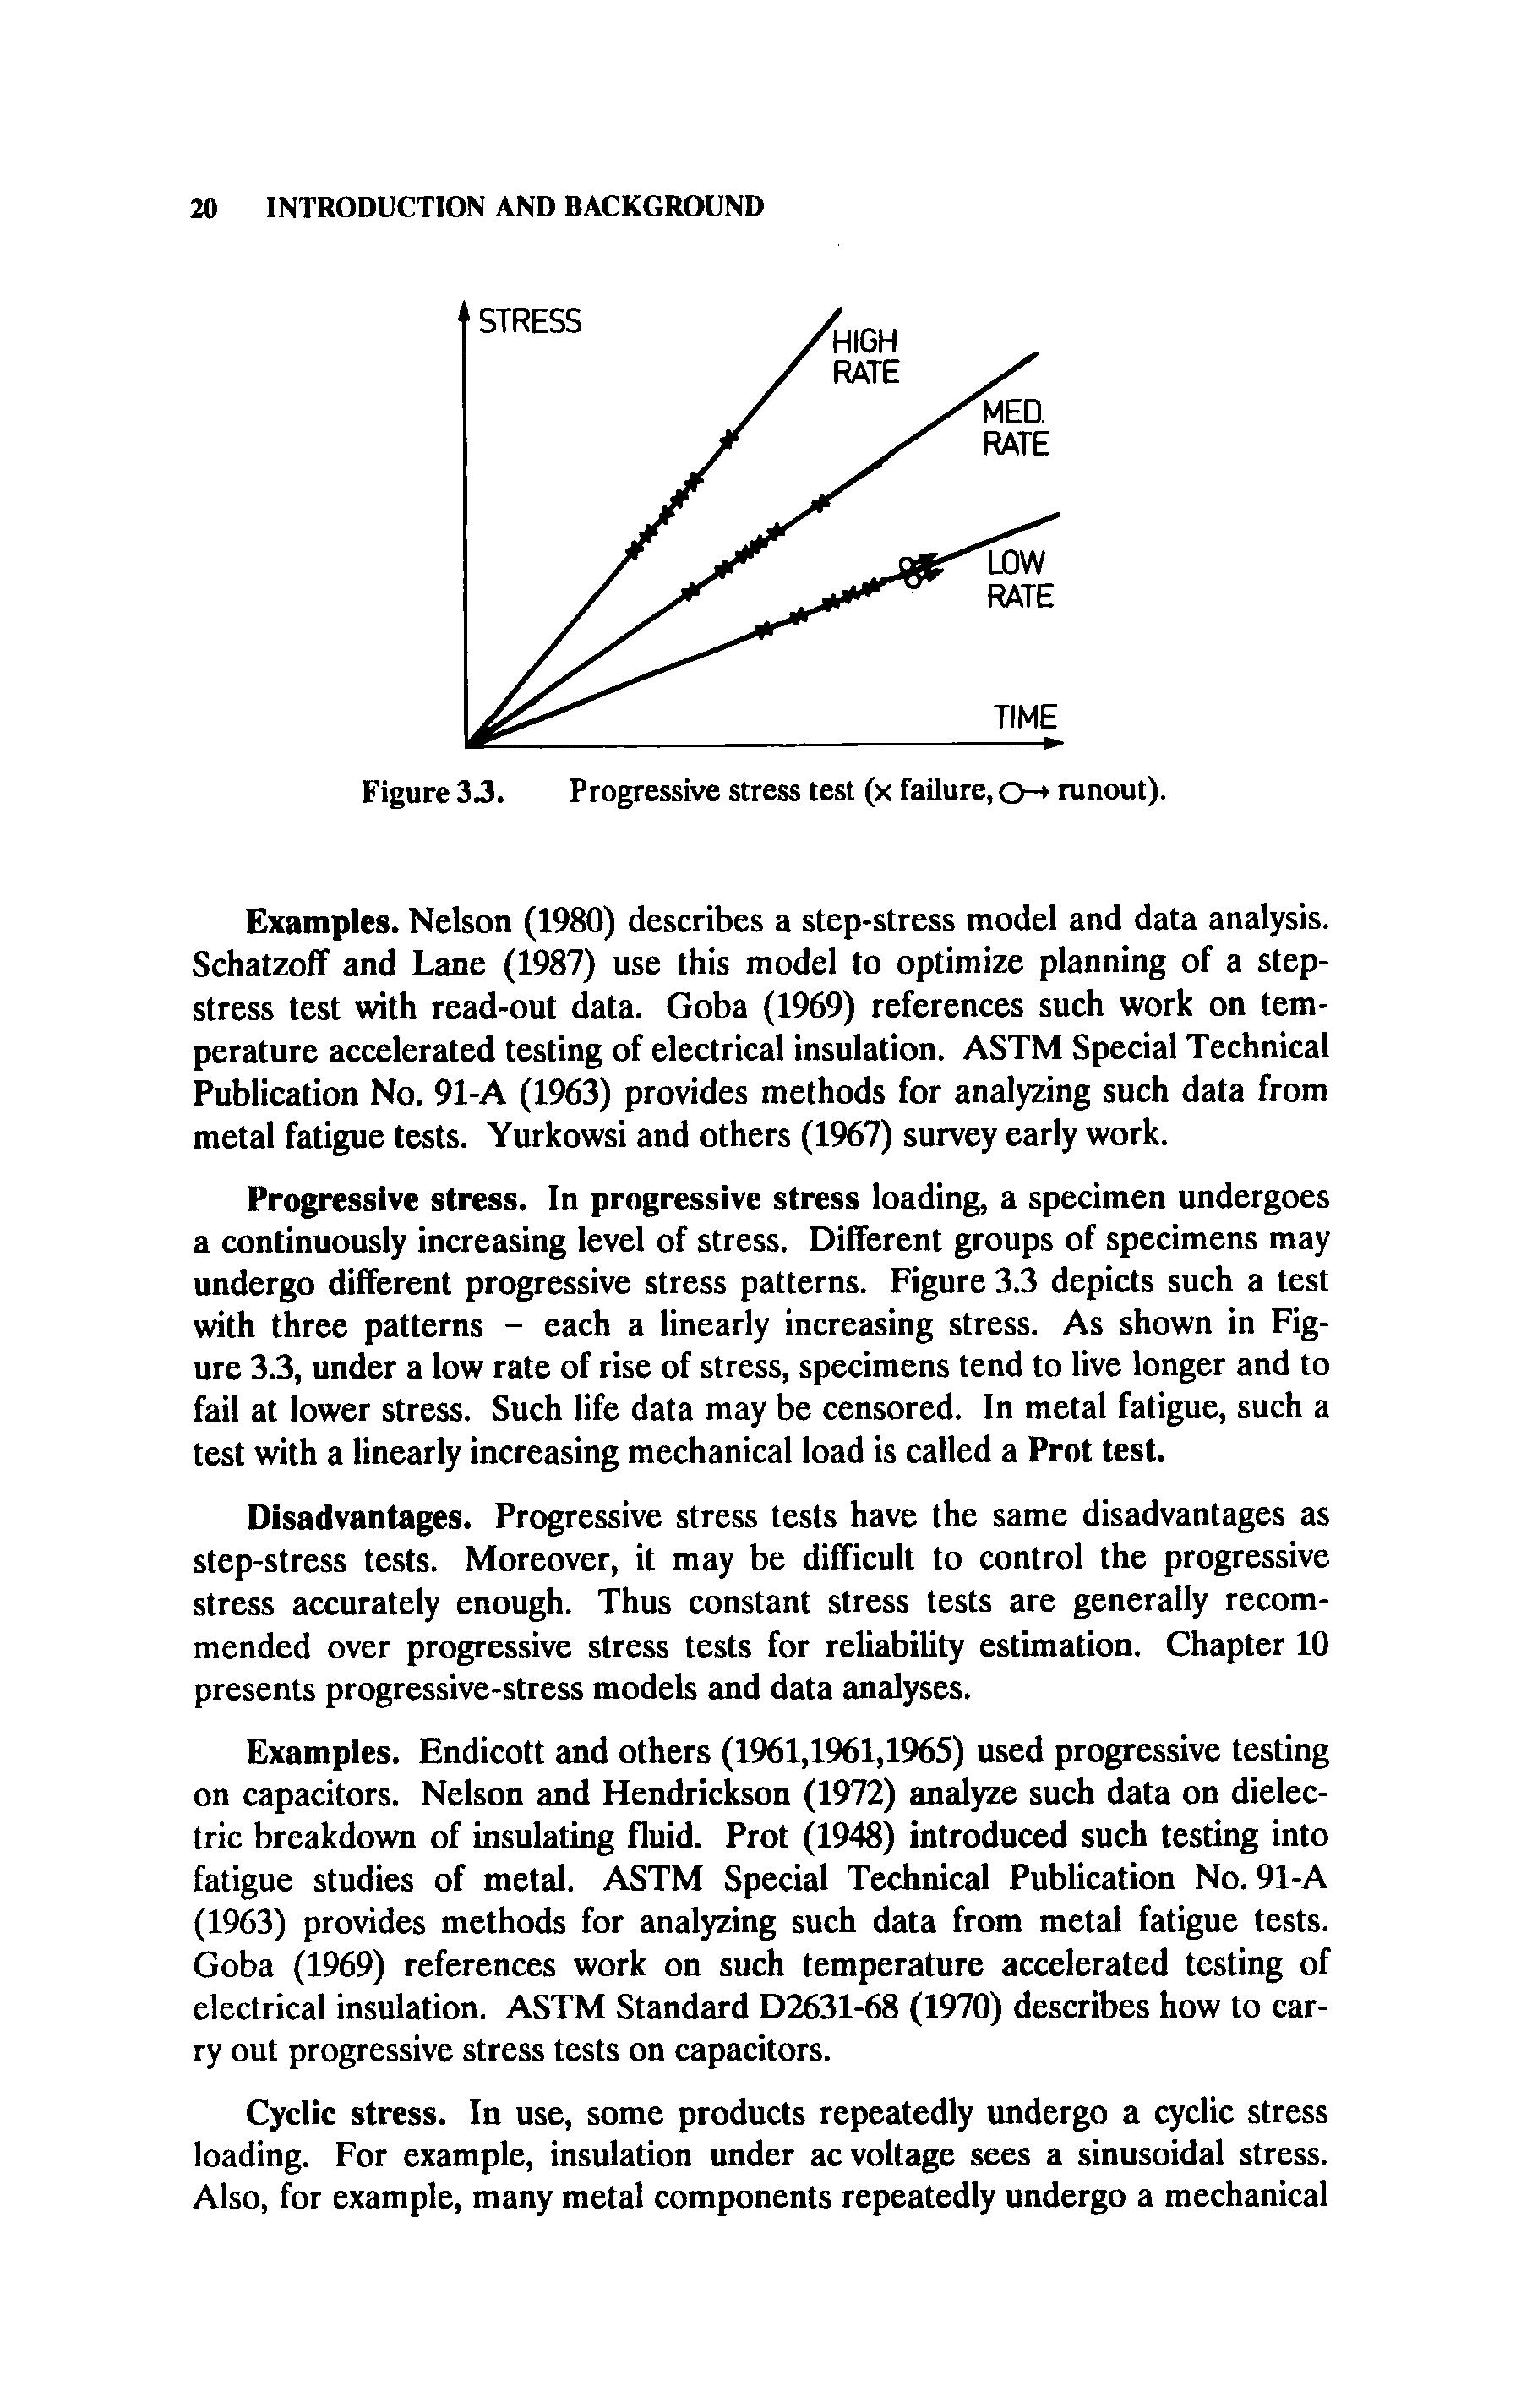
Figure 33. Progressive stress test (x failure, o+ runout).
Examples. Nelson (1980) describes a step-stress model and data analysis. Schatzoff and Lane (1987) use this model to optimize planning of a stepstress test with read-out data. Goba (1969) references such work on temperature accelerated testing of electrical insulation. ASTM Special Technical Publication No. 91-A (1963) provides methods for analyzing such data from metal fatigue tests. Yurkowsi and others (1967) survey early work.
Progressive stress. In progressive stress loading, a specimen undergoes a continuously increasing level of stress. Different groups of specimens may undergo different progressive stress patterns. Figure 3.3 depicts such a test with three patterns - each a linearly increasing stress. As shown in Figure 3.3, under a low rate of rise of stress, specimens tend to live longer and to fail at lower stress. Such life data may be censored. In metal fatigue, such a test with a linearly increasing mechanical load is called a Prot test.
Disadvantages. Progressive stress tests have the same disadvantages as step-stress tests. Moreover, it may be difficult to control the progressive stress accurately enough. Thus constant stress tests are generally recommended over progressive stress tests for reliability estimation. Chapter 10 presents progressive-stress models and data analyses.
Examples. Endicott and others (1%1,1%1,1%5) used progressive testing on capacitors. Nelson and Hendrickson (1972) analyze such data on dielectric breakdown of insulating fluid. Prot (1948) introduced such testing into fatigue studies of metal. ASTM Special Technical Publication No. 91-A (1963) provides methods for analyzing such data from metal fatigue tests. Goba (1969) references work on such temperature accelerated testing of electrical insulation. ASTM Standard D2631-68 (1970) describes how to carry out progressive stress tests on capacitors.
Cyclic stress. In use, some products repeatedly undergo a cyclic stress loading. For example, insulation under ac voltage sees a sinusoidal stress. Also, for example, many metal components repeatedly undergo a mechanical
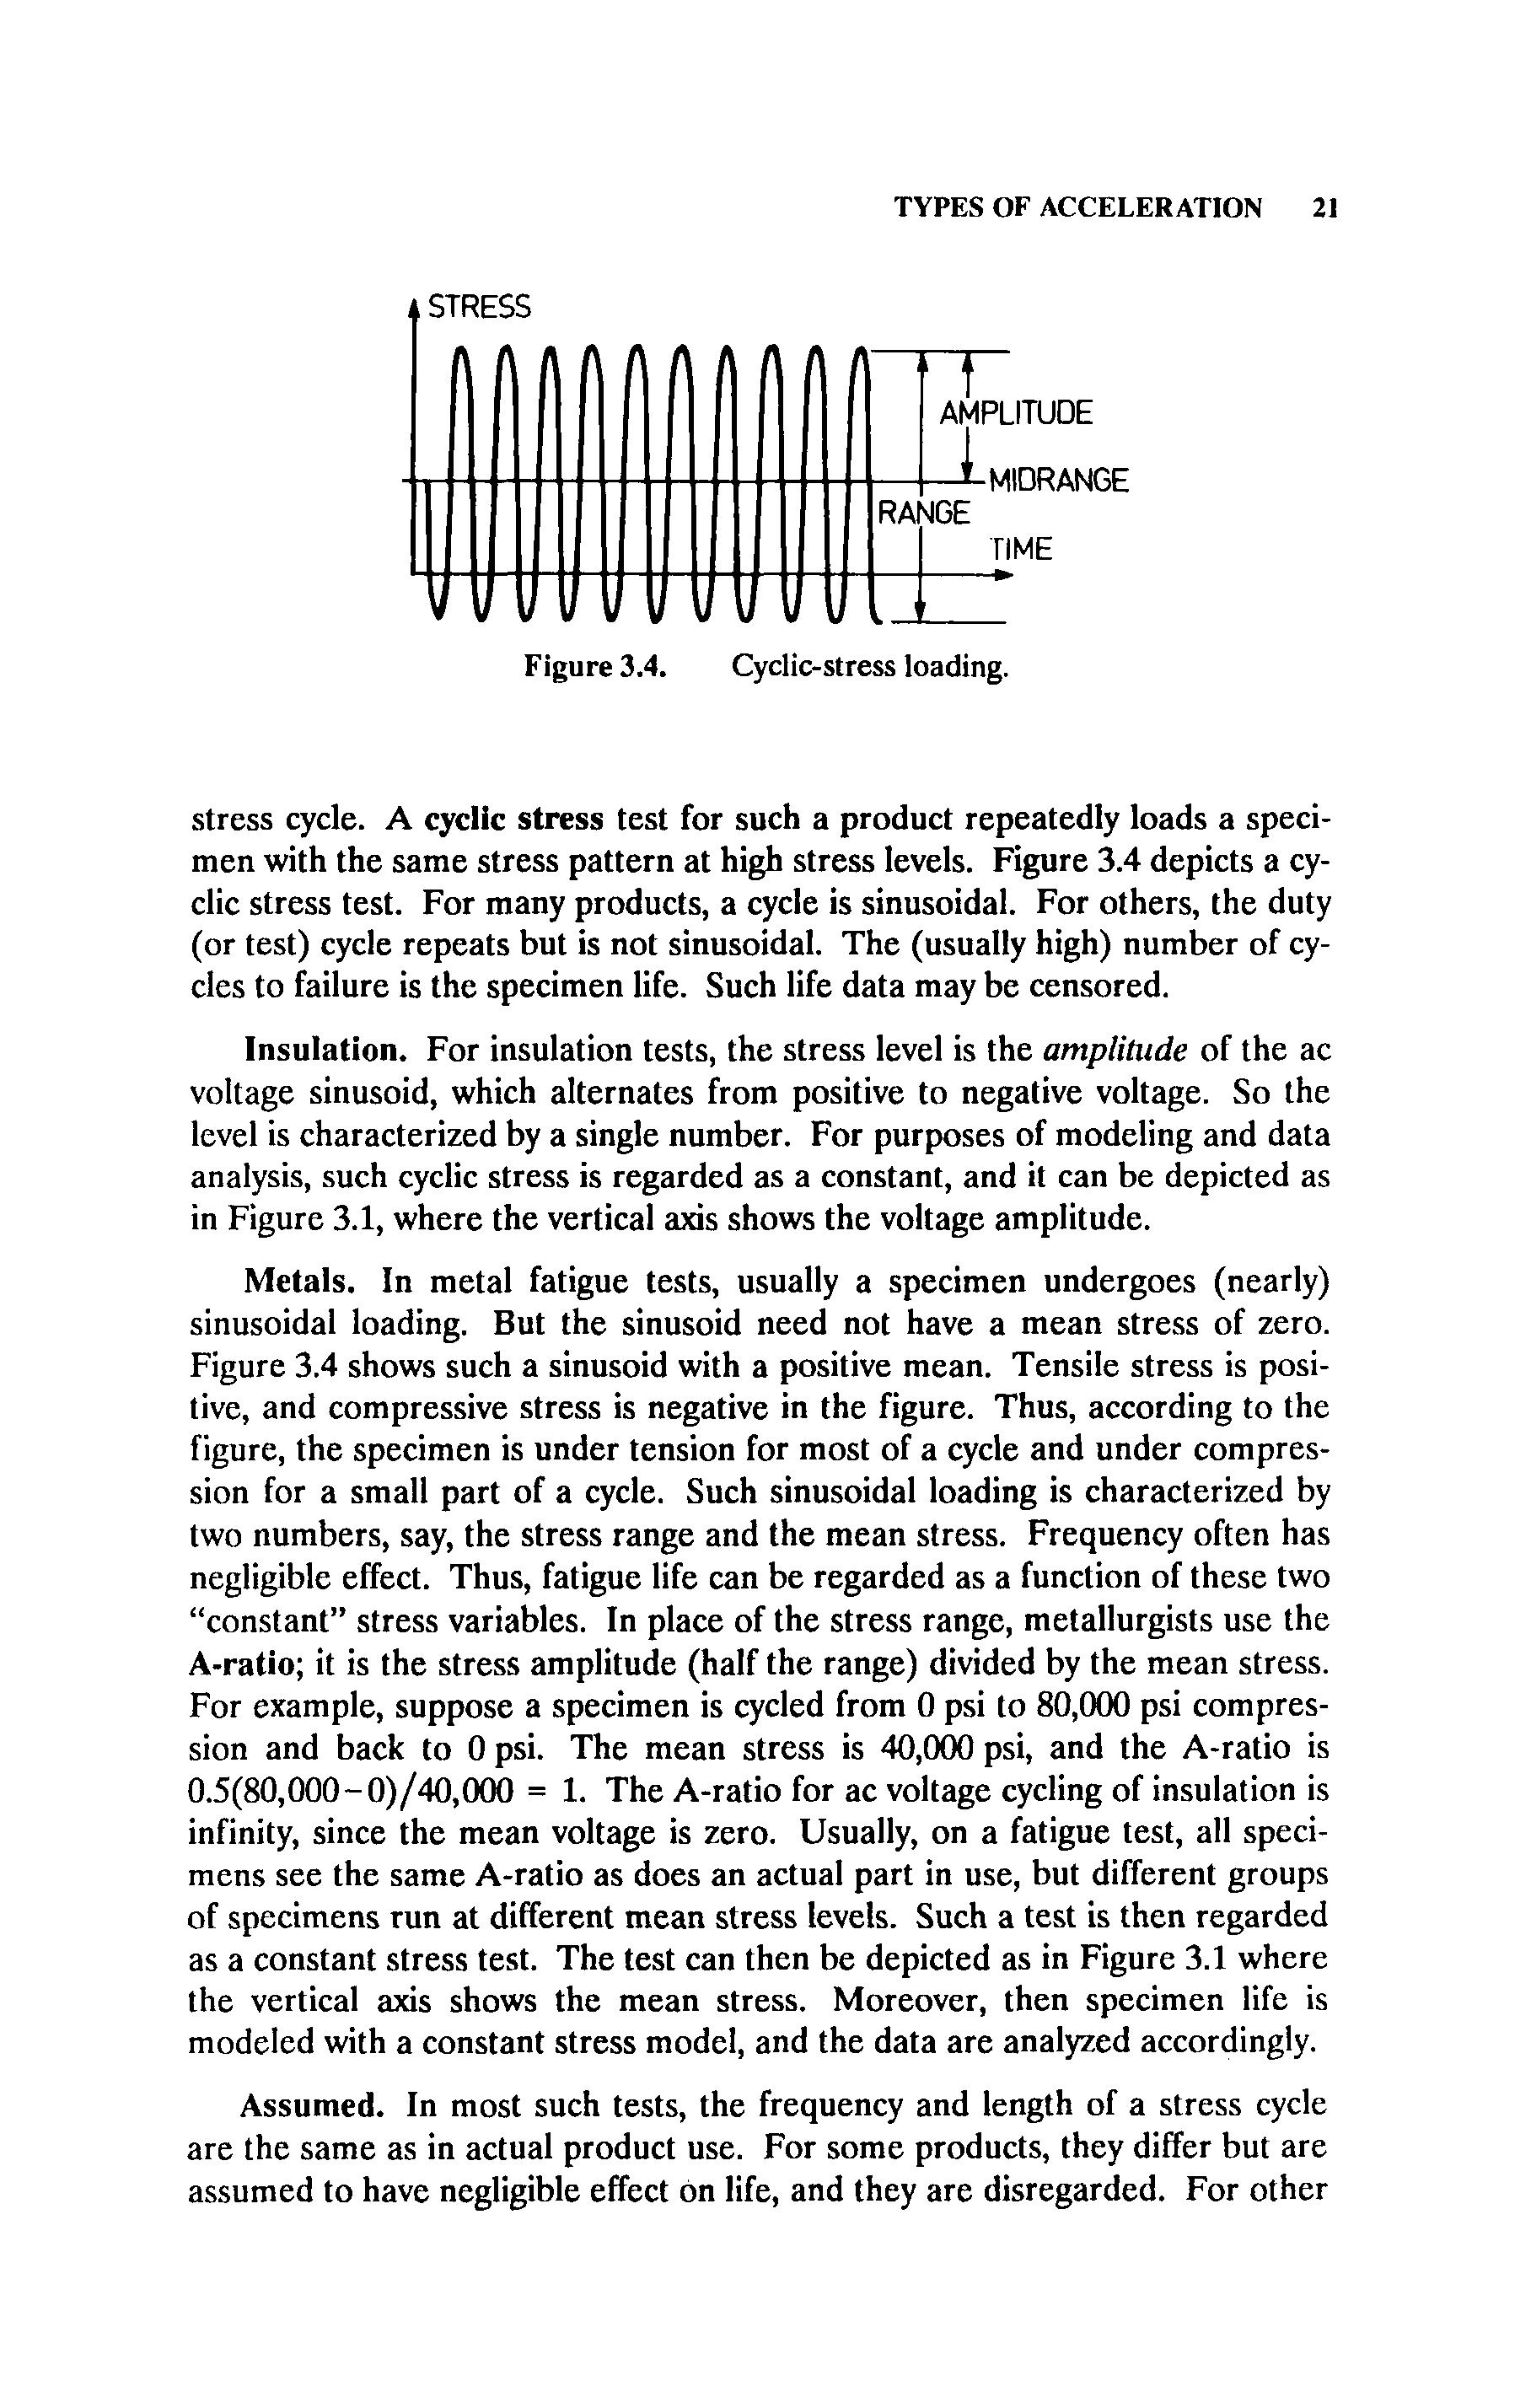
stress cycle. A cyclic stress test for such a product repeatedly loads a specimen with the same stress pattern at high stress levels. Figure 3.4 depicts a cyclic stress test. For many products, a cycle is sinusoidal. For others, the duty (or test) cycle repeats but is not sinusoidal. The (usually high) number of cycles to failure is the specimen life. Such life data may be censored.
Insulation. For insulation tests, the stress level is the umplihtde of the ac voltage sinusoid, which alternates from positive to negative voltage. So the level is characterized by a single number. For purposes of modeling and data analysis, such cyclic stress is regarded as a constant, and it can be depicted as in Figure 3.1, where the vertical axis shows the voltage amplitude.
Metals. In metal fatigue tests, usually a specimen undergoes (nearly) sinusoidal loading. But the sinusoid need not have a mean stress of zero. Figure 3.4 shows such a sinusoid with a positive mean. Tensile stress is positive, and compressive stress is negative in the figure. Thus, according to the figure, the specimen is under tension for most of a cycle and under compression for a small part of a cycle. Such sinusoidal loading is characterized by two numbers, say, the stress range and the mean stress. Frequency often has negligible effect. Thus, fatigue life can be regarded as a function of these two “constant” stress variables. In place of the stress range, metallurgists use the A-ratio; it is the stress amplitude (half the range) divided by the mean stress. For example, suppose a specimen is cycled from 0 psi to 80,000 psi compression and back to 0 psi. The mean stress is 40,OOO psi, and the A-ratio is OS(80,OOO-0)/40,OOO = 1. The A-ratio for ac voltage cycling of insulation is infinity, since the mean voltage is zero. Usually, on a fatigue test, all specimens see the same A-ratio as does an actual part in use, but different groups of specimens run at different mean stress levels. Such a test is then regarded as a constant stress test. The test can then be depicted as in Figure 3.1 where the vertical axis shows the mean stress. Moreover, then specimen life is modeled with a constant stress model, and the data are analyzed accordingly.
Assumed. In most such tests, the frequency and length of a stress cycle are the same as in actual product use. For some products, they differ but are assumed to have negligible effect on life, and they are disregarded. For other
Figure 3.4. Cyclic-stressloading.
ITIME
Figure 3.5. Random stress loading.
products, the frequency and length of a cycle affect life; so they are included in the model as stress variables.
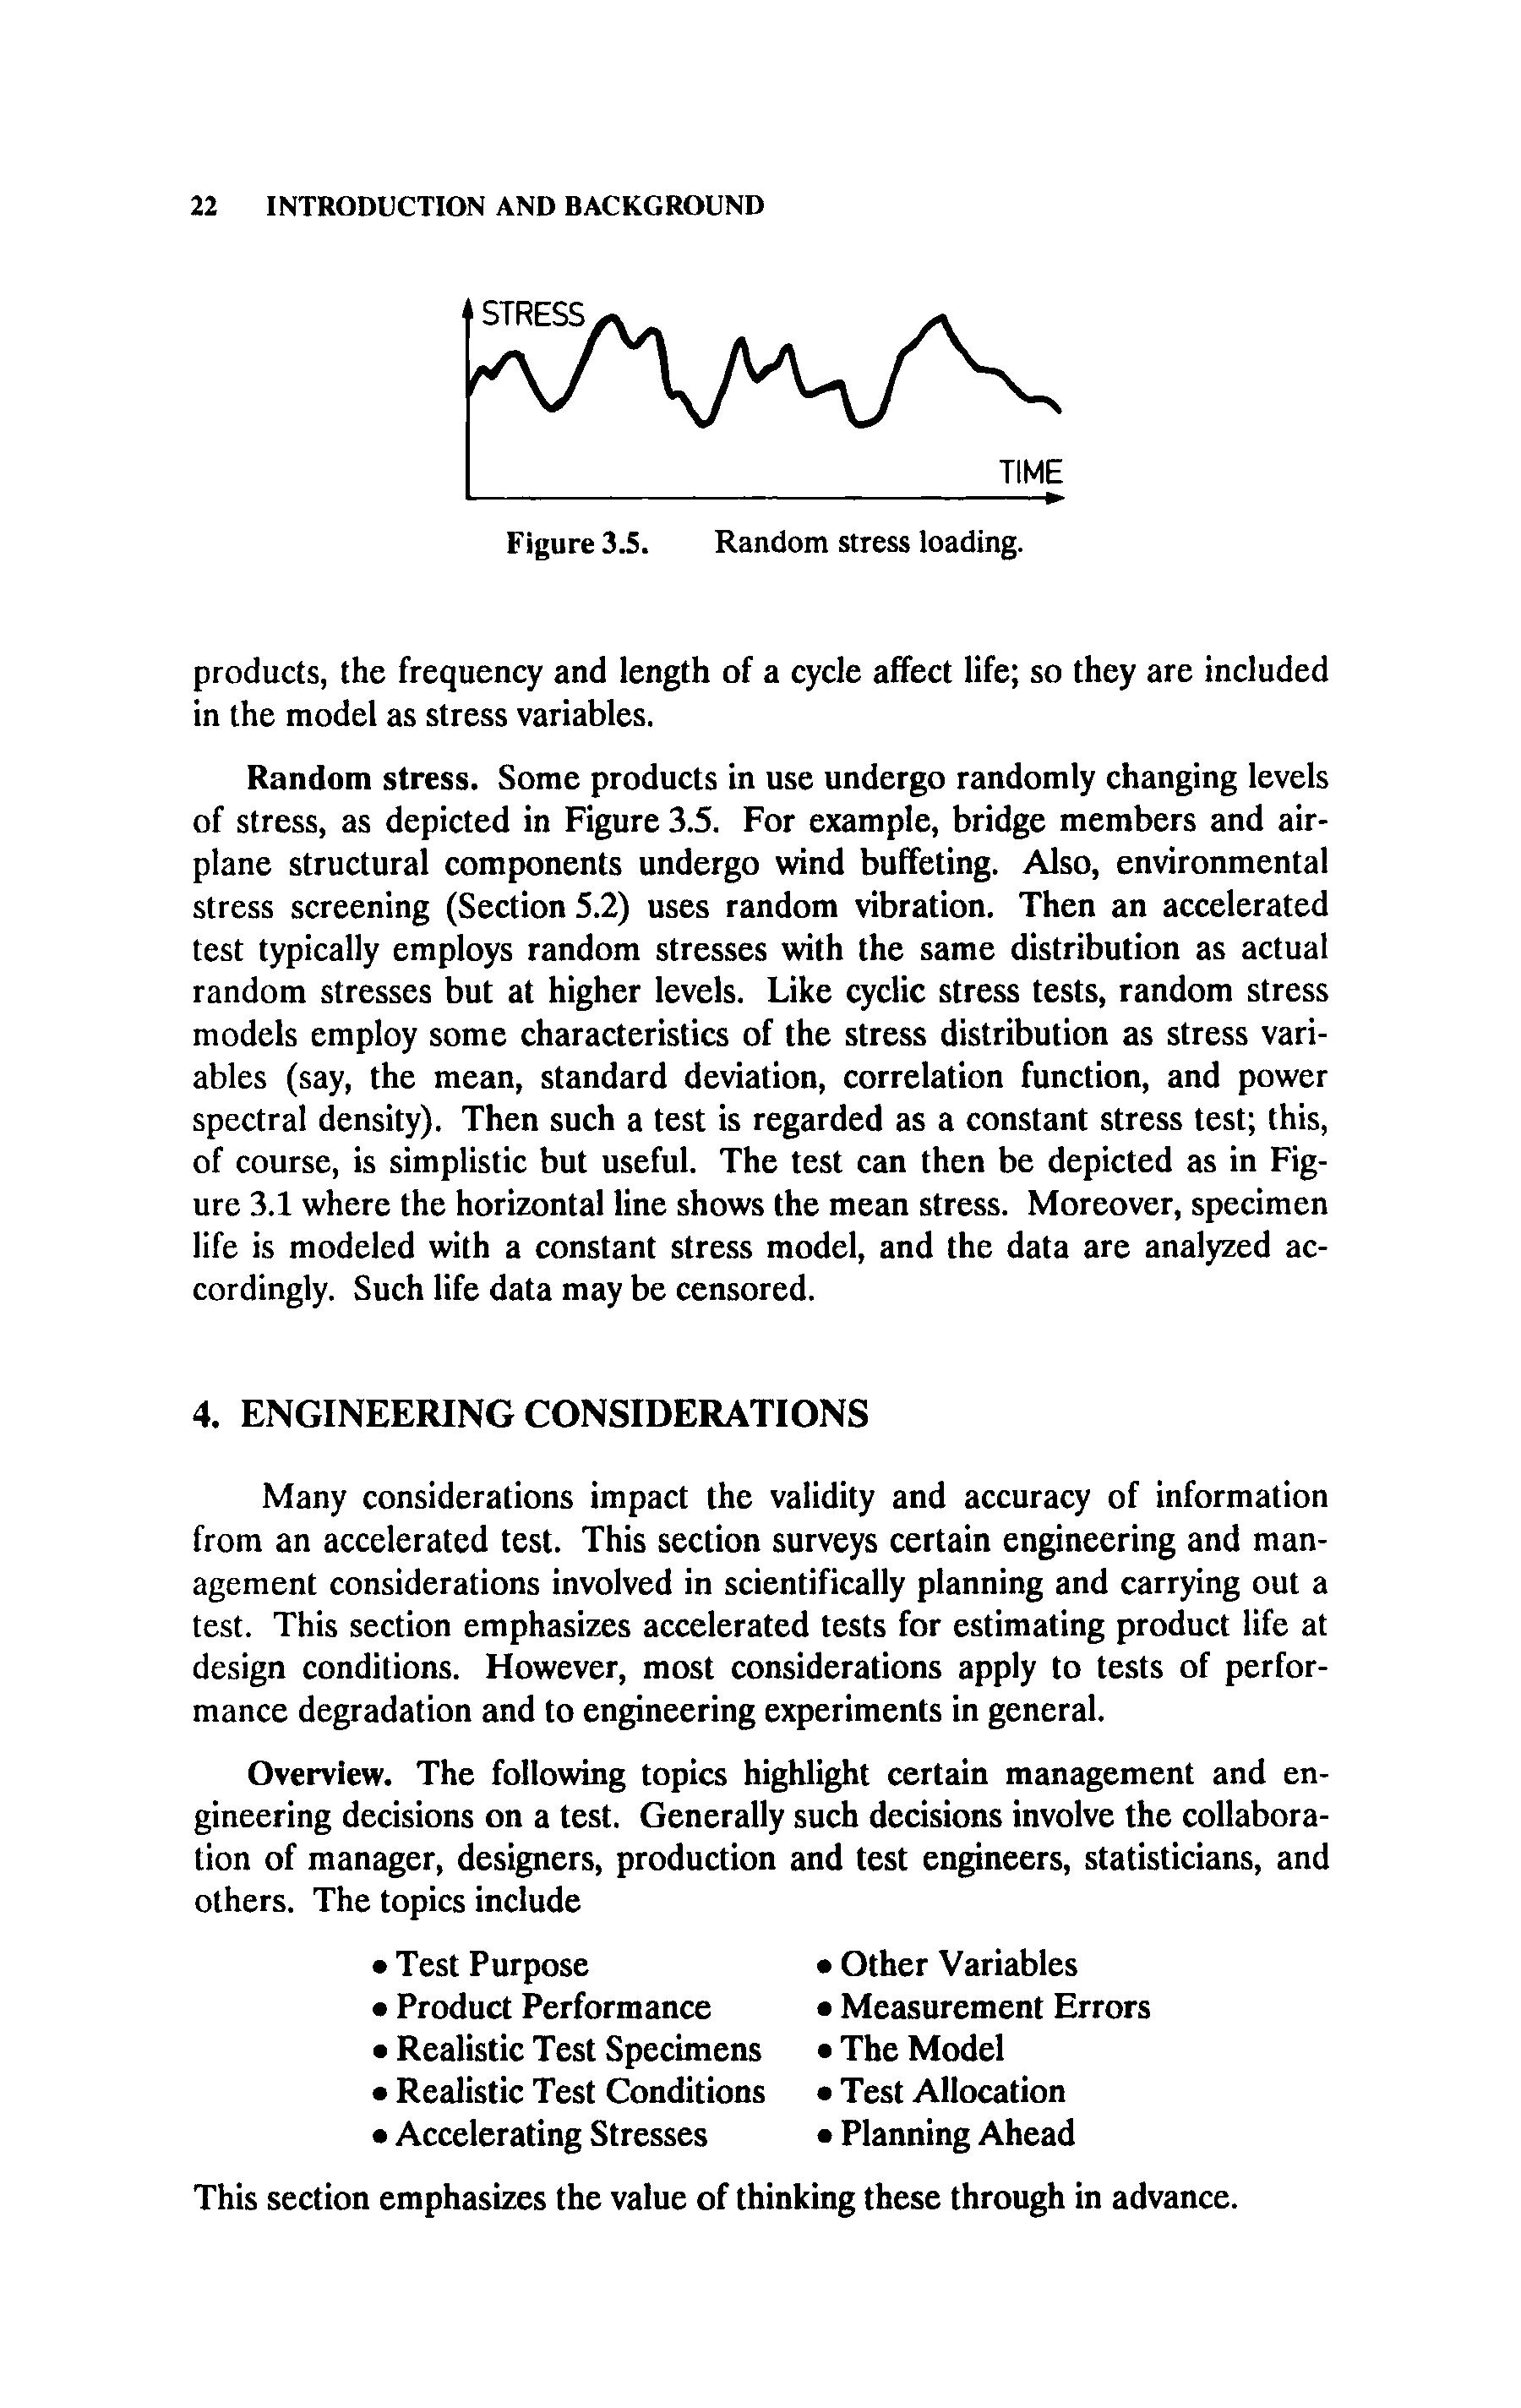
Random stress. Some products in use undergo randomly changing levels of stress, as depicted in Figure 3.5. For example, bridge members and airplane structural components undergo wind buffeting. Also, environmental stress screening (Section 5.2) uses random vibration. Then an accelerated test typically employs random stresses with the same distribution as actual random stresses but at higher levels. Like cyclic stress tests, random stress models employ some characteristics of the stress distribution as stress variables (say, the mean, standard deviation, correlation function, and power spectral density). Then such a test is regarded as a constant stress test; this, of course, is simplistic but useful. The test can then be depicted as in Figure 3.1 where the horizontal line shows the mean stress. Moreover, specimen life is modeled with a constant stress model, and the data are analyzed accordingly. Such life data may be censored.
4. ENGINEERING CONSIDERATIONS
Many considerations impact the validity and accuracy of information from an accelerated test. This section surveys certain engineering and management considerations involved in scientifically planning and carrying out a test. This section emphasizes accelerated tests for estimating product life at design conditions. However, most considerations apply to tests of performance degradation and to engineering experiments in general.
Overview. The following topics highlight certain management and engineering decisions on a test. Generally such decisions involve the collaboration of manager, designers, production and test engineers, statisticians, and others. The topics include
0 Test Purpose
0 Product Performance
0 Realistic Test Specimens
0 Realistic Test Conditions
0 Accelerating Stresses
0 Other Variables
0 Measurement Errors
0 The Model
0 Test Allocation
0 Planning Ahead
This section emphasizes the value of thinking these through in advance.
Test Purpose
ed tests of products.
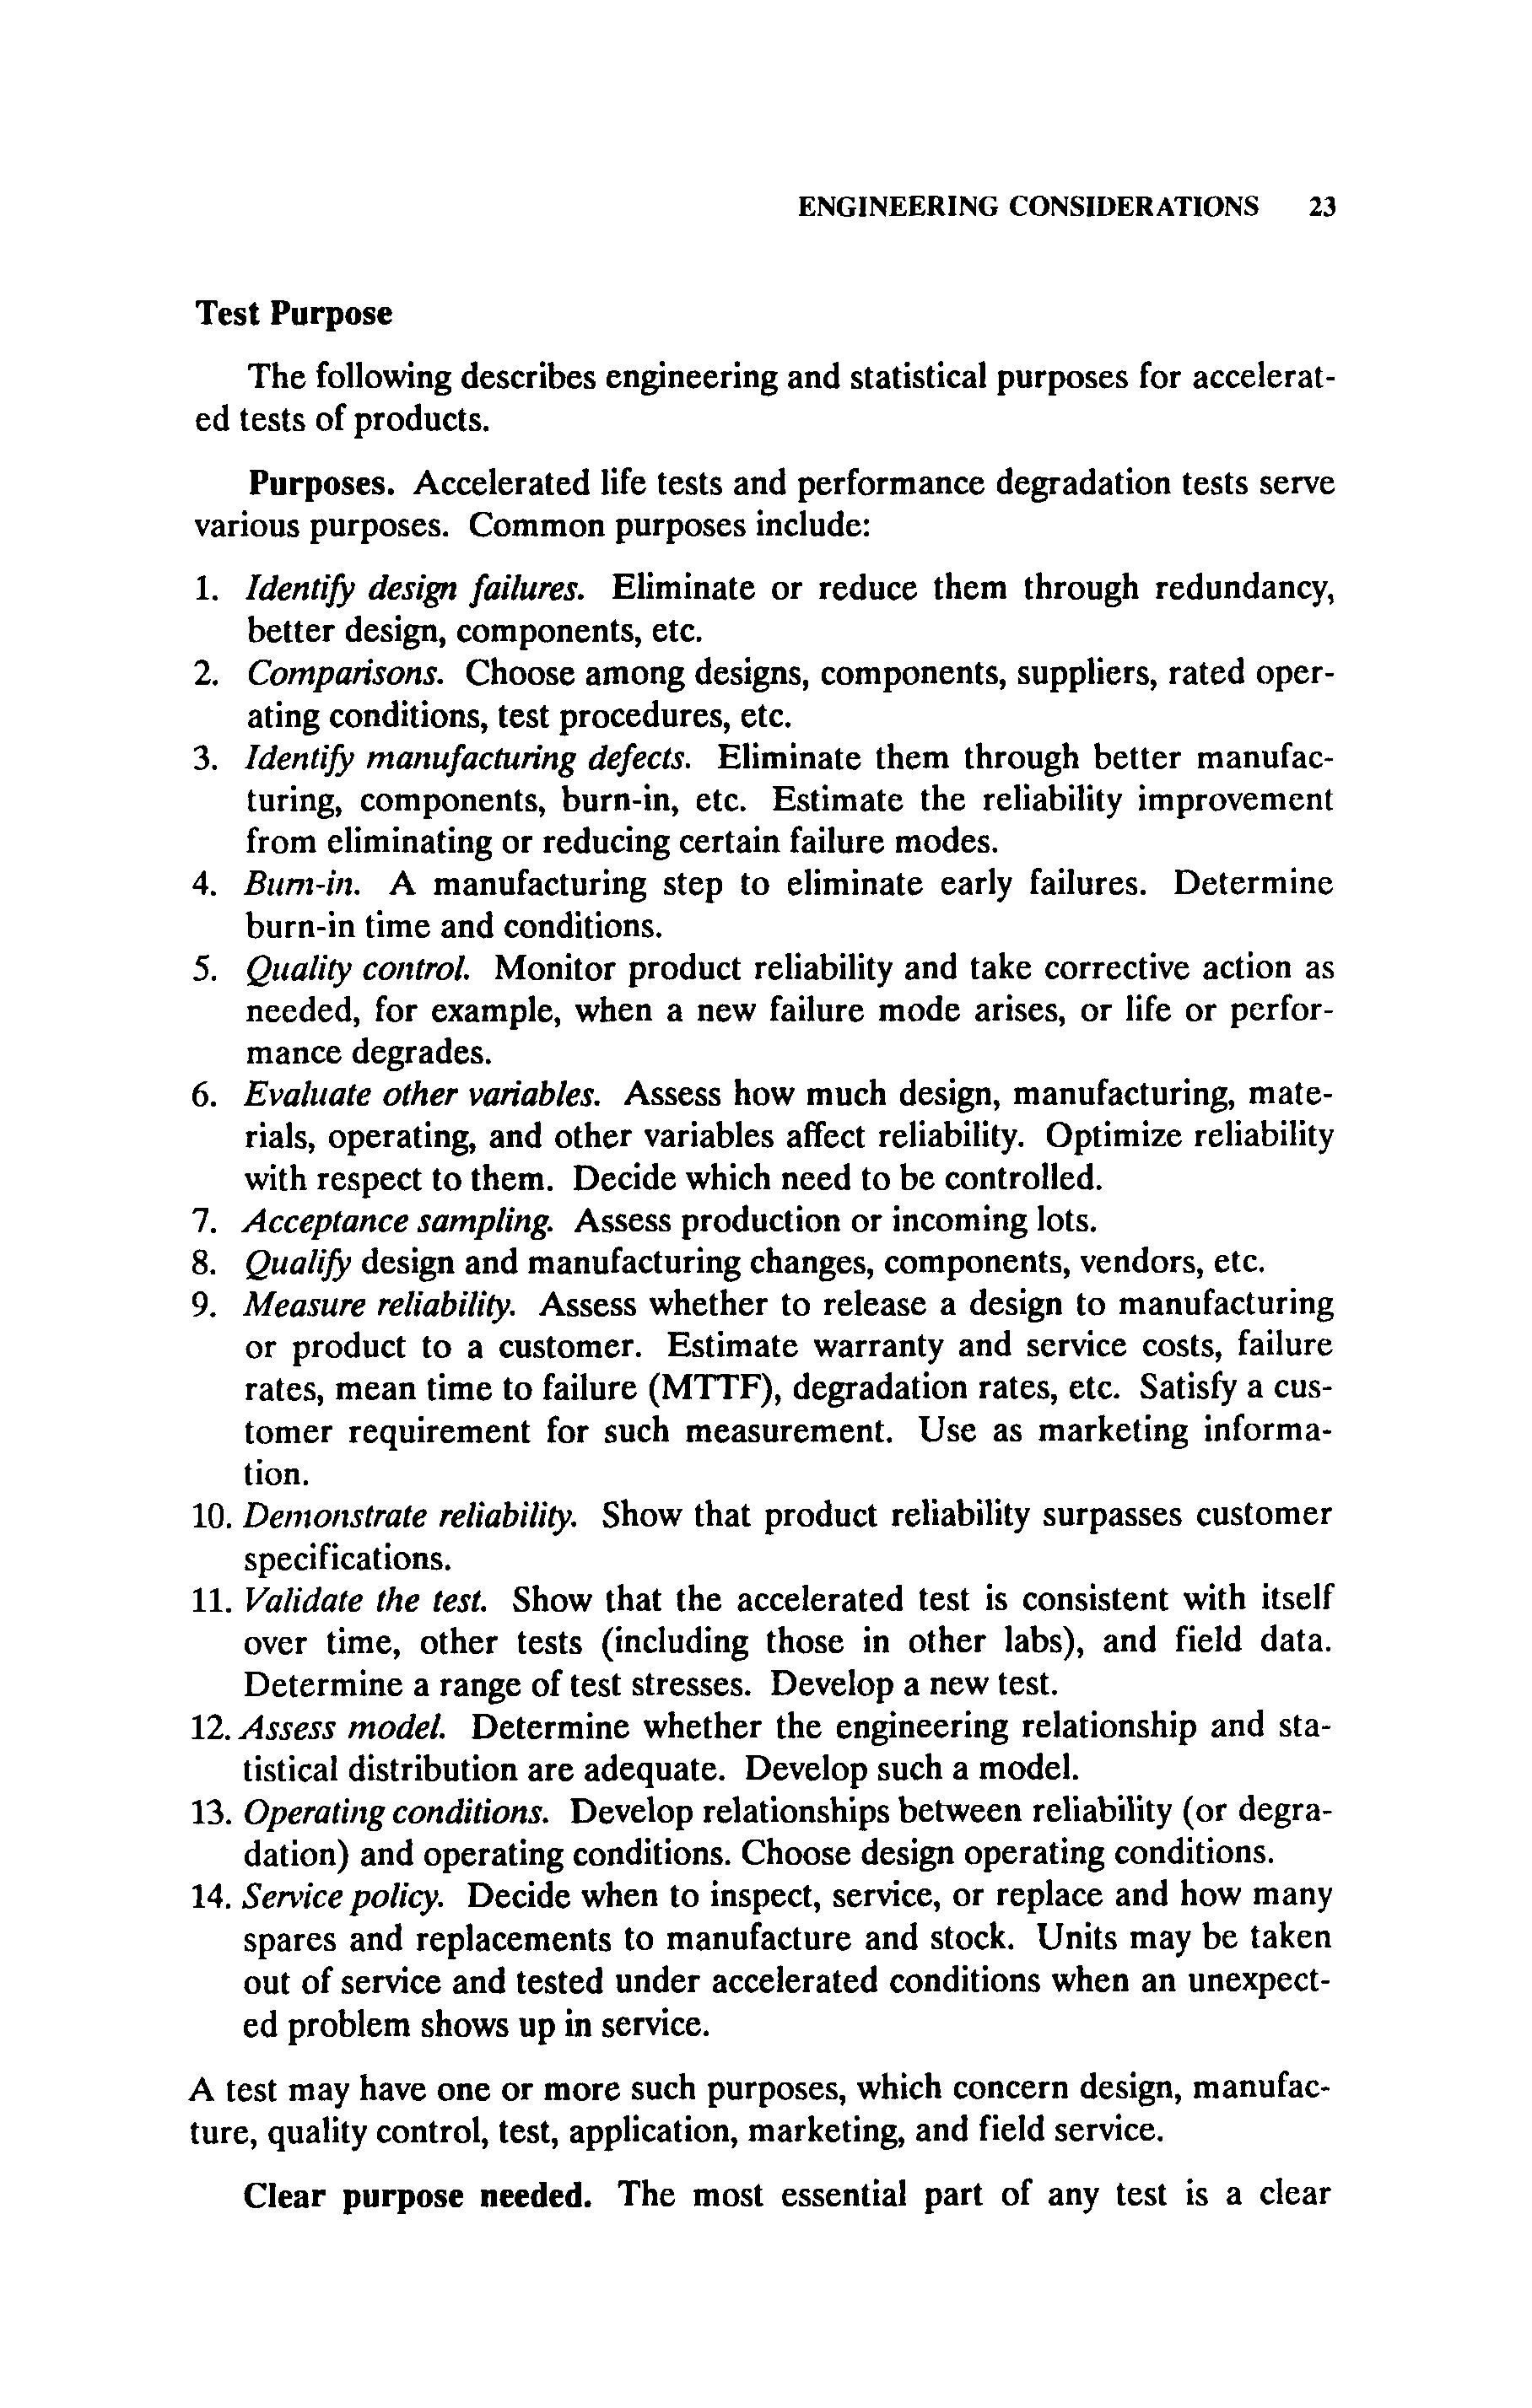
Purposes. Accelerated life tests and performance degradation tests serve
various purposes. Common purposes include: The following describes engineering and statistical purposes for accelerat-
ZdentifL design failures. Eliminate or reduce them through redundancy, better design, components, etc.
Comparisons. Choose among designs, components, suppliers, rated operating conditions, test procedures, etc.
ZdentifL manufacturing defects. Eliminate them through better manufacturing, components, burn-in, etc. Estimate the reliability improvement from eliminating or reducing certain failure modes.
Bum-in. A manufacturing step to eliminate early failures. Determine burn-in time and conditions.
Qitalify control. Monitor product reliability and take corrective action as needed, for example, when a new failure mode arises, or life or performance degrades.
Evalitate other variables. Assess how much design, manufacturing, materials, operating, and other variables affect reliability. Optimize reliability with respect to them. Decide which need to be controlled.
Acceptance sampling. Assess production or incoming lots.
QualifL design and manufacturing changes, components, vendors, etc.
Measure reliability. Assess whether to release a design to manufacturing or product to a customer. Estimate warranty and service costs, failure rates, mean time to failure (MTTF), degradation rates, etc. Satisfy a customer requirement for such measurement. Use as marketing information.
10. Demorislrate reliability. Show that product reliability surpasses customer specifications.
11. Validate the rest. Show that the accelerated test is consistent with itself over time, other tests (including those in other labs), and field data. Determine a range of test stresses. Develop a new test.
12. Assess model. Determine whether the engineering relationship and statistical distribution are adequate. Develop such a model.
13. Operating conditions. Develop relationships between reliability (or degradation) and operating conditions. Choose design operating conditions.
14. Senicepolicy. Decide when to inspect, service, or replace and how many spares and replacements to manufacture and stock. Units may be taken out of service and tested under accelerated conditions when an unexpected problem shows up in service.
A test may have one or more such purposes, which concern design, manufacture, quality control, test, application, marketing, and field service.
Clear purpose needed. The most essential part of any test is a clear
INTRODUCTION AND BACKGROUND
statement of the test purposes. Usually such engineering purposes concern decisions to be made by engineering and management. For example, they need (1) to decide whether an insulation will last long enough in service, (2) to decide which of several competing designs will last longest in service, or (3) to judge which manufacturing and service variables to control to prolong the service life of a product. These typical engineering and management decisions often must ultimately be made on the basis of test arid other information. Statistical methods, of course, do not provide answers nor make decisions. They merely provide numerical information on product performance. Thus, if statistical methods are to be used, the engineering purpose must also be expressed as a statistical purpose in terms of needed riunterical inifonnutiori on the product.
Statistical purpose. If an engineer (or manager) has difficulty specifying such needed numbers, the following may help. Imagine that one has all possible data on the entire population through all future time. Clearly the thousands or millions of individual data values are not used to aid a decision. A few simple useful numbers that describe the population need to be calculated from the mass of data. The engineer must decide which few numbers will help. Statistical analysis merely yields estimates of such population numbers from limited sample data. In addition, statistical test planning helps make those estimates more accurate, that is, closer to the true population values. Management and engineering must also specify how accurate such estimates must be for decision purposes. Thus, reiterating, engineers need to express their statistical purposes in terms of all data on the population and the useful population values to extract from that mass of data.
Examples. Such population values include the median life at design conditions, the percentage failing on warranty, the numerical relationship between product life and certain manufacturing variables, etc. This book presents statistical models, data analyses, and test plans for efficiently obtaining accurate estimates of such population values.
Performance
Choice of performance. Product performance is often measured in terms of life or physical properties. For example, cable insulation is measured with respect to mechanical properties (such as ultimate strength and percent ultimate elongation) and electrical properties (such as breakdown strength and dielectric loss). For a particular product, there usually are standard performance properties and methods for measuring them. They are outside the scope of this book, and they appear in engineering texts, standards, and handbooks. Certain properties degrade with product age, and such degradation may be accelerated by high stress levels. Such accelerated testing for performance degradation appears in Chapter 11. In statistical terminology, such a performance variable is called a dependent or response variable.
Failure. In accelerated life testing, time to failure is the performance characteristic or dependent variable. Thus “failure” must be precisely defined in practice. Agreement on a definition in advance is essential between producer and consumer to minimize misunderstandings and disputes. A discussion of “failure” follows.
Catastrophic failure. Many products undergo catastrophic failure; that is, they clearly and suddenly stop working. Incandescent light bulbs, for example, fail catastrophically.
Defined failure. For other products, performance degrades slowly over time, and there is no clear end of life. Then one can use a defined failure which occurs when performance first degrades below a specified value. For example, jet engine parts have four definitions of failure. (1) Critical parts “fail” when a crack initiates. In practice, this means when the crack is first detectable. (2) Less critical parts “fail” when the crack first reaches a specified size. (3) Any part “fails” when removed from service, usually the result of an inspection that shows that the part exceeds definition (1) or (2). This definition certainly is meaningful to accountants and top management. (4) Any jet engine part “fails” when there is a “part separation’’ - a marvelous engineering euphemism for catastrophic failure.
Coffee maker. Modern electric coffee makers heat water by passing it through heated tubing. In use, mineral build-up inside the tubing constricts the opening. This build-up gradually increases the time to make a pot of coffee. Engineers developed an accelerated test to study this problem - the sludge test. It was used to compare tubing designs, including competitors’ designs. The test involved repeatedly running a coffee maker with a mineral-rich slurry that quickly produced build-up. By definition, a coffee maker “failed” on the first pot that took longer than 20 minutes. Of course, 20 minutes is a reasonable but arbitrary time; it owes much to the number of fingers we have. 17.2 minutes would be as good.
Customer-defined Failure. One other definition is worth noting. The product “fails” when the customer says it fails. Marketing and top management take this definition seriously. Many failures as defined by engineering are not severe enough to concern customers.
The right definition. Which of several definitions is the right one? All are. Each has value. In practice, one can use several and analyze the data separately according to each. Each yields information. The definition of failure is an engineering or management decision.
Usage/exposure. Time to failure is only one possible measure of usage or exposure. For some products, other measures are used. Ball bearing usage is the number of revolutions. For non-rechargable battery cells, energy output is the usage. Locomotive usage is miles. Usage of many products is
the number of duty cycles. Examples include toasters, dishwashers, rechargable battery cells, switches, and circuit breakers. Many such “cycled” products have customer warranties for a specified calendar time (for example, one year), although cycle usage differs greatly from customer to customer. Throughout this book “time” means any measure of usage. Even if using time, one must decide whether to measure it starting on the date of product installation or manufacture. Sometimes installation dates are not known. Also, if the product runs only part of the time, one must decide whether to measure the actual running time or merely use calendar days in service. Calendar days is usually easier and cheaper to determine. The choice of exposure and how to measure it are engineering and management decisions.
Realistic Test Specimens
Specimen versus product. Many test specimens differ from the actual product. Engineers realize that specimen life may differ from product life. Then they assume that specimen life is comparable to or below product life. Some differences between specimens and product are obvious, and others are subtle. Examples follow. It generally is worth the effort to use the actual product to get more accurate information. Statisticians will only acknowledge that specimen tests yield estimates of specimen life - not product life. Engineers must make the leap of faith from specimen life to product life.
Motor insulation. Specimens of motor insulation are usually motorettes - not motors. Motorettes contain phase, ground, and turn insulation, as do motors. The amount and geometry of such insulations differ from those in motors. Moreover, a motorette has no moving parts; it merely contains distinct samples of three insulations on substrates similar to those in a motor.
Metal fatigue. Metal fatigue specimens are often small cylinders. Metal parts are generally larger, have complex geometry with sharp corners that locally raise stress, have different surface treatment, etc. Engineers in airframe, jet engine, and other businesses partly compensate for these differences by running parts only one-third as long as the specimens would survive. For example, if 1 specimen in 1,OOO fails by 30,OOO cycles, the part is removed from service at 30,OOO/3= 10,OOO cycles.
Cable insulation. Most specimens of cable insulation range in length from one-half to several feet. Usually, but not always, the conductor crosssection and insulation geometry and thickness are the same as in actual cable. Being much shorter, specimens have much longer lives than actual cable, typically many miles long. The cable can be regarded as a large number of specimens (end to end), and the cable fails when the first specimen fails. Statistical models for the effect of size appear in Chapter 7.
Sampling bias. Even when test specimens are the actual product, they usually are not a random sample. They are usually a biased sample and do not adequately represent the population. For example, an accelerated test of
a new product typically uses prototype units. They may be fabricated in a lab or model shop. Even if made on the production line, they may differ from later production units. The design or the manufacturing process always changes during production. Some changes are obvious and intentionalnew materials, cost savings, new vendors, etc. Others are subtle and often unrecognized - a vendor’s process changes, plant humidity changes, employees start cleaning their bowling balls in the ultrasonic cleaning equipment for the product, etc. Quality control engineers spend much time hunting such unknown production changes that degrade the product. Engineers generally recognize that prototypes differ from production product.
Representative sample. A representative sample is best for estimating the reliability of a product population. Such a sample is heterogeneous and includes specimens from many production periods or batches. Ideally it is a truly random sample from the population. For other purposes, a homogeneous sample may serve better. For example, to compare two methods of manufacture, a homogeneous sample of specimens is randomly divided between the two methods. Due to the smaller variability between homogeneous specimens, the comparison will detect smaller differences between the two methods. Similarly, test variables such as humidity, temperature, etc., may be held constant over all specimens to minimize variability in a comparison. For still other purposes, sample specimens with atreme values of observed covariates may be chosen for a test. Such a wide range of covariate values provides more accurate estimates of their effects. Taguchi (1987), among others, advocates this in experiments with manufacturing processes.
What is the specimen? The following example suggests that the definition of “specimen” may need to be clarified. Much metal fatigue testing employs cylindrical specimens. At each end, a cylindrical specimen flares to a greater diameter, which the test machine grips. Failure can occur in the cylindrical portion, in the flare, or in the grips. Often just the cylindrical portion is regarded as the specimen. Then if the flare or grip portion fails, the cylindrical portion is treated as a run-out 6th that number of cycles. Another viewpoint was well expressed by a test technician - you can’t ignore a failure in the grips, there’s information in it. In practice, one benefits from analyzing the data with each definition of specimen.
Realistic Test Conditions
Test versus real use. Many accelerated tests attempt to simulate actual use conditions, except for the high level of the overstress variable. Ideally test conditions should exactly reproduce use conditions. Indeed much engineering thought and effort goes into making tests realistic. Professional societies issue standards for conducting tests. This is done to assure that the data accurately reflect product reliability in actual use. Nevertheless, many tests differ much from actual use but may still be useful. Engineers msume (based on experience) that a product that performs well on such a test will